

Statistical tests for latent class in censored data due to detection limit
- PMID: 31736411
- PMCID: PMC7231674
- DOI: 10.1177/0962280219885985
Statistical tests for latent class in censored data due to detection limit
Abstract
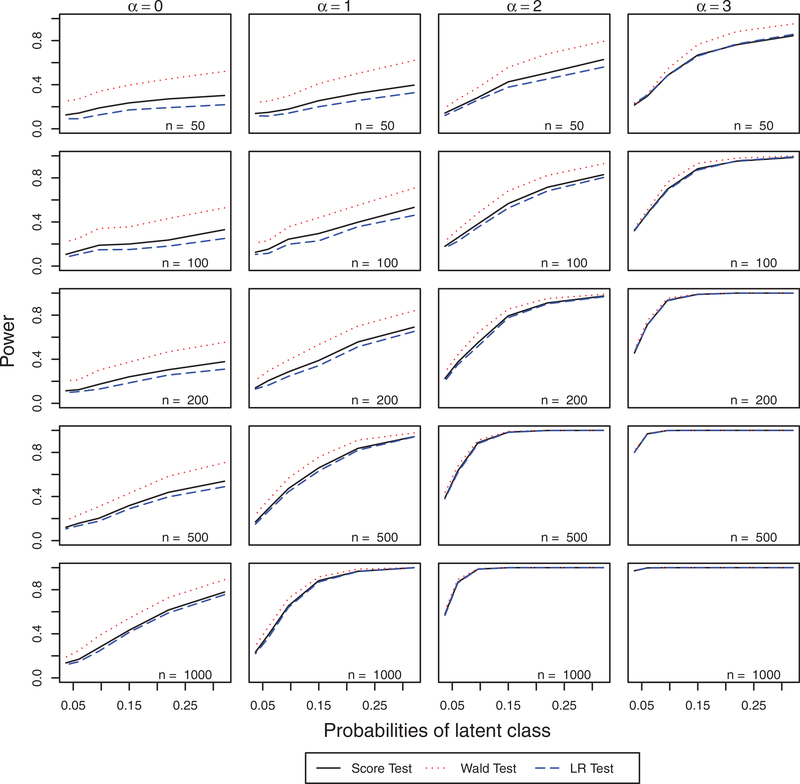
Measures of substance concentration in urine, serum or other biological matrices often have an assay limit of detection. When concentration levels fall below the limit, the exact measures cannot be obtained. Instead, the measures are censored as only partial information that the levels are under the limit is known. Assuming the concentration levels are from a single population with a normal distribution or follow a normal distribution after some transformation, Tobit regression models, or censored normal regression models, are the standard approach for analyzing such data. However, in practice, it is often the case that the data can exhibit more censored observations than what would be expected under the Tobit regression models. One common cause is the heterogeneity of the study population, caused by the existence of a latent group of subjects who lack the substance measured. For such subjects, the measurements will always be under the limit. If a censored normal regression model is appropriate for modeling the subjects with the substance, the whole population follows a mixture of a censored normal regression model and a degenerate distribution of the latent class. While there are some studies on such mixture models, a fundamental question about testing whether such mixture modeling is necessary, i.e. whether such a latent class exists, has not been studied yet. In this paper, three tests including Wald test, likelihood ratio test and score test are developed for testing the existence of such latent class. Simulation studies are conducted to evaluate the performance of the tests, and two real data examples are employed to illustrate the tests.
Keywords: Censored normal regression; Tobit model; Wald test; detection limit; latent class; likelihood ratio test; mixture Tobit model; score test.
Conflict of interest statement
Declaration of conflicting interests
The author(s) declared no potential conflicts of interest with respect to the research, authorship, and/or publication of this article.
Figures


Similar articles
-
A new statistical test for latent class in censored data due to detection limit.Stat Med. 2021 Feb 10;40(3):779-798. doi: 10.1002/sim.8802. Epub 2020 Nov 6. Stat Med. 2021. PMID: 33159355
-
Joint modeling approaches for censored predictors due to detection limits with applications to metabolites data.Stat Med. 2024 Feb 20;43(4):674-688. doi: 10.1002/sim.9978. Epub 2023 Dec 3. Stat Med. 2024. PMID: 38043523
-
Modeling observations with a detection limit using a truncated normal distribution with censoring.BMC Med Res Methodol. 2020 Jun 29;20(1):170. doi: 10.1186/s12874-020-01032-9. BMC Med Res Methodol. 2020. PMID: 32600261 Free PMC article.
-
Setting Alert and Action Limits in the Presence of Significant Amount of Censoring in Data.PDA J Pharm Sci Technol. 2017 1/2;71(1):20-32. doi: 10.5731/pdajpst.2016.006684. Epub 2016 Aug 11. PDA J Pharm Sci Technol. 2017. PMID: 27516490
-
Estimation of low quantity genes: a hierarchical model for analyzing censored quantitative real-time PCR data.PLoS One. 2013 May 31;8(5):e64900. doi: 10.1371/journal.pone.0064900. Print 2013. PLoS One. 2013. PMID: 23741414 Free PMC article.
Cited by
-
Intensive Blood Pressure Lowering in Individuals With Low Diastolic Blood Pressure and Elevated Troponin Levels in SPRINT.J Am Heart Assoc. 2024 Mar 19;13(6):e032493. doi: 10.1161/JAHA.123.032493. Epub 2024 Mar 18. J Am Heart Assoc. 2024. PMID: 38497469 Free PMC article.
-
Defining Kidney Health Dimensions and Their Associations with Adverse Outcomes in Persons with Diabetes and CKD.Clin J Am Soc Nephrol. 2025 May 1;20(5):665-675. doi: 10.2215/CJN.0000000676. Epub 2025 Mar 14. Clin J Am Soc Nephrol. 2025. PMID: 40085155
-
Kidney tubule health, mineral metabolism and adverse events in persons with CKD in SPRINT.Nephrol Dial Transplant. 2022 Aug 22;37(9):1637-1646. doi: 10.1093/ndt/gfab255. Nephrol Dial Transplant. 2022. PMID: 34473302 Free PMC article. Clinical Trial.
-
Associations of High-Sensitivity Troponin and Natriuretic Peptide Levels With Serious Adverse Events in SPRINT.J Am Heart Assoc. 2022 Mar 15;11(6):e023314. doi: 10.1161/JAHA.121.023314. Epub 2022 Mar 4. J Am Heart Assoc. 2022. PMID: 35243872 Free PMC article.
-
Censoring in the time trade-off valuation of worse-than-dead EQ-5D-5L health states: can a time-based willingness-to-accept question be the solution?Qual Life Res. 2023 Apr;32(4):1165-1174. doi: 10.1007/s11136-022-03329-2. Epub 2022 Dec 24. Qual Life Res. 2023. PMID: 36564637
References
-
- Hornung Richard W and Reed Laurence D. Estimation of average concentration in the presence of nondetectable values. Appl Occupation Environment Hygiene 1990; 5: 46–51.
-
- Jamjoum LS, Bielak LF, Turner ST, et al. Relationship of blood pressure measures with coronary artery calcification. Med Sci Monitor 2002; 8: CR775–CR781. - PubMed
-
- Reilly MP, Wolfe ML, Russell Localio A, et al. Coronary artery calcification and cardiovascular risk factors: impact of the analytic approach. Atherosclerosis 2004;173: 69–78. - PubMed
Publication types
MeSH terms
Grants and funding
LinkOut - more resources
Full Text Sources
