. 2019 Nov 1:13:1119.
doi: 10.3389/fnins.2019.01119. eCollection 2019.

Pitch Matching in Cochlear Implant Users With Single-Sided Deafness: Effects of Electrode Position and Acoustic Stimulus Type

Affiliations

Pitch Matching in Cochlear Implant Users With Single-Sided Deafness: Effects of Electrode Position and Acoustic Stimulus Type

Youssef Adel et al. Front Neurosci. .

Abstract

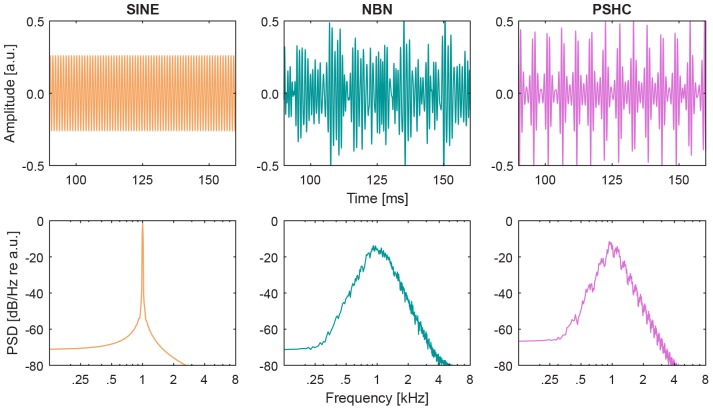
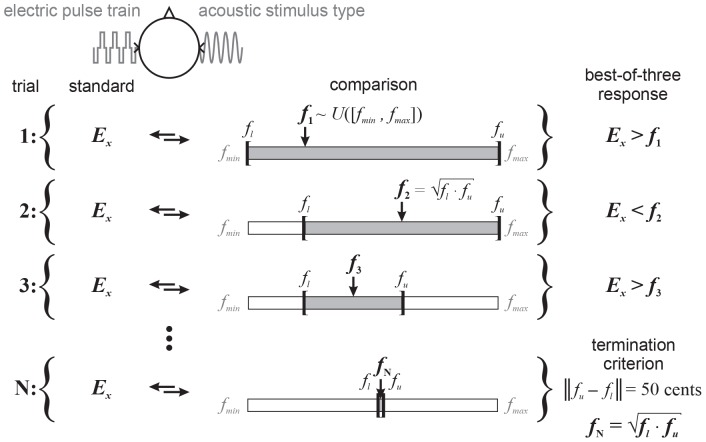
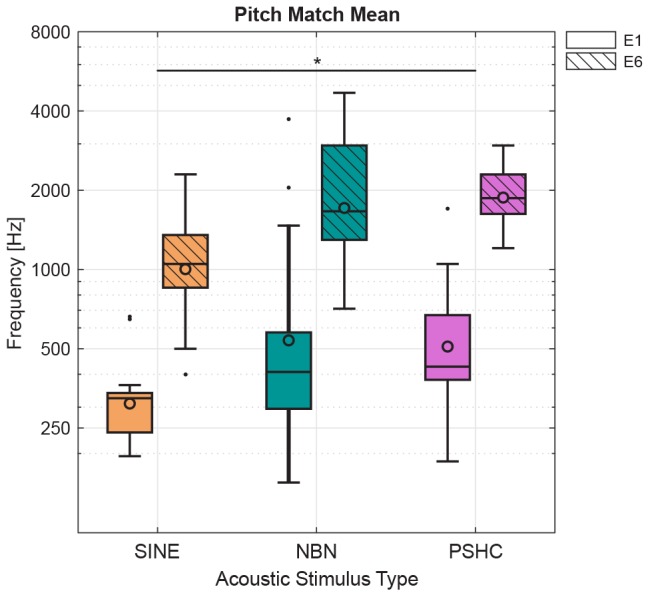
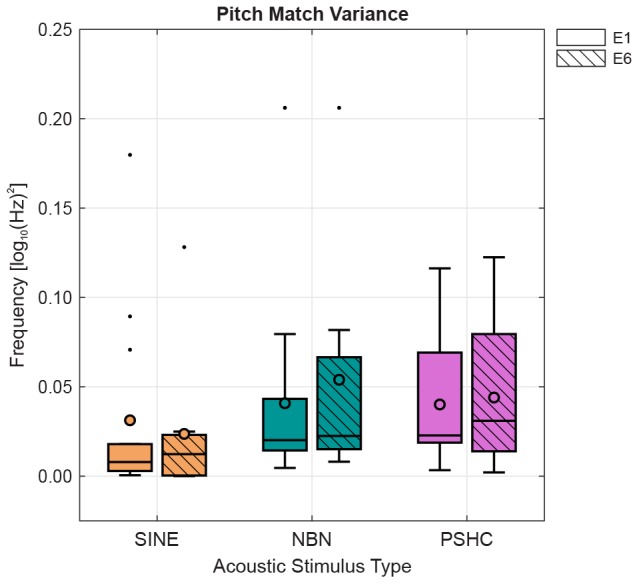
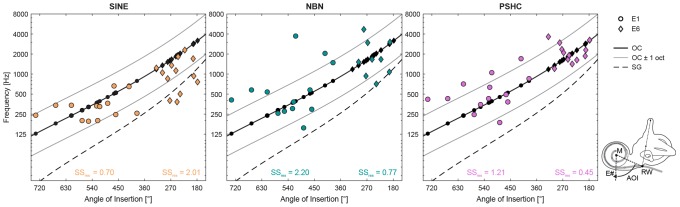
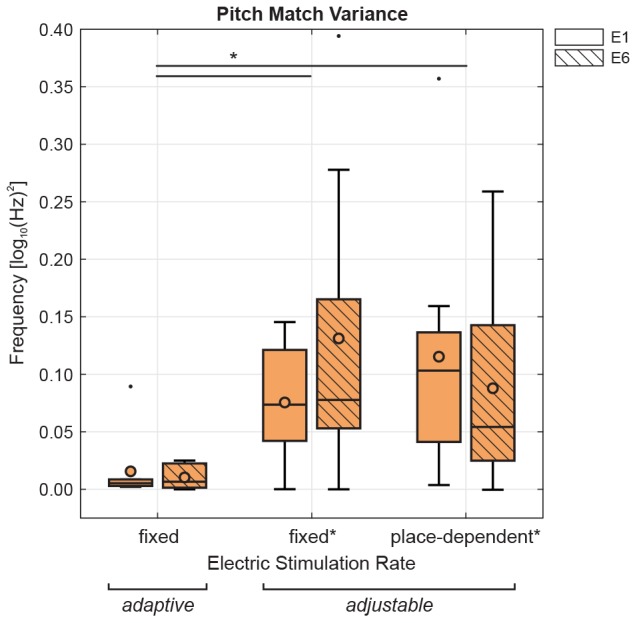
Previous studies in patients with single-sided deafness (SSD) have reported results of pitch comparisons between electric stimulation of their cochlear implant (CI) and acoustic stimulation presented to their near-normal hearing contralateral ear. These comparisons typically used sinusoids, although the percept elicited by electric stimulation may be closer to a wideband stimulus. Furthermore, it has been shown that pitch comparisons between sounds with different timbres is a difficult task and subjected to various types of range biases. The present study aims to introduce a method to minimize non-sensory biases, and to investigate the effect of different acoustic stimulus types on the frequency and variability of the electric-acoustic pitch matches. Pitch matches were collected from 13 CI users with SSD using the binary search procedure. Electric stimulation was presented at either an apical or a middle electrode position, at a rate of 800 pps. Acoustic stimulus types were sinusoids (SINE), 1/3-octave wide narrow bands of Gaussian noises (NBN), or 1/3-octave wide pulse spreading harmonic complexes (PSHC). On the one hand, NBN and PSHC are presumed to better mimic the spread of excitation produced by a single-electrode stimulation than SINE. On the other hand, SINE and PSHC contain less inherent fluctuations than NBN and may therefore provide a temporal pattern closer to that produced by a constant-amplitude electric pulse train. Analysis of mean pitch match variance showed no differences between stimulus types. However, mean pitch matches showed effects of electrode position and stimulus type, with the middle electrode always matched to a higher frequency than the apical one (p < 0.001), and significantly higher across-subject pitch matches for PSHC compared with SINE (p = 0.017). Mean pitch matches for all stimulus types were better predicted by place-dependent characteristic frequencies (CFs) based on an organ of Corti map compared with a spiral ganglion map. CF predictions were closest to pitch matches with SINE for the apical electrode position, and conversely with NBN or PSHC for the middle electrode position. These results provide evidence that the choice of acoustic stimulus type can have a significant effect on electric-acoustic pitch matching.

Keywords: binary search procedure; cochlear implant; non-sensory bias; pitch perception; pulse-spreading harmonic complex; simulation; single-sided deafness.


Figures

FIGURE 1
FIGURE 1
Stimulus waveforms (upper panels) and power spectrum densities (PSD, lower panels) are shown for each acoustic stimulus type: sinusoid (SINE), narrow-band noise (NBN), and pulse spreading harmonic complex (PSHC), all centered at 1 kHz.
FIGURE 2
FIGURE 2
Mean and standard deviation air conduction thresholds for the non-implanted ear, i.e., near-normal hearing (nNH, black) and implanted ear, i.e., cochlear-implant aided thresholds (gray) for all subjects (n = 13).
FIGURE 3
FIGURE 3
Illustration of the binary search procedure: each trial consists of a standard electric pulse train fixed in electrode position (Ex) throughout a given pitch matching run (trials 1 to N), and an acoustic stimulus type. Subjects are asked to indicate whether the standard or comparison is higher in pitch, with the order of presentation randomized between trials. The (center) frequency (fx,x ∈ {1,2,3,…,N}) of the acoustic stimulus is adaptively changed according to their response, which is evaluated in a best-of-three format for each trial. The starting frequency is randomly drawn from a uniform distribution, i.e., f1U([fmin,fmax]). The pitch matching range [fl,fu] initially has the same lower and upper boundaries. In this illustration, the electric stimulus is perceived higher in pitch than the acoustic stimulus at the starting frequency (trial 1), i.e., Ex > f1. Consequently, the lower boundary is set to that frequency and the next frequency (trial 2) set to the geometric mean of the current lower and upper boundaries, i.e., f2=flfu. The electric stimulus is then perceived lower in pitch than the acoustic stimulus, i.e., Ex < f2, and the upper boundary is set to that frequency. The next frequency (trial 3) is again set to the geometric mean of the current boundaries. This iterative process is terminated (trial N) when the difference between lower and upper boundaries is a quarter-tone (i.e., 50 cents). The final pitch match fN is defined as the geometric mean of the final boundaries.
FIGURE 4
FIGURE 4
Example of pitch matching runs for each stimulus type (SINE, NBN, or PSHC), for a given subject (S11) and electrode position (E6). The dashed horizontal gridline shows the maximum frequency at 4 kHz. For each trial, comparison (center) frequency is shown as squares. And the final pitch matches are shown as diamonds. In one pitch matching run of NBN (dashed line), the subject appears to have perceived the pitch very close to (or possibly above) the maximum frequency, but was hindered by the procedure’s parameters.
FIGURE 5
FIGURE 5
Pitch match means for each stimulus type (SINE, NBN, or PSHC) and for each electrode position (E1 or E6) as boxplots with grand geometric means indicated as circles. Two-way repeated-measures ANOVA showed a significant effect of electrode position [F(1,8) = 74.1, p < 0.001] and acoustic stimulus type [F(2,16) = 5.50, p = 0.015]. Pairwise comparisons showed significant differences between electrode positions E1 and E6 (p < 0.001, not shown here) and between stimulus types SINE and PSHC (p = 0.017), whereas the difference between SINE and NBN was marginally not significant (p = 0.07).
FIGURE 6
FIGURE 6
Pitch match variances for each stimulus type (SINE, NBN, or PSHC) and for each electrode position (E1 or E6) as boxplots with mean variances indicated as circles. Two-way repeated-measures ANOVA showed neither within-subject effects nor interaction effects.
FIGURE 7
FIGURE 7
Pitch match means for each stimulus type (SINE, NBN, or PSHC) and for each electrode position (E1 as circles, and E6 as diamonds) as a function of angle of insertion (AOI) estimated using the modified Stenvers’ projection (Verbist et al., 2010). The schematic of a left cochlea shows how the AOI was measured for a given electrode (E#) by clockwise rotation at the geometric zero reference, which was defined as the line between the crossing point of the electrode array (gray) with the round window (RW), and the modiolus (M). The organ of Corti (OC) frequency map ± 1 octave (solid black and gray curves, respectively) and the spiral ganglion (SG) frequency map (dashed black curve) are repeated in each panel. Predicted characteristic frequencies according to the OC map (black filled circles or diamonds) are shown in each panel along the OC map’s curve. Residual sum of squares [SSres, expressed in log10(Hz)] for the OC map is shown for each combination of acoustic stimulus type and electrode position.
FIGURE 8
FIGURE 8
Pitch match variances for each electrode position (E1 or E6) are compared in a subset of subjects previously tested using SINE (n = 9, Rader et al., 2016). Pitch matches were collected using either the binary search procedure (adaptive, from the current study) at a fixed rate of 800 pps, or the method of adjustment (adjustable, from the previous study as denoted by ) at a fixed rate of 800 pps or at the place-dependent rate. Two-way repeated-measures ANOVA showed a significant effect of matching method, with the binary search procedure significantly lower than the method of adjustment at either rate.

References

    1. Arnoldner C., Kaider A., Hamzavi J. (2006). The role of intensity upon pitch perception in cochlear implant recipients. Laryngoscope 116 1760–1765. 10.1097/01.mlg.0000228214.02606.42 - DOI - PubMed
    1. Boex C., Baud L., Cosendai G., Sigrist A., Kos M. I., Pelizzone M. (2006). Acoustic to electric pitch comparisons in cochlear implant subjects with residual hearing. J. Assoc. Res. Otolaryngol. 7 110–124. 10.1007/s10162-005-0027-2 - DOI - PMC - PubMed
    1. Boulet J., White M., Bruce I. C. (2015). Temporal considerations for stimulating spiral ganglion neurons with cochlear implants. J. Assoc. Res. Otolaryngol. 17 1–17. 10.1007/s10162-015-0545-5 - DOI - PMC - PubMed
    1. Brainard D. H. (1997). The psychophysics toolbox. Spat. Vis. 10 433–436. 10.1163/156856897x00357 - DOI - PubMed
    1. Carlyon R. P., Macherey O., Frijns J. H., Axon P. R., Kalkman R. K., Boyle P., et al. (2010). Pitch comparisons between electrical stimulation of a cochlear implant and acoustic stimuli presented to a normal-hearing contralateral ear. J. Assoc. Res. Otolaryngol. 11 625–640. 10.1007/s10162-010-0222-7 - DOI - PMC - PubMed