. 2019 Oct 30:13:471.
doi: 10.3389/fncel.2019.00471. eCollection 2019.

Dye Tracking Following Posterior Semicircular Canal or Round Window Membrane Injections Suggests a Role for the Cochlea Aqueduct in Modulating Distribution

Affiliations

Dye Tracking Following Posterior Semicircular Canal or Round Window Membrane Injections Suggests a Role for the Cochlea Aqueduct in Modulating Distribution

Sara Talaei et al. Front Cell Neurosci. .

Abstract

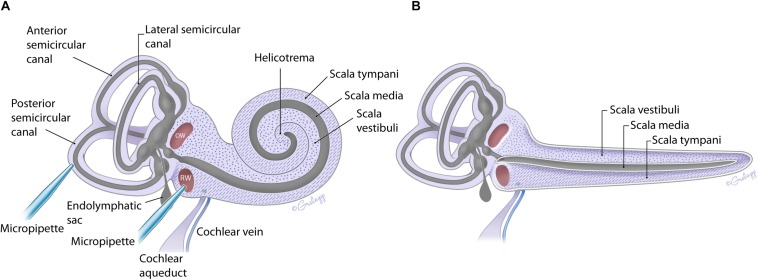
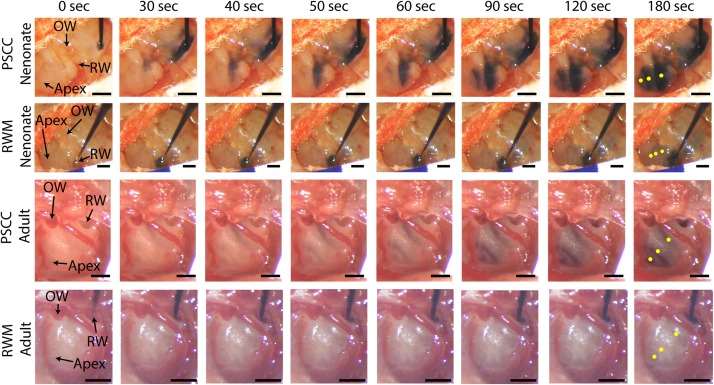
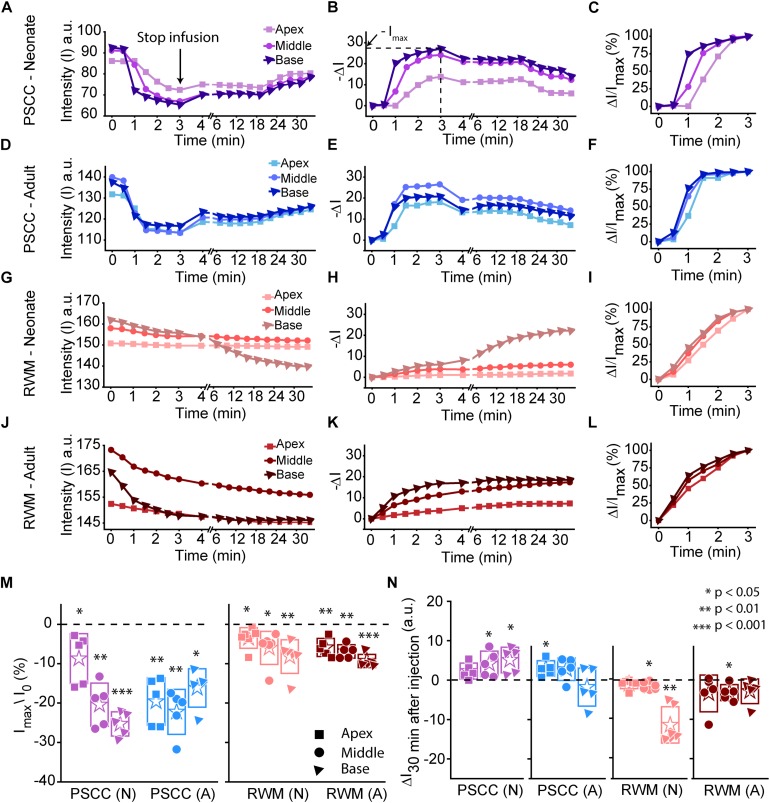
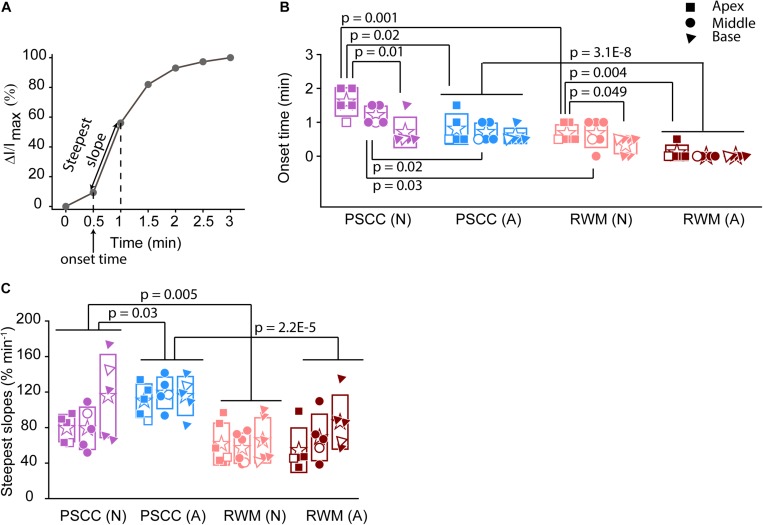
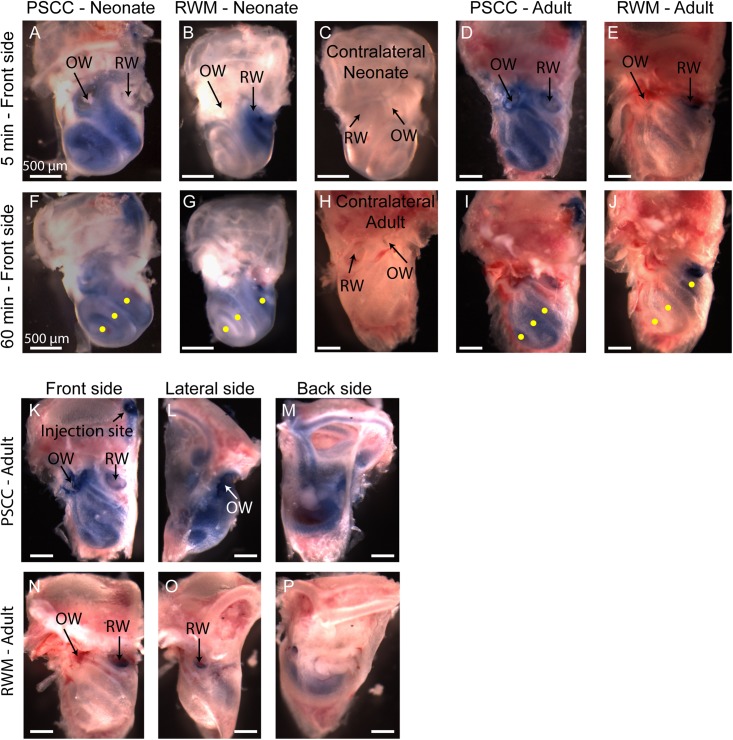
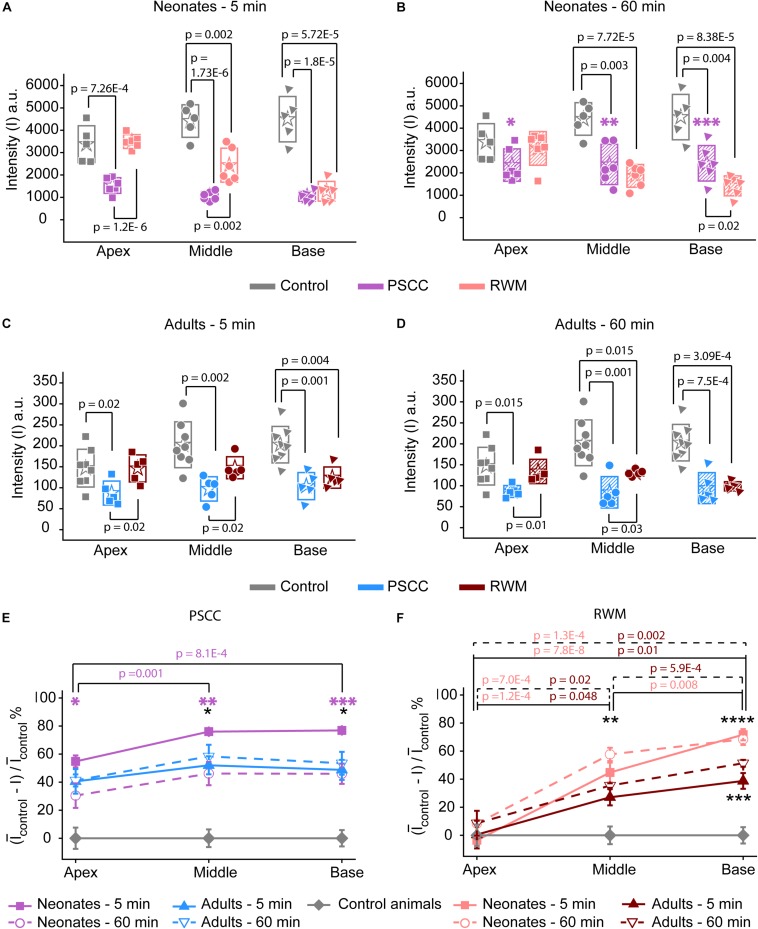
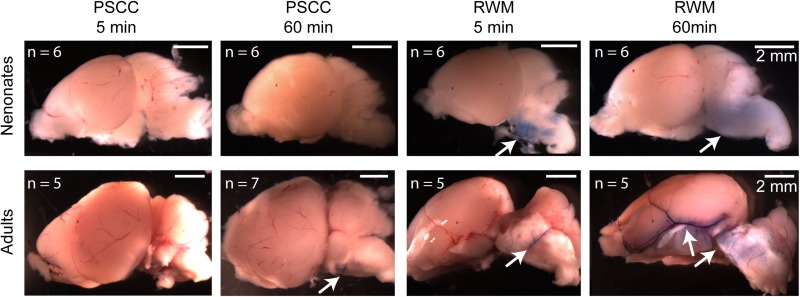
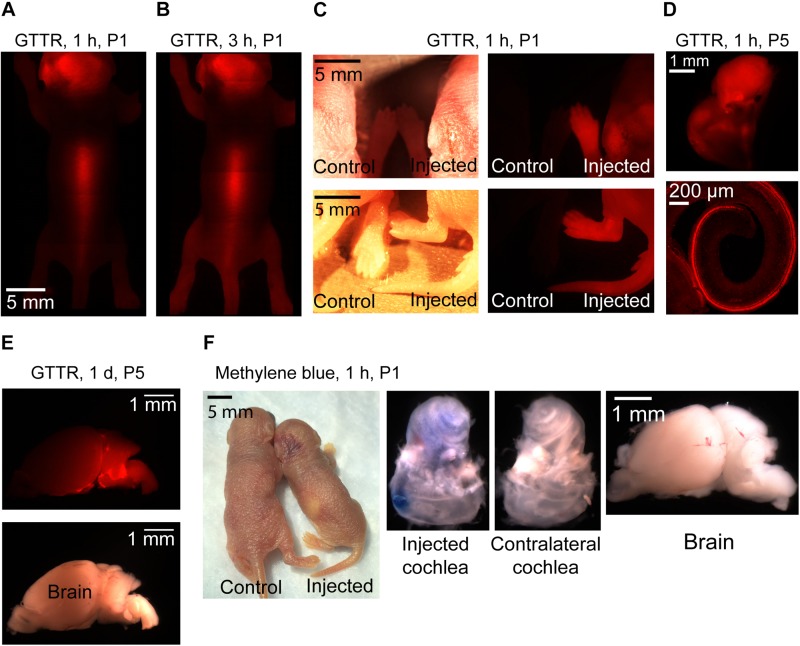
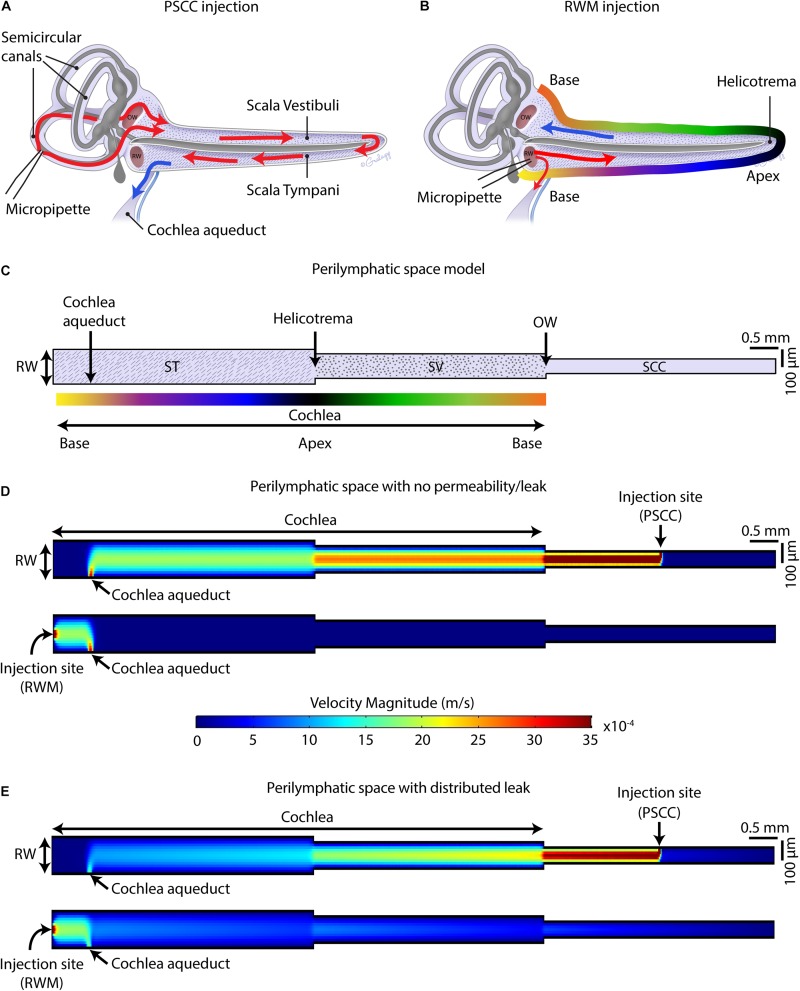
The inner ear houses the sensory epithelium responsible for vestibular and auditory function. The sensory epithelia are driven by pressure and vibration of the fluid filled structures in which they are embedded so that understanding the homeostatic mechanisms regulating fluid dynamics within these structures is critical to understanding function at the systems level. Additionally, there is a growing need for drug delivery to the inner ear for preventive and restorative treatments to the pathologies associated with hearing and balance dysfunction. We compare drug delivery to neonatal and adult inner ear by injection into the posterior semicircular canal (PSCC) or through the round window membrane (RWM). PSCC injections produced higher levels of dye delivery within the cochlea than did RWM injections. Neonatal PSCC injections produced a gradient in dye distribution; however, adult distributions were relatively uniform. RWM injections resulted in an early base to apex gradient that became more uniform over time, post injection. RWM injections lead to higher levels of dye distributions in the brain, likely demonstrating that injections can traverse the cochlea aqueduct. We hypothesize the relative position of the cochlear aqueduct between injection site and cochlea is instrumental in dictating dye distribution within the cochlea. Dye distribution is further compounded by the ability of some chemicals to cross inner ear membranes accessing the blood supply as demonstrated by the rapid distribution of gentamicin-conjugated Texas red (GTTR) throughout the body. These data allow for a direct evaluation of injection mode and age to compare strengths and weaknesses of the two approaches.

Keywords: cochlea aqueduct; drug delivery; endolymph; inner ear; perilymph; posterior semicircular canal; round window.


Figures

FIGURE 1
FIGURE 1
Schematic of the mouse inner ear with coiled (A) and uncoiled (B) configurations of the cochlea. The fluidic compartments for endolymph and perilymph are depicted in gray and light purple, respectively. The cochlea compartment of scala tympani is indicated with the hatch markings and scala vestibuli with the dots. All other compartments are as labeled. The approximate location of the injection pipette is illustrated for PSCC and RWM.
FIGURE 2
FIGURE 2
In vivo monitoring of trypan blue dye distribution along the cochlea during PSCC and RWM injection in neonatal and adult mice. In all experiments, the microinjection pump was turned on at 0 s injecting 1 μl of the dye at 300 nl/min. The regions of interest where the intensity was measured at apex, middle, and base for each experiment are shown in yellow in the last picture of each row (180 s). Scale bar is 500 μm. The X-axis provides time snapshots and the Y-axis the specific group being injected.
FIGURE 3
FIGURE 3
Representative plots obtained from one animal in each experimental group (n = 5, 6 in each group) showing dye distribution along the cochlea during PSCC and RWM injection in neonatal and adult mice from starting the pump up to 34 min. Injection time was from 0 to 3 min. Graphs (A,D,G,J) show the raw intensity measurements in the apex (squares), middle (circles), and base (triangles). Graphs (B,E,H,K) present intensity changes in the same regions at each time point with respect to the initial values at 0 min. ΔI is plotted with a reversed sign (–ΔI) so that larger numbers indicate increased dye. Imax was defined as the intensity change (ΔI) at 3 min. Graphs (C,F,I,L) show the percentage of intensity change at each time point, in respect to Imax, during injection. (M) Intensity changes 3 min after starting the pump in respect to the intensity values at 0 min (I0). Asterisks indicate levels of significant change in intensity values between 3 and 0 min at each cochlear region. (N) Intensity changes from 4 min (time point when the micropipette was removed) until 30 min later. Asterisks indicate levels of significant change in intensity values between 34 and 4 min at each cochlear region. Boxes represent standard deviations of the mean. Pair-sample t-test in panels (M,N) were used for calculating the p-values.
FIGURE 4
FIGURE 4
Analysis of normalized intensity changes in the cochlea during the injection period (0–3 min) (summary from data in Figure 3). In each plot N is neonatal and A is adult. Apical is represented by squares, middle by the circles, and base by triangles. Open symbols represent data from the individual examples presented in Figures 3A–L. Graph (A) describes the measured parameters presented in panels (B,C). (B) Onset time and (C) steepest slope obtained from individual animals as shown in the third column of Figure 3. Boxes represent standard deviations of the mean. In panels (B) and (C) statistical comparisons are done on pooled data showed with horizontal lines. Two-sample t-test in panels (B,C) were used for calculating the p-values.
FIGURE 5
FIGURE 5
Representative pictures of the mouse cochleae, after injecting trypan blue through RWM and PSCC, at 5- (A–E) and 60-min (F–J) post injection. The contralateral cochleae of neonatal and adult mice are also presented for comparisons (C,H). Regions of interest (100 μm diameter) where the average intensity values were measured are shown with yellow dots in (F,G,I,J). Front, lateral, and back side of adult mice, 5 min after injecting through PSCC (K–M) and RWM (N–P).
FIGURE 6
FIGURE 6
Ex vivo assessment of the presence of trypan blue in the PSCC and RWM injected and contralateral cochleae of neonatal mice at 5 (A) and 60 min (B), and adult mice, at 5- (C) and 60-min (D) post injection. The contralateral cochleae of neonatal and adult mice were used as control (non-injected) cochleae. Average intensity values measured within 100 μm regions (shown with yellow dots in Figures 5F,G,I,J) in apex, middle, and base. Measurements in panels (A,B) were taken from pictures with TIFF formats (12 bit) and panels (C,D) from the ones with JPEG (8 bit). Boxes represent standard deviations of the mean. Percentage of intensity change at each region of cochlea in respect to the control values at both time points for PSCC (E) and RWM (F) injected animals. Error bars represent standard errors. Purple asterisks in panels (B) and (E) indicate significant differences between data values at 60 min compared to 5 min at each cochlear region of PSCC injected neonates (p = 0.03, ∗∗p = 0.006, ∗∗∗p = 0.002). Black asterisks in panels (E,F) indicate significant differences between the data values for neonatal and adult mice (p = 0.006 at 5 min, ∗∗p = 0.003 at 60 min, ∗∗∗p = 8.3E–4 at 5 min, ****p = 0.007 at 60 min). Two-sample t-test was used for calculating the p-values between groups.
FIGURE 7
FIGURE 7
Representative brain pictures of the neonatal and adult mice injected with trypan blue through PSCC or RWM, 5 and 60 min after injection. Number of evaluated brains in each group of experiments is indicated. The arrows point to the regions where the dye was observed.
FIGURE 8
FIGURE 8
Representative pictures of GTTR and methylene blue distribution in neonatal mice after 1 μl injection into the left PSCC. n = 3 for all experiments except GTTR injection to P5 mice and evaluation at 1-h time point (n = 4). GTTR was observed through the skin of the animal, 1 (A) and 3 h (B) after injection. (C) Comparing injected and non-injected pups, 1 h after GTTR injection. The bright field and fluorescent images are shown in left and right panels, respectively. (D) GTTR in the injected cochlea, 1 h after injection to a P5 pup. Otic capsule and SCCs are shown in the top. Organ of corti is shown in the bottom. (E) Brain of the GTTR injected pup, 1 day after injection at P5. The bright field and fluorescent images are shown on the top and bottom images, respectively (F) 1 h after methylene blue injection to P1 pup.
FIGURE 9
FIGURE 9
Schematic of mouse cochlea in uncoiled configuration. Pathways of dye distribution in PSCC (A) and RWM (B) injections are shown in red. Blue arrows show the flow direction of perilymph during injection. (C) 2D geometry of the perilymphatic compartment applied for computational modeling of the flow during injections. Results of computing velocity magnitude along the perilymphatic compartment with (D) and without (E) permeability or leak in the walls. Injection sites (PSCC on the top and RWM on the bottom) were the fluid inlets and cochlea aqueduct was defined as the outlet.

Similar articles

Cited by

References

    1. Akil O., Blits B., Lustig L. R., Leake P. A. (2019). Virally mediated overexpression of glial-derived neurotrophic factor elicits age- and dose-dependent neuronal toxicity and hearing loss. Hum. Gene Ther. 30 88–105. 10.1089/hum.2018.028 - DOI - PMC - PubMed
    1. Akil O., Rebecca Seal P., Burke K., Wang C., Alemi A., During M., et al. (2012). Restoration of hearing in the vglut3 knockout mouse using virally mediated gene therapy. Neuron 75 283–293. 10.1016/j.neuron.2012.05.019 - DOI - PMC - PubMed
    1. Alyono J. C., Corrales C. E., Huth M. E., Blevins N. H., Ricci A. J. (2015). Development and characterization of chemical cochleostomy in the guinea pig. Otolaryngol. Head Neck Surg. 152 1113–1118. 10.1177/0194599815573703 - DOI - PubMed
    1. Askew C., Rochat C., Pan B., Asai Y., Ahmed H., Child E., et al. (2015). Tmc gene therapy restores auditory function in deaf mice. Sci. Trans. Med. 7:295ra108. 10.1126/scitranslmed.aab1996 - DOI - PMC - PubMed
    1. Carlborg B. (1981). On physiological and experimental variation of the perilymphatic pressure in the cat. Acta Otolaryngol. 91 19–28. 10.3109/00016488109138478 - DOI