. 2019 Oct 30:13:57.
doi: 10.3389/fnint.2019.00057. eCollection 2019.

Biomarkers Obtained by Transcranial Magnetic Stimulation of the Motor Cortex in Epilepsy

Affiliations

Biomarkers Obtained by Transcranial Magnetic Stimulation of the Motor Cortex in Epilepsy

Melissa Tsuboyama et al. Front Integr Neurosci. .

Abstract

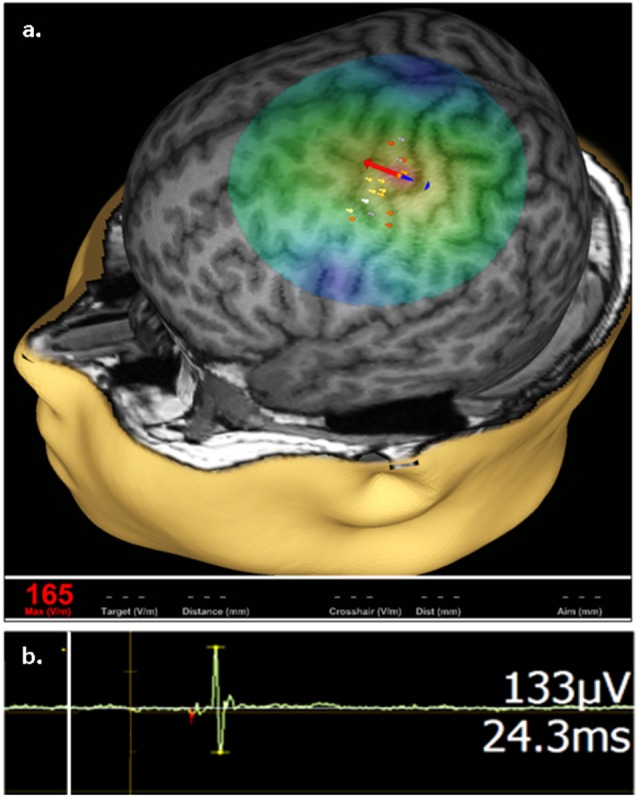
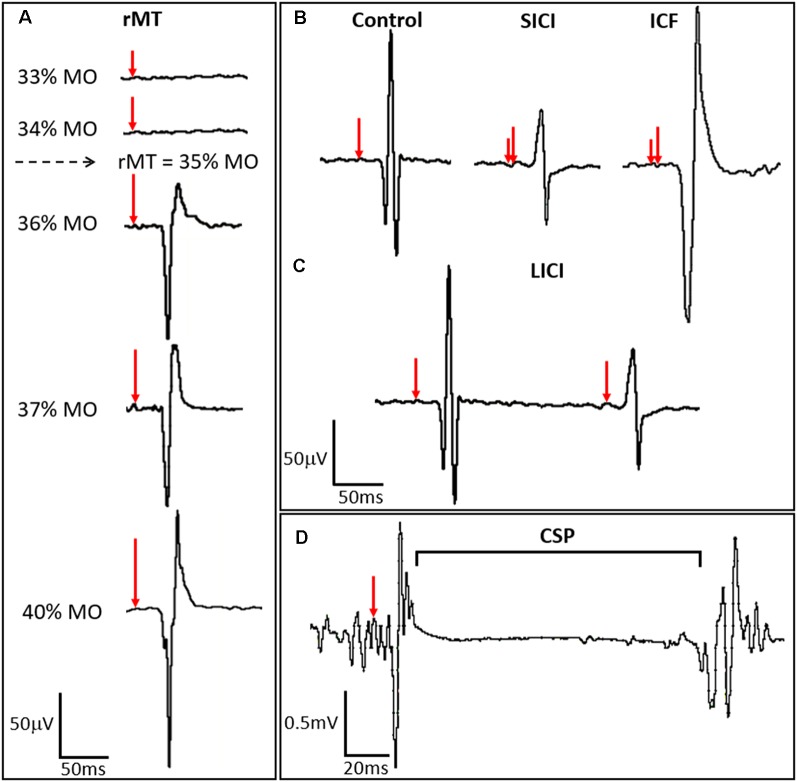
Epilepsy is associated with numerous neurodevelopmental disorders. Transcranial magnetic stimulation (TMS) of the motor cortex coupled with electromyography (EMG) enables biomarkers that provide measures of cortical excitation and inhibition that are particularly relevant to epilepsy and related disorders. The motor threshold (MT), cortical silent period (CSP), short interval intracortical inhibition (SICI), intracortical facilitation (ICF), and long interval intracortical inhibition (LICI) are among TMS-derived metrics that are modulated by antiepileptic drugs. TMS may have a practical role in optimization of antiepileptic medication regimens, as studies demonstrate dose-dependent relationships between TMS metrics and acute medication administration. A close association between seizure freedom and normalization of cortical excitability with long-term antiepileptic drug use highlights a plausible utility of TMS in measures of anti-epileptic drug efficacy. Finally, TMS-derived biomarkers distinguish patients with various epilepsies from healthy controls and thus may enable development of disorder-specific biomarkers and therapies both within and outside of the epilepsy realm.

Keywords: biomarker (development); classification; drug development and application; drug therapy; epilepsy—abnormalities; motor cortex excitability; neuromodulation; transcranial magnetic stimulation (TMS).


Figures

Figure 1
Figure 1
Representative transcranial magnetic stimulation (TMS) motor cortex activation. (A) An approximation of stimulating electric field (e-field) induced by a single TMS pulse is displayed on a 3D reconstruction of an individual’s anatomic magnetic resonance imaging (MRI), where field center is indicated by the junction between the red and blue arrows, indicating the direction of induced current, with corresponding e-field strength at the stimulation site (V/m) shown in red in the bottom left. The composite map of left hemispheric stimulation sites evoking motor evoked potentials (MEPs) of the right abductor pollicis brevis (APB) muscle, where intensity of response is color coded (heat map) from lowest (gray) to highest (white), are displayed on the cortical surface rendering. (B) Representative right APB MEP sample (green deflection) showing right APB resultant from left hemisphere stimulation, where the vertical line (white) corresponds to stimulus time. MEP amplitude and latency are indicated on the right.
Figure 2
Figure 2
TMS-derived metrics of motor cortex excitation and inhibition. (A) Resting motor threshold (rMT) for the APB muscle is calculated by identifying the minimum stimulus strength, measured in percent machine output (% MO), that evokes an MEP of a fixed amplitude (typically ≥50 μV) in the APB at rest in a majority of trials. Stimulus strength is indicated in the left panel, with resulting MEPs shown in the right panel, where red arrows indicate the time of stimulation and percent stimulator output is proportionate to the arrow length. (B) ppTMS paradigms where a subthreshold conditioning stimulus (short red vertical line) followed by a supra-threshold test stimulus (longer red vertical line). At short inter-stimulus-intervals (ISIs) (1–5 ms) short interval intracortical inhibition (SICI) is seen with inhibition of the test MEP by the antecedent conditioning stimulus. At longer ISIs (10–20 ms), test MEP amplitude is enhanced relative to the control MEP, such that ICF is seen. (C) Still longer ISIs (50–300 ms) are applied with two suprathreshold stimuli in LICI protocols where the MEP resultant from the test stimulus is predictably lower in amplitude than the preceding MEP resulting from the conditioning stimulus. In (D) the cortical silent period (CSP), interruption of ongoing electromyography (EMG) activity for a voluntarily contracting target muscle, occurs following single-pulse TMS (spTMS).

References

    1. Angehagen M., Rönnbäck L., Hansson E., Ben-Menachem E. (2005). Topiramate reduces AMPA-induced Ca2+ transients and inhibits GluR1 subunit phosphorylation in astrocytes from primary cultures. J. Neurochem. 94, 1124–1130. 10.1111/j.1471-4159.2005.03259.x - DOI - PubMed
    1. Badawy R. A. B., Jackson G. D., Berkovic S. F., MacDonell R. A. L. (2013). Cortical excitability and refractory epilepsy: a three-year longitudinal transcranial magnetic stimulation study. Int. J. Neural Syst. 23:1250030. 10.1142/s012906571250030x - DOI - PubMed
    1. Badawy R. A. B., MacDonell R. A. L., Berkovic S. F., Newton M. R., Jackson G. D. (2010). Predicting seizure control: cortical excitability and antiepileptic medication. Ann. Neurol. 67, 64–73. 10.1002/ana.21806 - DOI - PubMed
    1. Badawy R. A. B., MacDonell R. A. L., Vogrin S. J., Lai A., Cook M. J. (2012). Cortical excitability decreases in Lennox-Gastaut syndrome. Epilepsia 53, 1546–1553. 10.1111/j.1528-1167.2012.03599.x - DOI - PubMed
    1. Badawy R. A. B., Strigaro G., Cantello R. (2014). TMS, cortical excitability and epilepsy: the clinical impact. Epilepsy Res. 108, 153–161. 10.1016/j.eplepsyres.2013.11.014 - DOI - PubMed

LinkOut - more resources