. 2019 Oct 29:10:1006.
doi: 10.3389/fgene.2019.01006. eCollection 2019.

Improving Short- and Long-Term Genetic Gain by Accounting for Within-Family Variance in Optimal Cross-Selection

Affiliations

Improving Short- and Long-Term Genetic Gain by Accounting for Within-Family Variance in Optimal Cross-Selection

Antoine Allier et al. Front Genet. .

Abstract

The implementation of genomic selection in recurrent breeding programs raises the concern that a higher inbreeding rate could compromise the long-term genetic gain. An optimized mating strategy that maximizes the performance in progeny and maintains diversity for long-term genetic gain is therefore essential. The optimal cross-selection approach aims at identifying the optimal set of crosses that maximizes the expected genetic value in the progeny under a constraint on genetic diversity in the progeny. Optimal cross-selection usually does not account for within-family selection, i.e., the fact that only a selected fraction of each family is used as parents of the next generation. In this study, we consider within-family variance accounting for linkage disequilibrium between quantitative trait loci to predict the expected mean performance and the expected genetic diversity in the selected progeny of a set of crosses. These predictions rely on the usefulness criterion parental contribution (UCPC) method. We compared UCPC-based optimal cross-selection and the optimal cross-selection approach in a long-term simulated recurrent genomic selection breeding program considering overlapping generations. UCPC-based optimal cross-selection proved to be more efficient to convert the genetic diversity into short- and long-term genetic gains than optimal cross-selection. We also showed that, using the UCPC-based optimal cross-selection, the long-term genetic gain can be increased with only a limited reduction of the short-term commercial genetic gain.

Keywords: Bulmer effect; genetic diversity; genomic prediction; optimal cross-selection; parental contributions; usefulness criterion.


Figures

Figure 1
Figure 1
Schematic view of the simulated breeding program. (A) Overall view of the breeding program and overlapping cohorts. (B) Life cycle of a given post burn-in cohort T depending on the scenario considered (TRUE with 1,000 known QTL effects, PS in absence of genomic information or GS with 2,000 noncausal SNPs estimated effects).
Figure 2
Figure 2
Targeted diversity trajectories for three different shape parameters (s = 1, linear trajectory; s = 2, quadratic trajectory; and s = 0.5, inverse quadratic trajectory) for fixed initial diversity (He0 = 0.3) at generation 0 and targeted diversity (He* = 0.01) at generation 60 (t* = 60). We considered in this study only linear trajectories (s = 1).
Figure 3
Figure 3
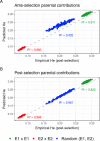
Squared correlations (R²) between predicted genetic diversity (He) and empirical He in the selected fraction of progeny of a set of 20 biparental crosses in the TRUE scenario considering (A) ante-selection parental contributions or (B) post-selection parental contributions to predict He. In total, 100 sets of each three types of crosses (intrageneration: E1xE1 and E2xE2 or randomly intragenerations and intergenerations): random (E1, E2) are shown, and the squared correlations between predicted and empirical post-selection He are given in the corresponding color.
Figure 4
Figure 4
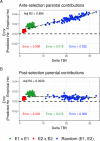
Mean prediction error (predicted − empirical) of predicting the genetic diversity (He) in the selected fraction of progeny of a set of 20 biparental crosses in the TRUE scenario depending on the mean difference of performance between parents (Delta true breeding value TBV). Mean prediction error is measured as the predicted He − empirical post-selection He, considering (A) ante-selection parental contributions or (B) post-selection parental contributions to predict He. In total, 100 sets of each three types of crosses (intrageneration: E1 × E1 and E2 × E2 or randomly intra and inter-generations): random (E1, E2) are shown, and the averaged errors are given in the corresponding color.
Figure 5
Figure 5
Genetic gains for different cross-selection indices in the TRUE scenario (PM: parental mean, UC: usefulness criterion, OCS-He*: optimal cross-selection and UCPC-He*: UCPC-based optimal cross-selection) according to the generations. (A) Genetic gain (G) measured as the mean of the whole progeny, (B) commercial genetic gain (G10) measured as the mean of the 10 best progeny, and (C) G10 relative to selection based on parental mean (PM).
Figure 6
Figure 6
Genetic and genic additive variances for different cross-selection indices in the TRUE scenario (PM: parental mean, UC: usefulness criterion, OCS-He*: optimal cross-selection, and UCPC-He*: UCPC-based optimal cross-selection) according to the generations. (A) Additive genic variance (σa2) measured on the whole progeny, (B) additive genetic variance (σA2) measured on the whole progeny, and (C) ratio of genetic over genic variance (σA2/σa2) reflecting the Bulmer effect.
Figure 7
Figure 7
Genetic diversity at QTLs for different cross-selection indices in the TRUE scenario (PM: parental mean, UC: usefulness criterion, OCS-He*: optimal cross-selection, and UCPC-He*: UCPC-based optimal cross-selection) according to the generations. (A) Genetic diversity at QTLs in the whole progeny (He), (B) number of QTLs where the favorable allele is fixed in the whole progeny, and (C) number of QTLs where the favorable allele is lost in the whole progeny.
Figure 8
Figure 8
Evolution of different variables for different cross-selection indices according to the generations in the GS scenario (PM, parental mean; UC, usefulness criterion; OCS-He*, optimal cross-selection; and UCPC-He*, UCPC-based optimal cross-selection for He* = 0.01) and in the PS scenario (PM, parental mean). (A) Genetic gain at whole progeny level (G), (B) genetic gain at commercial level (G10), and (C) G10 relatively to PM (GS), genetic gain is measured on true breeding values. (D) Genic variance at QTLs (σa2). (E) genetic variance of true breeding values (σA2) and (F) ratio of genic over genetic variance (σA2/σa2). (G) genetic diversity at QTLs and number of QTLs where the favorable allele was fixed (H) and lost (I).

References

    1. Akdemir D., Isidro-Sánchez J. (2016). Efficient breeding by genomic mating. Front. Genet. 7, 210. 10.3389/fgene.2016.00210 - DOI - PMC - PubMed
    1. Akdemir D., Beavis W., Fritsche-Neto R., Singh A. K., Isidro-Sánchez J. (2018). Multi-objective optimized genomic breeding strategies for sustainable food improvement. Heredity 122, 672. 10.1101/209080 - DOI - PMC - PubMed
    1. Allier A., Teyssèdre S., Lehermeier C., Claustres B., Maltese S., Moreau L., Charcosset A. (2019. a). Assessment of breeding programs sustainability: application of phenotypic and genomic indicators to a North European grain maize program. Theor. Appl. Genet. 132, 1321–1334. 10.1007/s00122-019-03280-w - DOI - PubMed
    1. Allier A., Moreau L., Charcosset A., Teyssèdre S., Lehermeier C. (2019. b). Usefulness criterion and post-selection parental contributions in multi-parental crosses: application to polygenic trait introgression. G3 Genes Genomes Genet. 9, 1469–1479. 10.1534/g3.119.400129 - DOI - PMC - PubMed
    1. Bernardo R., Moreau L., Charcosset A. (2006). Number and fitness of selected individuals in marker-assisted and phenotypic recurrent selection. Crop Sci. 46, 1972–1980. 10.2135/cropsci2006.01-0057 - DOI

LinkOut - more resources