. 2019 Oct 31:10:1078.
doi: 10.3389/fgene.2019.01078. eCollection 2019.

What Do Neighbors Tell About You: The Local Context of Cis-Regulatory Modules Complicates Prediction of Regulatory Variants

Affiliations

What Do Neighbors Tell About You: The Local Context of Cis-Regulatory Modules Complicates Prediction of Regulatory Variants

Dmitry D Penzar et al. Front Genet. .

Abstract

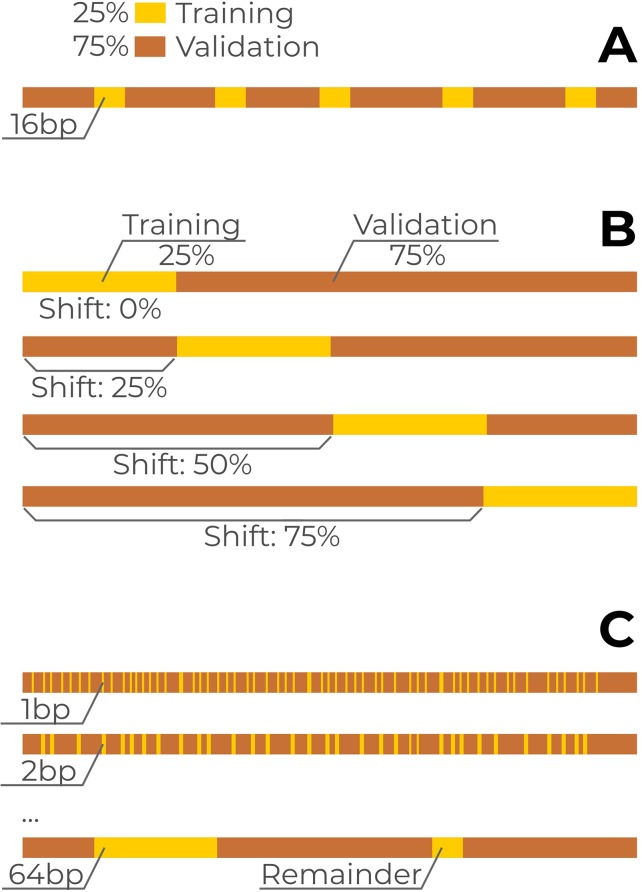
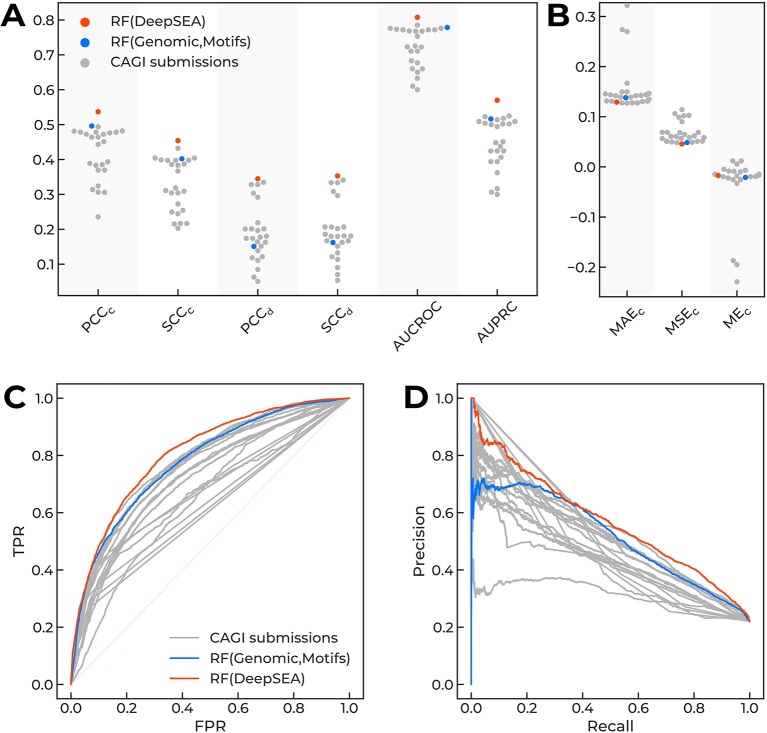
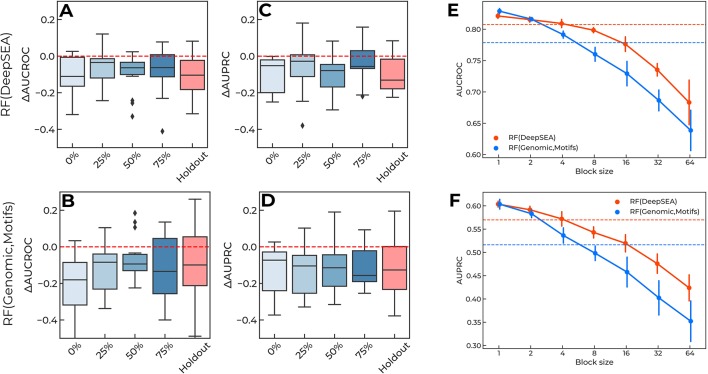
Many problems of modern genetics and functional genomics require the assessment of functional effects of sequence variants, including gene expression changes. Machine learning is considered to be a promising approach for solving this task, but its practical applications remain a challenge due to the insufficient volume and diversity of training data. A promising source of valuable data is a saturation mutagenesis massively parallel reporter assay, which quantitatively measures changes in transcription activity caused by sequence variants. Here, we explore the computational predictions of the effects of individual single-nucleotide variants on gene transcription measured in the massively parallel reporter assays, based on the data from the recent "Regulation Saturation" Critical Assessment of Genome Interpretation challenge. We show that the estimated prediction quality strongly depends on the structure of the training and validation data. Particularly, training on the sequence segments located next to the validation data results in the "information leakage" caused by the local context. This information leakage allows reproducing the prediction quality of the best CAGI challenge submissions with a fairly simple machine learning approach, and even obtaining notably better-than-random predictions using irrelevant genomic regions. Validation scenarios preventing such information leakage dramatically reduce the measured prediction quality. The performance at independent regulatory regions entirely excluded from the training set appears to be much lower than needed for practical applications, and even the performance estimation will become reliable only in the future with richer data from multiple reporters. The source code and data are available at https://bitbucket.org/autosomeru_cagi2018/cagi2018_regsat and https://genomeinterpretation.org/content/expression-variants.

Keywords: enhancers; machine learning; promoters; rSNP; regulatory variants; saturation mutagenesis massively parallel reporter assay.


Figures

Figure 1
Figure 1
Data separation into training and validation subsets. A single reporter is shown, the scheme was identical for all reporters. Yellow bars: training subset, brown bars: validation subset. (A) Original CAGI setup. For each reporter, the training subset of single-nucleotide variants (SNVs) (25% from total) consists of multiple 16bp blocks spanning over neighboring reporter coordinates. (B) Continuous blocks covering 25% of reporter length for each reporter with a varying shift from the reporter 5’ end. (C) Training data with varying block lengths from 1 to 64bps.
Figure 2
Figure 2
The performance of different models predicting regulatory single-nucleotide variant (SNVs) of the CAGI “Regulation Saturation” challenge. Orange dots, Random Forest classifier using DeepSEA features. Blue dots, Random Forest classifier using features based on genomic data and sequence motif analysis. Grey dots, CAGI challenge submissions. (A, B) Different performance measures for prediction of expression direction (d) and confidence scores (c): Pearson (PCCc and PCCd) and Spearman (SCCc and SCCd) correlation coefficients, area under curve for receiver operating characteristic (AUCROC), area under precision-recall curve (AUPRC), mean absolute error (MAEc), mean squared error (MSEc), and mean error (MEc). (C, D) Receiver operating characteristics and precision-recall curves.
Figure 3
Figure 3
Prediction performance drops as the data from target reporters are excluded from training. Training on the complete data improves prediction quality, but cannot compensate for the holdout of the data for single-nucleotide variants (SNVs) from the target reporter. Green dots, the baseline models trained in the CAGI setup. Grey dots, the CAGI submissions. Red dots, the models trained in the CAGI setup with the data from the target reporter held out. Violet dots, the performance for the TERT target reporter with the data from both TERT assays held out from training. Yellow dots, the models trained with the complete data from all reporters excluding the target reporter. Reporter names are given at the X-axes. (A, B) Area under precision-recall curve (AUPRC) and area under curve for receiver operating characteristic (AUCROC) for Random Forest with DeepSEA features (baseline and holdout models). (C, D) AUPRC and AUCROC for Random Forest with Genomic signal and sequence motif features (baseline and holdout models). (E, F) AUPRC and AUCROC for Random Forest with DeepSEA features (baseline, holdout, complete training models). (G, H) AUPRC and AUCROC for Random Forest with Genomic signal and sequence motif features (baseline, holdout, complete training models).
Figure 4
Figure 4
(A-D) Training data of a single continuous block per reporter degrade performance of the prediction regulatory single-nucleotide variants (SNVs). X-axis, locations of training data blocks relative to the 5' ends of the reporters. Y-axis, the difference in AUCROC and AUPRC values for each model versus the baseline. The holdout of SNVs from each reporter is shown for the reference. Boxplots aggregate data from all reporters. Random Forest using DeepSEA features: (A) AUCROC, (C) AUPRC. Random Forest using genomic data and sequence motif features: (B) AUCROC, (D) AUPRC. (EF) Shorter blocks in training data improve models performance due to information leakage. Orange lines: Random Forest classifier using DeepSEA features. Blue lines: Random Forest classifier using features based on genomic data and sequence motif analysis. Solid lines show the mean and standard deviation of 10 random samples with a fixed block length (X-axes). Dashed lines show the values reached in the original CAGI setup of the training data. (E) AUCROC values, (F) AUPRC values.

References

    1. Arnold C. D., Gerlach D., Stelzer C., Boryń Ł. M., Rath M., Stark A. (2013). Genome-wide quantitative enhancer activity maps identified by STARR-seq. Science 339, 1074–1077. 10.1126/science.1232542 - DOI - PubMed
    1. Boulesteix A.-L., Janitza S., Kruppa J., König I. R. (2012). Overview of random forest methodology and practical guidance with emphasis on computational biology and bioinformatics: Random forests in bioinformatics. WIREs Data Mining Knowl. Discovery 2 (6), 493–507. 10.1002/widm.1072 - DOI
    1. Canver M. C., Smith E. C., Sher F., Pinello L., Sanjana N. E., Shalem O., et al. (2015). BCL11A enhancer dissection by Cas9-mediated in situ saturating mutagenesis. Nature 527, 192–197. 10.1038/nature15521 - DOI - PMC - PubMed
    1. Cawley G. C., Talbot N. L. (2010). On over-fitting in model selection and subsequent selection bias in performance evaluation. J. Mach. Learn. Res. 11, 2079–2107.
    1. Deplancke B., Alpern D., Gardeux V., Adam R. C., Yang H., Rockowitz S., et al. (2016). The genetics of transcription factor DNA binding variation. Cell 166, 538–554. 10.1016/j.cell.2016.07.012 - DOI - PubMed

LinkOut - more resources