. 2019 Oct 31:10:1093.
doi: 10.3389/fgene.2019.01093. eCollection 2019.

Genotyping and Phylogenetic Position of Trichinella spiralis Isolates from Different Geographical Locations in China

Affiliations

Genotyping and Phylogenetic Position of Trichinella spiralis Isolates from Different Geographical Locations in China

Xi Zhang et al. Front Genet. .

Abstract

In China, the nematode Trichinella spiralis is the main aetiological agent of human trichinellosis. We performed multi-locus microsatellite typing of T. spiralis isolates to improve the current knowledge of the evolution and population diversity. First, seven polymorphic microsatellite loci were used to infer the genetic diversity of T. spiralis collected in 10 endemic regions. Then, a Bayesian model-based STRUCTURE analysis, a clustering based on the neighbor-joining method, and a principal coordinate analysis (PCA) were performed to identify the genetic structure. Finally, the phylogenetic position of Chinese isolates was explored based on six mitochondrial and nuclear genetic markers (cox1, cytb, 5S ISR, ESV, ITS1, and 18S rDNA) using the maximum likelihood and Bayesian methods. In addition, the divergence time was estimated with multiple genes using an uncorrelated log-normal relaxed molecular-clock model. A total of 16 alleles were detected in 2,310 individuals (1,650 muscle larvae and 660 adult worms) using seven loci. The STRUCTURE analysis indicated that the T. spiralis isolates could be organized and derived from the admixture of two ancestral clusters, which was also substantiated through the clustering analysis based on the allelic data. PCA separated most samples from Tiandong, Guangxi (GX-td), and Linzhi, Tibet (Tibet-lz), from the remaining isolates. However, both maximum likelihood and Bayesian inference supported the close relationship between Xiangfan, Hubei (HB-xf), and GX-td. The molecular dating analysis suggested that the Chinese isolates started to diverge during the Late Pleistocene (0.69 Mya). Generally, T. spiralis was observed to harbor low genetic variation, and further investigation with deeper sampling is needed to elucidate the population structure.

Keywords: China; Trichinella spiralis; genetic variance; microsatellite; population.


Figures

Figure 1
Figure 1
Map of collection localities and host information for Trichinella spiralis isolates. Geographic regions in China are designated as follows: Tongjiang, Heilongjiang (HLJ-tj), Harbin, Heilongjiang (HLJ-hb), Tianjin (TJ), Xian, Shaanxi (SX-xa), Anyang, Henan (HN-ay), Nanyang, Henan (HN-ny), Xiangfan, Hubei (HB-xf), Tiandong, Guangxi (GX-td), Dali, Yunnan (YN-dl), and Linzhi, Tibet (Tibet-lz).
Figure 2
Figure 2
Estimated genetic structure of Trichinella spiralis in China as inferred by the STRUCTURE software on the basis of the data on seven microsatellite markers obtained for 770 individuals from 10 geographical locations. (A) Plot of the mean posterior probability (LnP(D)) values per cluster (K) based on 20 replicates per K, generated by the STRUCTURE software, and (B) Delta-K analysis of LnP(K). (C) STRUCTURE plots grouped by the Q-matrix (estimated membership coefficient for each sample) at K = 2. Each strain is represented by a vertical line, which is partitioned into the coloured segments that represent the parasite estimated membership fractions in K. The same colour indicates that the isolates belong to the same group. Different colours for the same isolate indicate the percentage of the genotype shared with each group. For the isolate code, see Figure 1.
Figure 3
Figure 3
The unrooted neighbor-joining tree based on the seven microsatellite data. Within the parenthesis, “A” represents adult worm and “L” represents larva; numbers indicate the code of the infected mouse from which the parasite was collected. For the isolate code, see Figure 1.
Figure 4
Figure 4
(A) Principal coordinate analysis (PCA) describing the relationships of the 10 Trichinella spiralis isolates studied based on the FST values calculated using seven microsatellite markers. (B) PCA describing the relationships of 770 single T. spiralis (each point represents a single worm) based on the covariance values calculated using seven microsatellite markers. For the isolate code, see Figure 1.
Figure 5
Figure 5
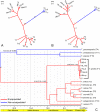
(A) Maximum likelihood phylogenetic tree of Trichinella spiralis from China. Only bootstrap values above 60 are shown. (B) Bayesian phylogenetic tree of T. spiralis from China. Only posterior probabilities values above 0.6 are shown. (C) BEAST chronogram of the Trichinella species. Numbers in the nodes represent the Bayesian posterior probabilities; only the posterior probabilities above 0.6 are shown. Numbers above the branches indicate the estimated ages for the corresponding clade with values of the 95% highest posterior density interval in the parenthesis.

References

    1. Aggarwal R. K., Hendre P. S., Varshney R. K., Bhat P. R., Krishnakumar V., Singh L. (2007). Identification, characterization and utilization of EST-derived genic microsatellite markers for genome analyses of coffee and related species. Theor. Appl. Genet. 114, 359–372. 10.1007/s00122-006-0440-x - DOI - PubMed
    1. Cui J., Wang Z. Q., Xu B. L. (2011). The epidemiology of human trichinellosis in China during 2004–2009. Acta Trop. 118, 1–5. 10.1016/j.actatropica.2011.02.005 - DOI - PubMed
    1. Darriba D., Taboada G. L., Doallo R., Posada D. (2012). jModelTest 2: more models, new heuristics and parallel computing. Nat. Methods 9, 772. 10.1038/nmeth.2109 - DOI - PMC - PubMed
    1. Drummond A. J., Suchard M. A., Xie D., Rambaut A. (2012). Bayesian phylogenetics with BEAUti and the BEAST 1.7. Mol. Biol. Evol. 29, 1969–1973. 10.1093/molbev/mss075 - DOI - PMC - PubMed
    1. Earl D. A., von Holdt B. M. (2012). STRUCTURE HARVESTER: a website and program for visualizing STRUCTURE output and implementing the Evanno method. Conserv. Genet. Resour. 4, 359–361. 10.1007/s12686-011-9548-7 - DOI

LinkOut - more resources