. 2019 Nov 11:12:266.
doi: 10.1186/s13068-019-1608-3. eCollection 2019.

Re-routing photosynthetic energy for continuous hydrogen production in vivo

Affiliations

Re-routing photosynthetic energy for continuous hydrogen production in vivo

Oren Ben-Zvi et al. Biotechnol Biofuels. .

Abstract

Background: Hydrogen is considered a promising energy vector that can be produced from sustainable resources such as sunlight and water. In green algae, such as Chlamydomonas reinhardtii, photoproduction of hydrogen is catalyzed by the enzyme [FeFe]-hydrogenase (HydA). Although highly efficient, this process is transitory and thought to serve as a release valve for excess reducing power. Up to date, prolonged production of hydrogen was achieved by the deprivation of either nutrients or light, thus, hindering the full potential of photosynthetic hydrogen production. Previously we showed that the enzyme superoxide dismutase (SOD) can enhance HydA activity in vitro, specifically when tied together to a fusion protein.

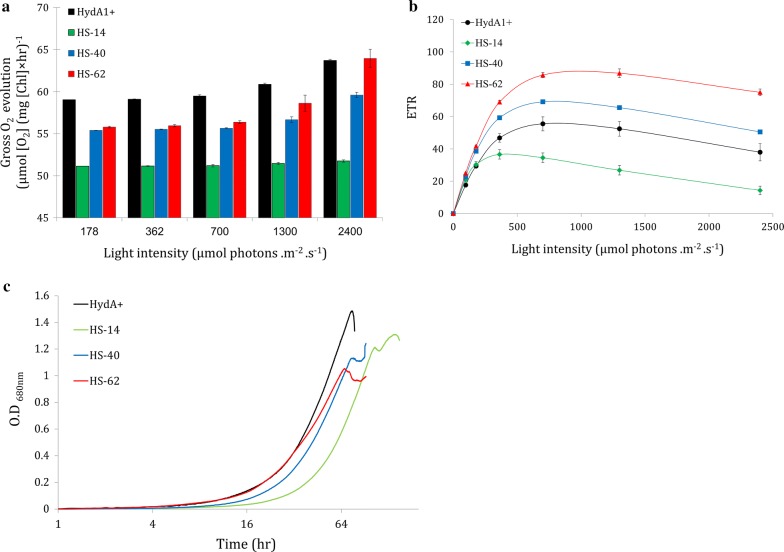
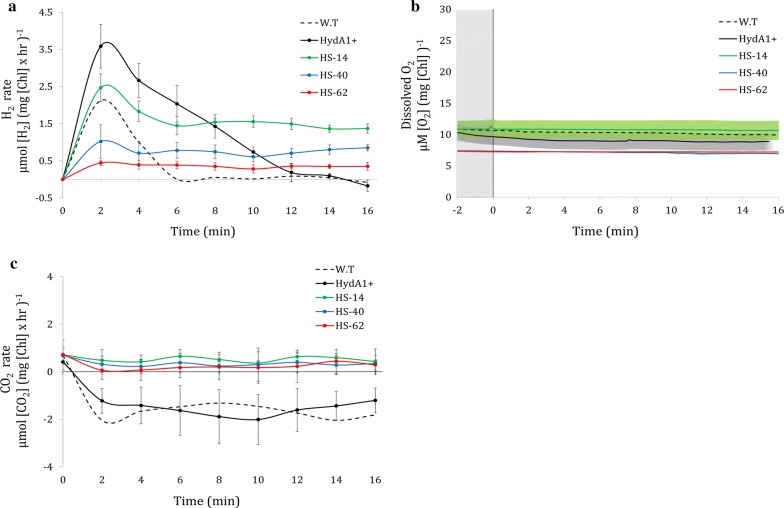
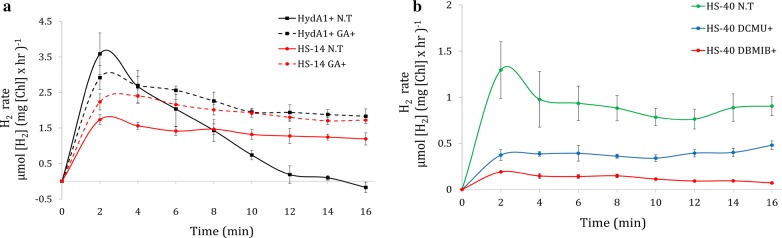
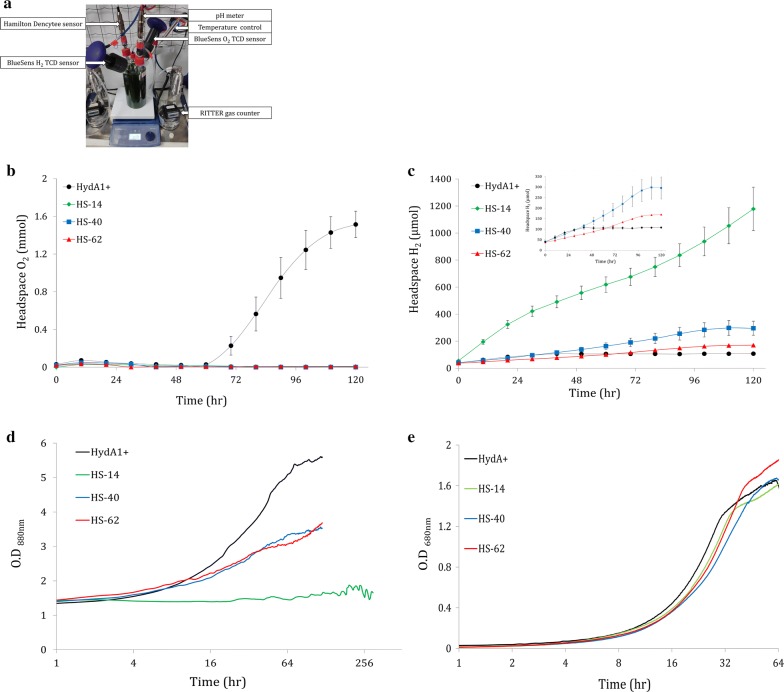
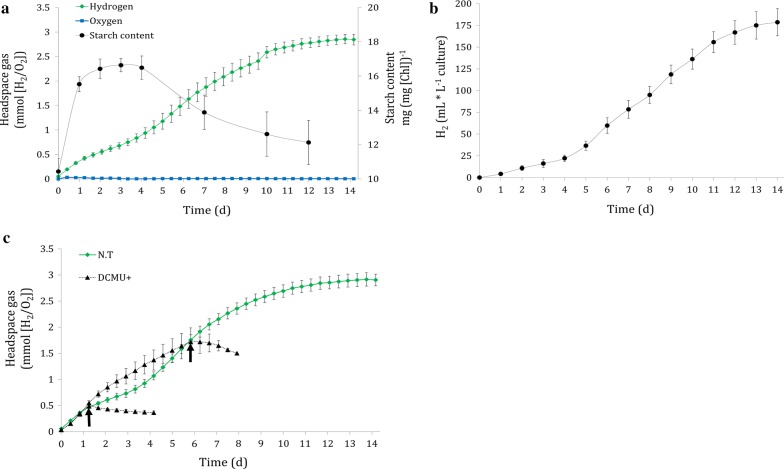
Results: In this work, we explored the in vivo hydrogen production phenotype of HydA-SOD fusion. We found a sustained hydrogen production, which is dependent on linear electron flow, although other pathways feed it as well. In addition, other characteristics such as slower growth and oxygen production were also observed in Hyd-SOD-expressing algae.

Conclusions: The Hyd-SOD fusion manages to outcompete the Calvin-Benson cycle, allowing sustained hydrogen production for up to 14 days in non-limiting conditions.

Keywords: Chlamydomonas reinhardtii; Fusion protein; Hydrogen production; Hydrogenase; Superoxide dismutase.


Conflict of interest statement

Competing interestsThe authors declare that they have no competing interests.

Figures

Fig. 1
Fig. 1
Construction and screening of HS mutants. a Plasmid vector map of pchlamy1 Hyd–SOD. b R. capsulatus screen (Rhodo assay) for HydA–SOD-expressing clones. Algae chlorophyll fluorescence is green whereas dark halation represents GFP produced by R. capsulatus due to H2 presence. The WT strain CC-124 (High), Fd–HydA-expressing clones (Pos.) and DM (Neg.) clones were used as positive, transformant reference and negative controls, respectively. Numbers represent HS clones. c PCR analysis of genomic DNA from DM, HS-14, HS-40 and HS-62 cells. Primers for pChlmy1 rbcS promotor (forward) and the 3′UTR (reverse) were used and the expected amplified chain length is 2400 bp. d Immunoblot analysis for the detection of Hyd–SOD expression. Soluble fraction [S] and whole cell protein extraction [T] from DM and HS-14 were loaded on 4–12% Bis–Tris PAGE (Life Technologies) and probed with rabbit polyclonal HydA1/2 antibodies and ponceau red
Fig. 2
Fig. 2
Photosynthetic parameters of HS mutants. a Gross O2 evolution in response to increased irradiance of HydA1+, HS-14, HS-40 and HS-62 (black, green, blue and red, respectively). Dissolved O2 evolution was measured in a 5-mL vial fitted with Pyroscience FireSting O2 OXROB3 probe, and OXVIAL4 respiration vial. Error bars are in SE (n = 3). b Chlorophyll fluorescence measurement. ETR in response to increased irradiance of HydA1+, HS-14, HS-40 and HS-62 (black, green, blue and red, respectively) was measured using Walz Dual-PAM-100. Error bars are in SE (n = 3). c Autotrophic growth of HydA1+ and 3 HS clones: HS-14, HS-40 and HS-62 (black, green, blue and red, respectively) under aerobic conditions, measured in A680nm
Fig. 3
Fig. 3
Short-term H2 photoproduction under anaerobiosis. H2, O2 and CO2 exchange was measured using a membrane inlet mass spectrometer (MIMS) in D66 wild-type (W.T, n = 3) HydA1+ (n = 7) and 3 HS clones: HS-14 (n = 7), HS-40 (n = 7) and HS-62 (n = 3) (dash, black, green, blue and red, respectively). 180 µmol photons m−2 s−1 light was switched on at t = 0. SE is represented by error bars. a H2 production rate. b Dissolved O2 concentration. SE is represented by painted area in the corresponding sample color. c CO2 exchange rate
Fig. 4
Fig. 4
Inhibitors’ effect on H2 production. H2 production was measured using a membrane inlet mass spectrometer (MIMS). 180 µmol photons m−2 s−1 light was switched on at t = 0, whereas inhibitors were added 10 min prior. SE is represented by error bars. a CBB cycle inhibitor effect on H2 photoproduction rate. H2 evolution was measured in non-treated cells (NT, solid line) and GA-treated cells (GA+, dash line). HydA1+ (black, n = 4) and HS-14 (red, n = 4) were tested. b The effect of photosynthetic apparatus inhibitors on HS clone’s H2 photoproduction rate. H2 evolution was measured in non-treated cells (NT, n = 5), DCMU-treated cells (DCMU+, n = 4) and DBMIB-treated cells (DBMIB+, n = 3) (green, blue and red, respectively)
Fig. 5
Fig. 5
Long-term H2 photoproduction in 1-L BlueSens photobioreactors. a Picture of the BlueSens 1-L photobioreactor measuring system. The bioreactors were continuously illuminated at 180 µmol photons m−2 s−1. Cultures of HydA1+ (n = 8) and 3 HS clones: HS-14 (n = 5), HS-40 (n = 3) and HS-62 (n = 3) (black, green, blue and red, respectively) were measured. TCD sensors (BlueSens) were used to monitor. b O2 accumulation and c H2 accumulation in the bioreactor headspace. Error bars are in SE. The inset in (c) is a zoomed window of the blue, red and black traces. d Corresponding cell density of the different clones under the bioreactors anoxic mixotrophic conditions, measured in A880nm by Hamilton Dencytee sensor. e Cell density of the different clones under aerobic mixotrophic conditions, measured in A680nm. Cultivation was performed in Multi-Cultivator MC 1000-OD under constant illumination of 180 µmol photons m−2 s−1 (n = 4)
Fig. 6
Fig. 6
Phenotype of clone HS-14. a HS-14 starch accumulation during H2 production period. The bioreactors were continually illuminated at 180 µmol photons m−2 s−1. 2 mL samples were drawn for starch determination (black) while TCD sensors monitored H2 and O2 evolution (green and blue, respectively). b Gas output during starch analysis. Gas flow was measured using Ritter’s milligascounter attached to the culture headspace. Error bars are in SE (n = 4). c Addition of DCMU to HS-14 during H2 production phases. The bioreactors were continuously illuminated at 180 µmol photons m−2 s−1. Dashed black lines represent DCMU-added cultures (DCMU+), whereas the arrows indicate the DCMU addition time point. Green line represents non-treated culture (NT). Error bars are in SE (n = 4)

References

    1. Jain IP. Hydrogen the fuel for 21st century. Int J Hydrogen Energy. 2009;34:7368–7378. doi: 10.1016/j.ijhydene.2009.05.093. - DOI
    1. Jacobson MZ. Cleaning the air and improving health with hydrogen fuel-cell vehicles. Science. 2014;1901:1901–1905. - PubMed
    1. Meher Kotay S, Das D. Biohydrogen as a renewable energy resource-prospects and potentials. Int J Hydrogen Energy. 2008;33:258–263. doi: 10.1016/j.ijhydene.2007.07.031. - DOI
    1. Akkerman I, Janssen M, Rocha JMS, Reith JH, Wijffels RH. Photobiological hydrogen production: photochemical efficiency and bioreactor design. Int J Hydrogen Energy. 2002;27:1195–1208. doi: 10.1016/S0360-3199(02)00071-X. - DOI
    1. Melis A. Green alga hydrogen production: Progress, challenges and prospects. Int J Hydrogen Energy. 2002;27:1217–1228. doi: 10.1016/S0360-3199(02)00110-6. - DOI

LinkOut - more resources