. 2019 Nov 18;14(11):e0224757.
doi: 10.1371/journal.pone.0224757. eCollection 2019.

Reproducibility, stability, and accuracy of microbial profiles by fecal sample collection method in three distinct populations

Affiliations

Reproducibility, stability, and accuracy of microbial profiles by fecal sample collection method in three distinct populations

Doratha A Byrd et al. PLoS One. .

Abstract

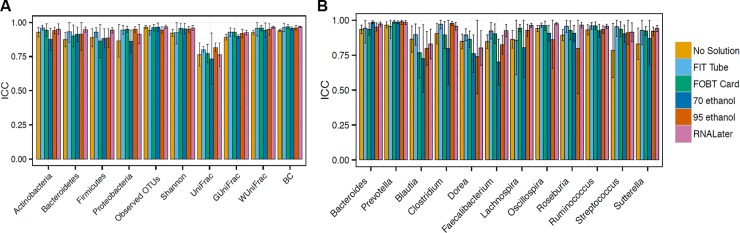
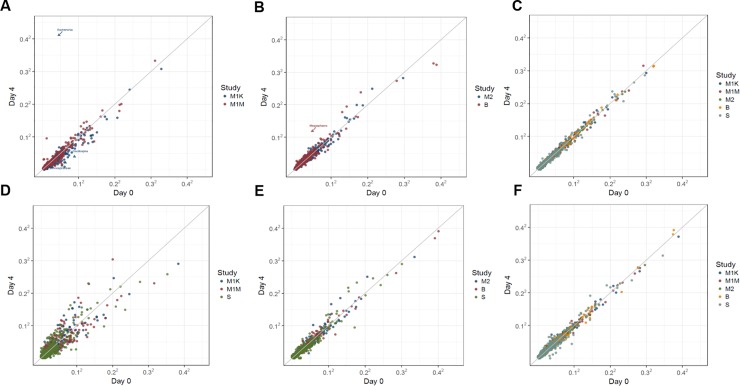
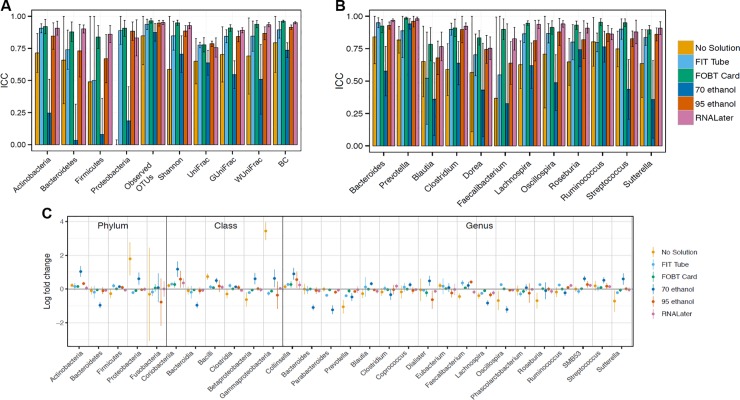
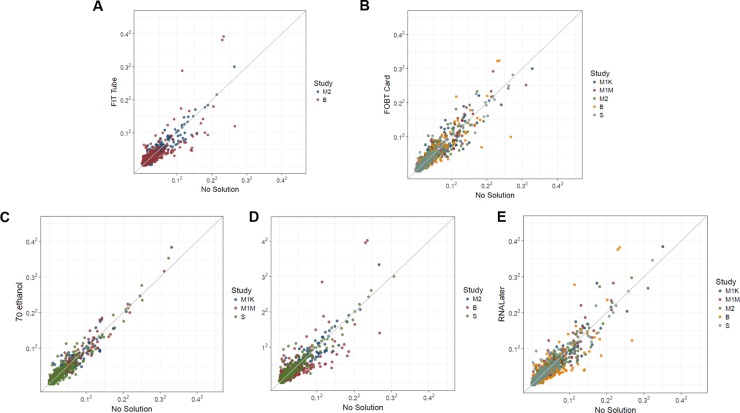
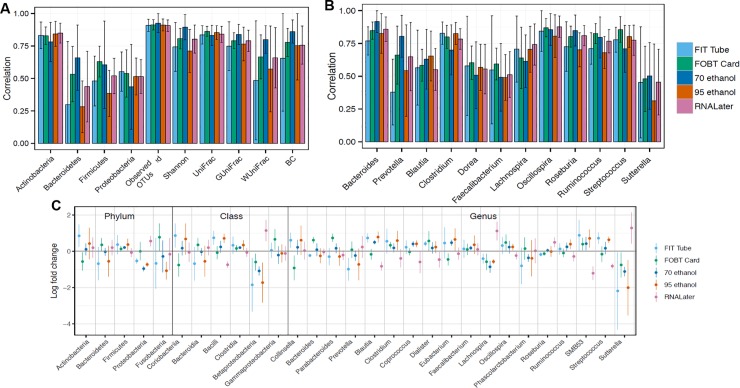
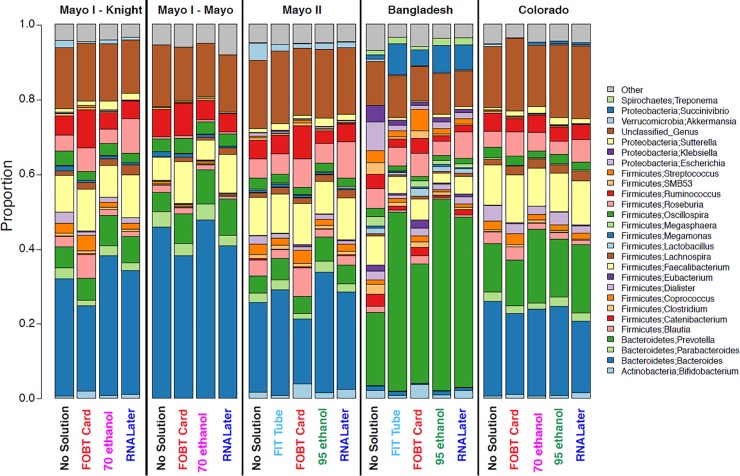
The gut microbiome likely plays a role in the etiology of multiple health conditions, especially those affecting the gastrointestinal tract. Little consensus exists as to the best, standard methods to collect fecal samples for future microbiome analysis. We evaluated three distinct populations (N = 132 participants) using 16S rRNA gene amplicon sequencing data to investigate the reproducibility, stability, and accuracy of microbial profiles in fecal samples collected and stored via fecal occult blood test (FOBT) or Flinders Technology Associates (FTA) cards, fecal immunochemical tests (FIT) tubes, 70% and 95% ethanol, RNAlater, or with no solution. For each collection method, based on relative abundance of select phyla and genera, two alpha diversity metrics, and four beta diversity metrics, we calculated intraclass correlation coefficients (ICCs) to estimate reproducibility and stability, and Spearman correlation coefficients (SCCs) to estimate accuracy of the fecal microbial profile. Comparing duplicate samples, reproducibility ICCs for all collection methods were excellent (ICCs ≥75%). After 4-7 days at ambient temperature, ICCs for microbial profile stability were excellent (≥75%) for most collection methods, except those collected via no-solution and 70% ethanol. SCCs comparing each collection method to immediately-frozen no-solution samples ranged from fair to excellent for most methods; however, accuracy of genus-level relative abundances differed by collection method. Our findings, taken together with previous studies and feasibility considerations, indicated that FOBT/FTA cards, FIT tubes, 95% ethanol, and RNAlater are excellent choices for fecal sample collection methods in future microbiome studies. Furthermore, establishing standard collection methods across studies is highly desirable.


Conflict of interest statement

The authors have declared that no competing interests exist.

Figures

Fig 1
Fig 1. Meta-analyzed ICCs based on a random effects model for technical reproducibility comparing duplicate samples frozen day-0 from fecal samples collected using six different methods among 132 participants in five studies (Mayo 1-Knight lab, Mayo 1-Mayo lab, Mayo 2, Bangladesh, and Colorado).
ICCs are based on ten microbial composition metrics (panel A; square root transformed abundance of four phyla, two alpha diversity metrics [number of observed OTUs and Shannon index] and four beta diversity metrics [unweighted UniFrac, generalized UniFrac, weighted UniFrac, and Bray-Curtis distance]), and square root transformed select bacterial genera (panel B) with prevalence in the population >80% and a mean relative abundance >0.2%. Error bars represent 95% CIs. Abbreviations: BC, Bray-Curtis distance; FIT, fecal immunochemical test tubes; FOBT, fecal occult blood test cards; FTA, Flinders Technology Associates cards; GUniFrac, generalized UniFrac distance; ICC, intraclass correlation coefficient; UniFrac, unweighted UniFrac distance; WUnifrac, weighted UniFrac distance.
Fig 2
Fig 2
Comparison of square root transformed mean OTU abundance between day-0 and day-4/7 of freezing for fecal samples from 132 participants in five studies (Mayo 1-Knight lab, Mayo 1-Mayo lab, Mayo 2, Bangladesh, and Colorado), collected using six different methods (A) no-solution, (B) FIT tubes, (C) FOBT cards, (D) 70% ethanol, (E) 95% ethanol, and (F) RNAlater. Abbreviations: B, Bangladesh; FIT, fecal immunochemical test tubes; FOBT, fecal occult blood test cards; FTA, Flinders Technology Associates cards; M1K, Mayo 1, Knight Laboratory; M1M, Mayo 1, Mayo Laboratory; M2, Mayo 2; OTU, operational taxonomic unit; S, Colorado Study.
Fig 3
Fig 3. Meta-analyzed ICCs and log-fold changes based on random effects models for microbiome stability comparing fecal samples frozen on day-4/7 to those frozen at day-0 for six fecal sample collection methods among 132 participants in five studies (Mayo 1-Knight lab, Mayo 1-Mayo lab, Mayo 2, Bangladesh, and Colorado).
ICCs are based on ten microbial composition metrics (panel A; square root transformed abundance of four phyla, two alpha diversity metrics [number of observed OTUs and Shannon index] and four beta diversity metrics [unweighted UniFrac, generalized UniFrac, weighted UniFrac, and Bray-Curtis distance]), and select square root transformed bacterial genera (panel B) with prevalence in the population >80% and a mean relative abundance >0.2%. Log-fold changes in relative abundance from day-0 (panel C) are based on select taxa with prevalence > 50% and a mean read count > 10. All error bars represent 95% CIs. Abbreviations: BC, Bray-Curtis distance; FIT, fecal immunochemical tests tubes; FOBT, fecal occult blood test cards; FTA, Flinders Technology Associates cards; GUniFrac, generalized UniFrac distance; ICC, intraclass correlation coefficient; UniFrac, unweighted UniFrac distance; WUnifrac, weighted UniFrac distance.
Fig 4
Fig 4
Comparison of mean OTU abundance for each fecal sample collection method frozen on day-0 compared to no-solution samples frozen on day-0 (the gold standard) for fecal samples from 132 participants in five studies (Mayo 1-Knight lab, Mayo 1-Mayo lab, Mayo 2, Bangladesh, and Colorado), collected using five different methods (A) FIT tubes, (B) FOBT cards, (C) 70% ethanol, (D) 95% ethanol, and (E) RNAlater. Abbreviations: B, Bangladesh; FIT, fecal immunochemical tests; FOBT, fecal occult blood test cards; FTA, Flinders Technology Associates cards; M1K, Mayo 1 Knight Laboratory; M1M, Mayo 1, Mayo Laboratory; M2, Mayo 2; OTU, operational taxonomic unit; S, Colorado Study.
Fig 5
Fig 5. Meta-analyzed SCCs and log-fold changes based on random effects model for accuracy of each collection method compared to no-solution samples frozen on day-0 (the gold standard) among 132 participants in five studies (Mayo 1-Knight lab, Mayo 1-Mayo lab, Mayo 2, Bangladesh, and Colorado) with fecal samples collected using six different methods.
SCCs are based on ten microbial composition metrics (panel A; square root transformed abundance of four phyla, two alpha diversity metrics [number of observed OTUs and Shannon index] and four beta diversity metrics [unweighted UniFrac, generalized UniFrac, weighted UniFrac, and Bray-Curtis distance]), and square root transformed select bacterial genera (panel B) with prevalence in the population >80% and a mean relative abundance >0.2%. Log-fold changes in relative abundance from day-0 (panel C) are based on select taxa with prevalence > 50% and a mean read count > 10. All error bars represent 95% CIs. Abbreviations: BC, Bray-Curtis distance; FIT, fecal immunochemical test tubes; FOBT, fecal occult blood test cards; FTA, Flinders Technology Associates cards; GUniFrac, generalized UniFrac distance; SCC, Spearman correlation coefficient; UniFrac, unweighted UniFrac distance; WUnifrac distance, weighted UniFrac distance.
Fig 6
Fig 6. Relative abundance of bacterial genera in fecal samples frozen on day-0, collected from 132 participants in five studies (Mayo 1-Knight lab, Mayo 1-Mayo lab, Mayo 2, Bangladesh, and Colorado).
OTU counts were merged across samples by study population and collection method, and relative abundance was calculated for the merged samples. OTUs that could not be assigned to a specific genus were combined into “Unclassified_Genus”. The ‘Other’ group comprised all genera with mean abundance less than 0.5%. Abbreviations: FIT, fecal immunochemical test tubes; FOBT, fecal occult blood test cards; FTA, Flinders Technology Associates cards; OTU, operational taxonomic unit.

References

    1. Wang X, Yang Y, Huycke MM. Microbiome-driven carcinogenesis in colorectal cancer: Models and mechanisms. Free Radic Biol Med. 2017;105:3–15. 10.1016/j.freeradbiomed.2016.10.504 - DOI - PubMed
    1. Kostic AD, Xavier RJ, Gevers D. The microbiome in inflammatory bowel disease: current status and the future ahead. Gastroenterology. 2014;146(6):1489–99. 10.1053/j.gastro.2014.02.009 - DOI - PMC - PubMed
    1. Qin J, Li Y, Cai Z, Li S, Zhu J, Zhang F, et al. A metagenome-wide association study of gut microbiota in type 2 diabetes. Nature. 2012;490(7418):55–60. 10.1038/nature11450 - DOI - PubMed
    1. Turnbaugh PJ, Ley RE, Mahowald MA, Magrini V, Mardis ER, Gordon JI. An obesity-associated gut microbiome with increased capacity for energy harvest. Nature. 2006;444(7122):1027–31. 10.1038/nature05414 - DOI - PubMed
    1. Choo JM, Leong LE, Rogers GB. Sample storage conditions significantly influence faecal microbiome profiles. Scientific Reports. 2015;5:16350 10.1038/srep16350 - DOI - PMC - PubMed

Publication types

MeSH terms