. 2019 Nov 26;3(22):3562-3574.
doi: 10.1182/bloodadvances.2019031609.

Activated neutrophils exert myeloid-derived suppressor cell activity damaging T cells beyond repair

Affiliations

Activated neutrophils exert myeloid-derived suppressor cell activity damaging T cells beyond repair

Cathelijn E M Aarts et al. Blood Adv. .

Abstract

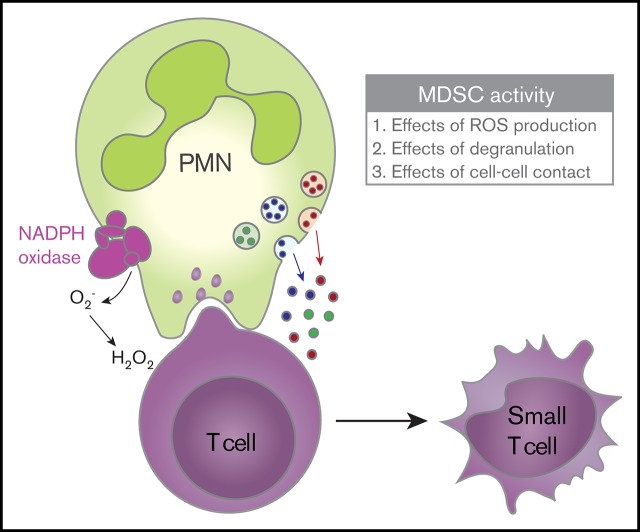
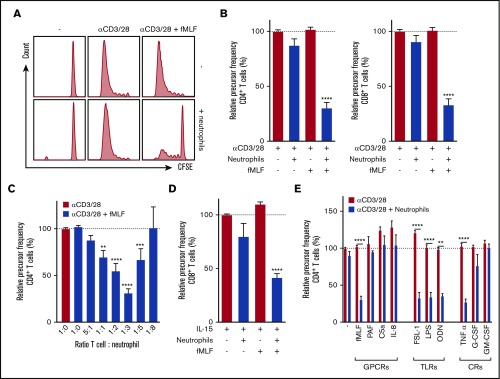
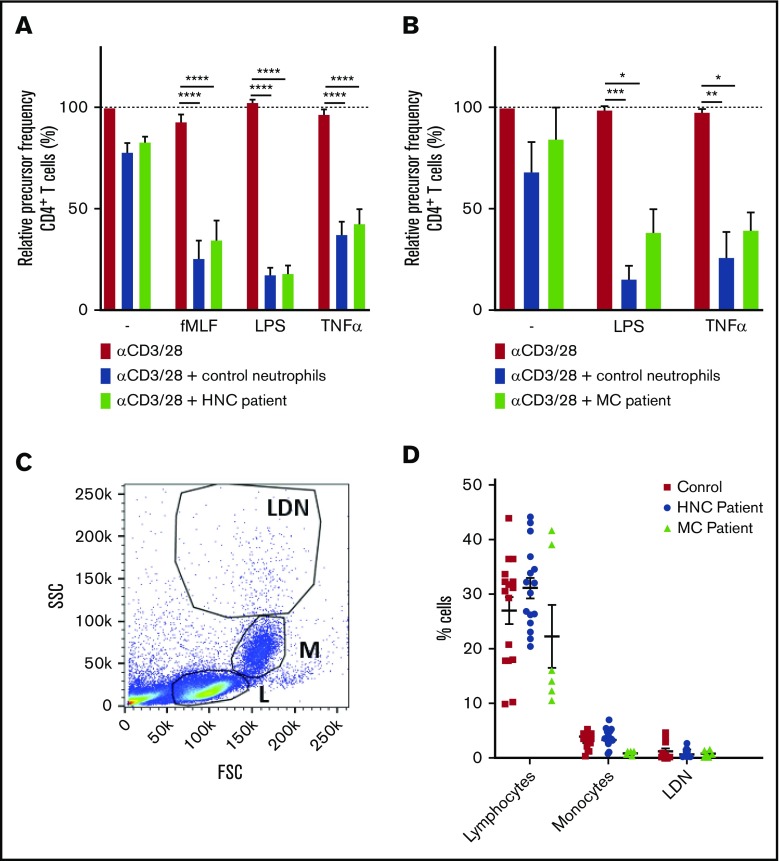
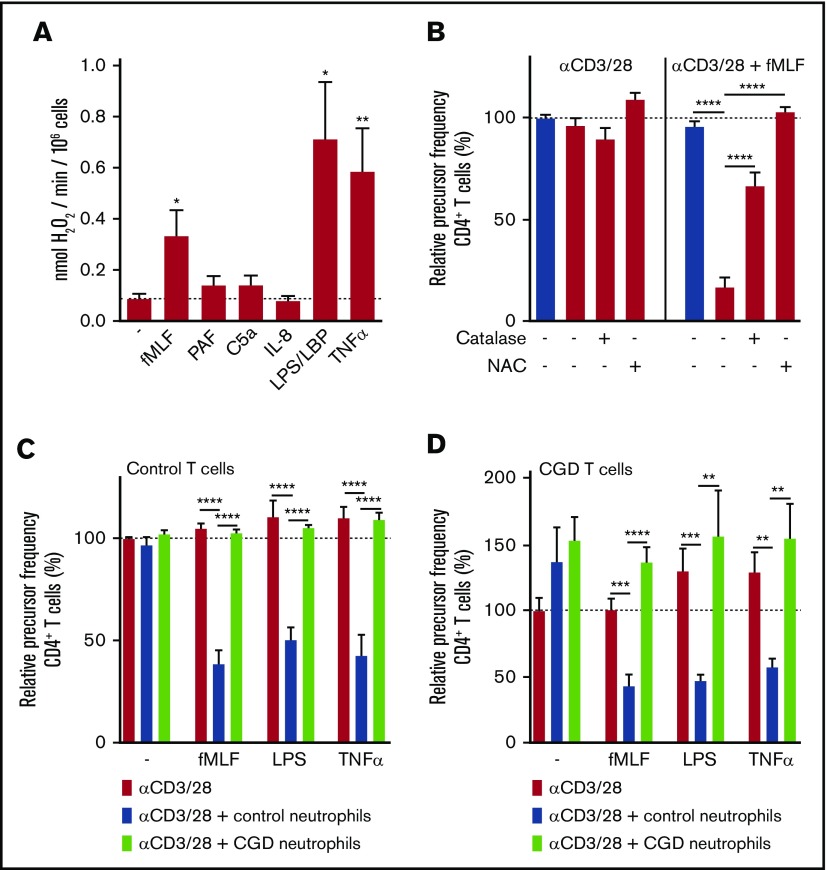
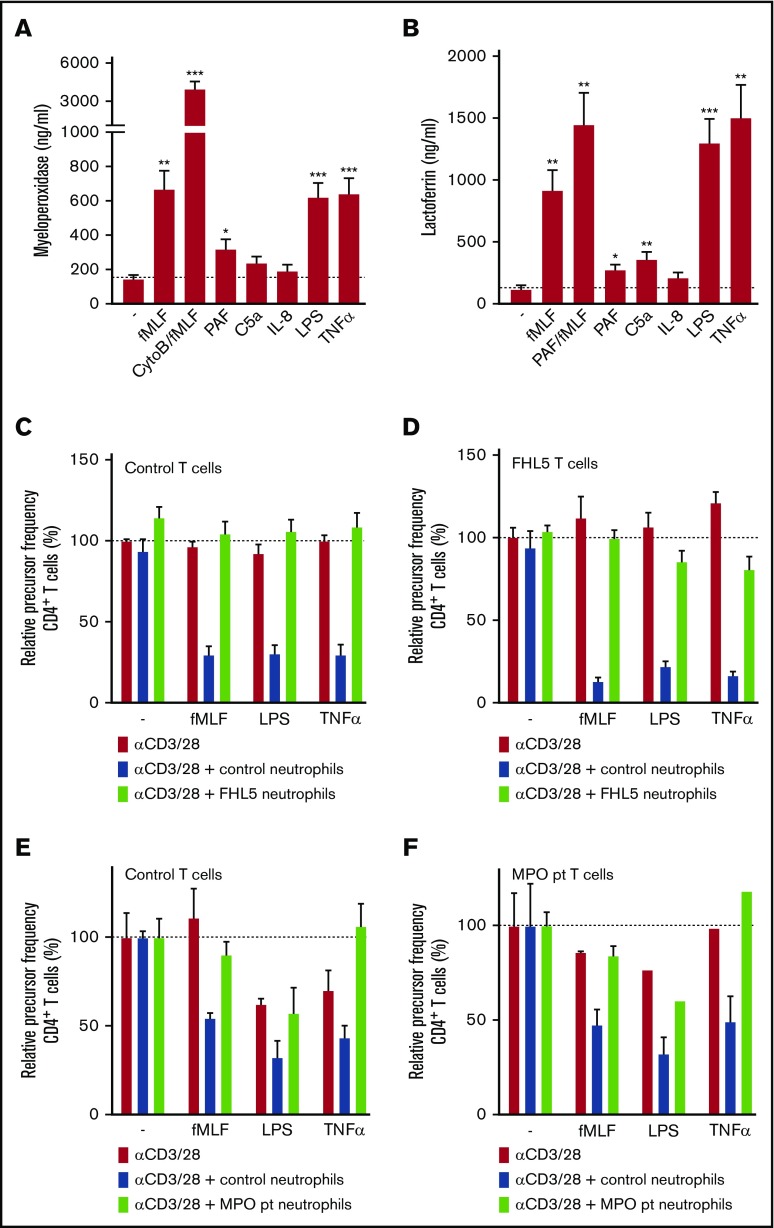
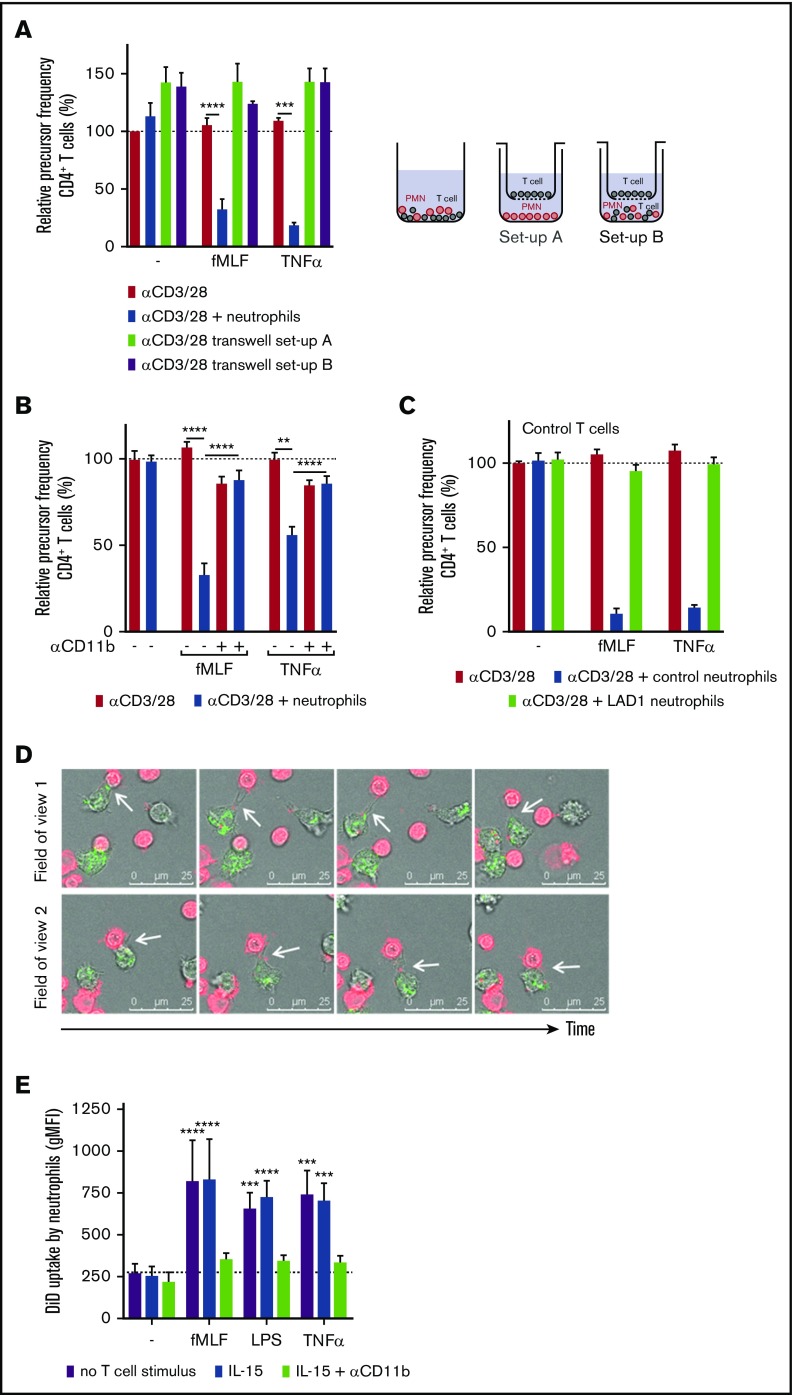
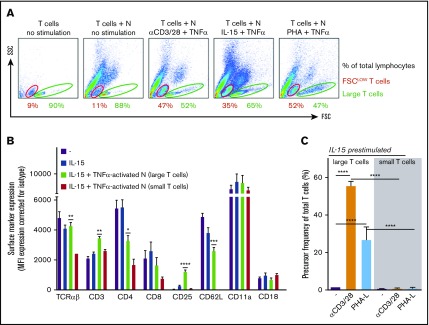
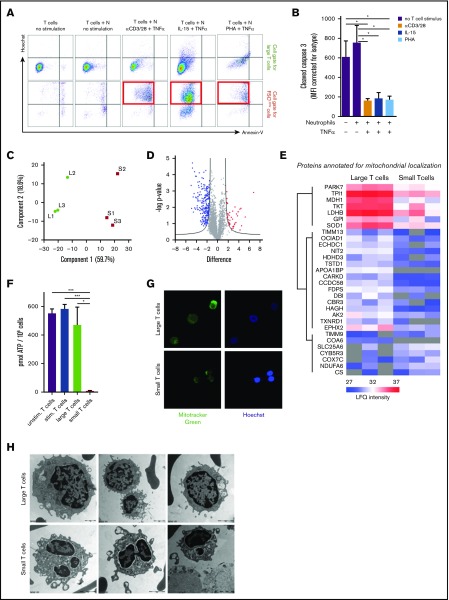
Myeloid-derived suppressor cells (MDSCs) have the capacity to suppress T-cell-mediated immune responses and impact the clinical outcome of cancer, infections, and transplantation settings. Although MDSCs were initially described as bone marrow-derived immature myeloid cells (either monocytic or granulocytic MDSCs), mature neutrophils have been shown to exert MDSC activity toward T cells in ways that remain unclear. In this study, we demonstrated that human neutrophils from both healthy donors and cancer patients do not exert MDSC activity unless they are activated. By using neutrophils with genetically well-defined defects, we found that reactive oxygen species (ROS) and granule-derived constituents are required for MDSC activity after direct CD11b-dependent interactions between neutrophils and T cells. In addition to these cellular interactions, neutrophils are engaged in the uptake of pieces of T-cell membrane, a process called trogocytosis. Together, these interactions led to changes in T-cell morphology, mitochondrial dysfunction, and adenosine triphosphate depletion, as indicated by electron microscopy, mass spectrometry, and metabolic parameters. Our studies characterize the different steps by which activated mature neutrophils induce functional T-cell nonresponsiveness and irreparable cell damage.


Conflict of interest statement

Conflict-of-interest disclosure: The authors declare no competing financial interests.

Figures

None
Graphical abstract
Figure 1.
Figure 1.
Activated neutrophils suppress T-cell proliferation. Purified T cells (either CD4+ or CD8+) were cultured in the presence or absence of anti-CD3 antibody or anti-CD28 antibody with unstimulated or fMLF-activated neutrophils (unless otherwise indicated). Cells were harvested after 5 to 6 days and analyzed by flow cytometry for CFSE dilution. (A) Representative fluorescence-activated cell sorting (FACS) plots of CFSE dilution of CD4+ T cells. (B) Quantification of CD4+ (left) and CD8+ (right) T-cell proliferation (n = 17). (C) Titration of the cell ratio with 4000 (5:1 ratio), 20 000 (1:1), 40 000 (1:2), 60 000 (1:3), 100 000 (1:5), or 160 000 (1:8) neutrophils per well of a 96-well plate (n = 3-17). (D) Purified T cells were cultured in the presence or absence of IL-15 with unstimulated or fMLF-activated neutrophils (n = 5). (E) Purified T cells were cultured with anti-CD3 and anti-CD28 antibodies (red bars), and in the presence of neutrophils (blue bars) and/or indicated stimuli. Three to 19 donors were tested in duplicate per stimulus. Error bars indicate standard error of the mean (SEM); ****P < .0001; ***P < .001; **P < .01. CR, cytokine receptor; GPCR, G-protein–coupled receptor; TLR, Toll-like receptor.
Figure 2.
Figure 2.
Neutrophils from patients with HNC do not show spontaneous suppression of T-cell activation. (A-B) Purified T cells from control donors were cultured with anti-CD3 and anti-CD28 antibodies (red bars) and in the presence of neutrophils from control donors (blue bars) or patients with HNC (A: green bars, 8 donors tested in duplicate) or patients with MC (B: green bars, 3 donors tested in duplicate), and/or indicated stimuli. Cells were harvested after 5 to 6 days and analyzed by flow cytometry for CFSE dilution among CD4+ T cells (8 donors tested in duplicate). (C-D) PBMCs from healthy controls (red square), HNC patients (blue circle, 8 patients tested in duplicate), or MC patients (green triangle, 3 patients tested in duplicate) were analyzed by flow cytometry and divided into 3 separate cell populations: lymphocytes (L), monocytes (M), and low-density neutrophils (LDNs). Shown is a representative plot (C) and the percentage of cells of each indicated cell population (D). Error bars indicate SEM. *P < .05, **P < .01, ***P < .001, ****P < .0001.
Figure 3.
Figure 3.
Suppressive activity of neutrophils requires ROS production. (A) Neutrophils were stimulated with the indicated stimuli and production of H2O2 was determined by measuring Amplex Red conversion into fluorescent Resorufin (n = 5). (B-D) Purified T cells from control donors (B-C) or CGD patients (D) were cultured with anti-CD3 and anti-CD28 antibodies (red bars) in the presence of neutrophils from control donors (blue bars) or CGD patients (green bars), and/or with indicated stimuli and antioxidants. Cells were harvested after 4 to 6 days and analyzed by flow cytometry for CFSE dilution among CD4+ T cells (n = 3 to 5 donors tested in duplicate). Error bars indicate SEM. ****P < .0001; ***P < .001; **P < .01; *P < .05. LBP, lipopolysaccharide binding protein.
Figure 4.
Figure 4.
Suppressive activity of neutrophils requires degranulation. (A-B) Neutrophils were stimulated with the indicated stimuli for 4 hours at 37°C after which supernatants were harvested and analyzed for the presence of myeloperoxidase (from primary granules) (A) and lactoferrin (from secondary granules) (B) by enzyme-linked immunosorbent assay (n = 7). (C-F) Purified T cells from control donors (C,E; n = 2), FHL-5 (D; n = 2), or MPO-deficient (F; n = 1) patients were cultured with anti-CD3 and anti-CD28 antibodies (red bars), in the presence of neutrophils from control donors (blue bars), FHL-5 patients (C-D, green bars), or an MPO-deficient patient (E-F, green bars), and/or indicated stimuli. Cells were harvested after 4 to 6 days and analyzed by flow cytometry for CFSE dilution among CD4+ T cells. Error bars indicate SEM. ***P < .001; **P < .01; *P < .05. CytoB, cytochalasin B; pt, patient.
Figure 5.
Figure 5.
The suppressive activity of neutrophils depends on CD11b-dependent physical contact. (A) Purified T cells were cultured with anti-CD3 and anti-CD28 antibodies (red bars) and cultured either together with neutrophils in a well (blue bars) or physically separated from neutrophils by culturing the T cells on a Transwell filter insert. Neutrophils were incubated without (setup A, green bar) or with (setup B, purple bar) purified T cells in the lower compartment. T cells on top of the Transwell filter were harvested after 5 days and analyzed by flow cytometry for CFSE dilution among CD4+ T cells (n = 4). (B) Purified T cells (red bars) and neutrophils (blue bars) were cultured together with the indicated stimuli. Where indicated, neutrophils were pre-incubated with a CD11b-blocking antibody before they were added to the assay (n = 3-5). The isotype control had no effect on the MDSC activity (not included in graph). (C) Purified T cells from healthy donors (n = 2) were incubated with either control neutrophils or neutrophils from LAD-1 patients (n = 2). (D) Live cell imaging of 1,1′-dioctadecyl-3,3,3′,3′-tetramethylindodicarbocyanine,4-chlorobenzenesulfonate salt (DiD)–labeled T cells (red) and neutrophils in the presence of anti-CD3 antibodies, anti-CD28 antibodies, TNF-α, and dihydrorhodamine-1,2,3 (turns green after reaction with ROS). The coculture was imaged for 4 hours. Two fields of view of 1 representative experiment of 3 is shown. The white arrows indicate the uptake of the T-cell membrane by the neutrophil. (E) DiD-labeled purified T cells were cocultured for 3 hours with neutrophils and indicated stimuli with or without a CD11b-blocking antibody, after which cells were harvested for flow cytometric analysis in which the amount of uptake of DiD-labeled T-cell membrane by neutrophils was determined (n = 4). Error bars indicate SEM. ****P < .0001; ***P < .001; **P < .01. MFI, mean fluorescent intensity.
Figure 6.
Figure 6.
Suppressive activity of neutrophils (N) results in a population of small nonresponsive T cells. (A) Gating of FSClow (red) and large (green) T cells on FSC/SSC plots of (representative) flow cytometric analysis of purified T cells cultured with or without neutrophils in the presence of IL-15 and TNF-α (n = 3). (B) The surface marker expression of indicated proteins was measured by flow cytometric analysis of unstimulated T cells (purple bars), T cells stimulated for 2 days with IL-15 (blue bars), and T cells stimulated for 2 days with IL-15 in the presence of activated neutrophils. The latter T cells were separated into large (green bars) and small (red bars) groups (n = 3). (C) T cells cultured for 2 days in the presence of IL-15 and TNF-α–activated neutrophils were sorted into small and large T cells and cultured separately in the presence of anti-CD3/CD28 antibodies or phytohemagglutinin-L (PHA-L). Cells were harvested after 4 to 6 days and were analyzed by flow cytometry for CFSE dilution (n = 5-9). Error bars indicate SEM. ****P < .0001; ***P < .001; **P < .01; *P < .05.
Figure 7.
Figure 7.
T-cell suppression is induced by a nonapoptotic pathway. T cells cultured for 2 days in the presence of IL-15 and TNF-α–activated neutrophils were harvested for flow cytometry or separated into small and large T cells by FACS for proteomic comparison, electron microscopy imaging, adenosine triphosphate (ATP) level determination, and MitoTracker staining. (A) Representative FACS plots of annexin V and Hoechst binding in cell gate for large T cells or FSClow T cells; the red squares indicate the FSClow T cells induced by MDSC activity of activated neutrophils (n = 3). (B) Flow cytometric analysis of cytoplasmic presence of cleaved caspase-3 in T cells after indicated culture conditions of 2 days (n = 4). (C) Principal component analysis of mass spectrometry label-free quantification (LFQ) intensities of small (S) and large (L) T cells. (D) Volcano plot representation of a 2-sided non-paired Student t test (small vs large T cells) with an false discovery rate of 0.05 and an S0 value of 2. Proteins more abundant in small T cells compared with large T cells are red and proteins less abundant are blue (see supplemental Table 1 for protein identification). (E) Heat plot representation of LFQ values of proteins annotated for mitochondrial localization (Human MitoCarta 2.0; 1158 entries) affected in this analysis. (F) ATP levels were measured in T cells cultured for 2 days either unstimulated (purple bars), stimulated by IL-15 and TNF-α (blue bars), or in the presence of neutrophils activated by IL-15 and TNF-α. The latter T cells were separated into large (green bars) and small (red bars) T cells (n = 3). (G) Live cell imaging of mitochondria stained with MitoTracker Green and Hoechst in small and large T cells. Shown are representative images of 3 experiments (magnification ×40). (H) Representative electron microscopy photos of small and large T cells (n = 4). Scale bar for top left image is 1 μm; scale bars for other images are 2 μm. *P < .05, ***P < .001. Stim, stimulated; Unstim, unstimulated.

References

    1. Treffers LW, Hiemstra IH, Kuijpers TW, van den Berg TK, Matlung HL. Neutrophils in cancer. Immunol Rev. 2016;273(1):312-328. - PubMed
    1. Mandruzzato S, Brandau S, Britten CM, et al. . Toward harmonized phenotyping of human myeloid-derived suppressor cells by flow cytometry: results from an interim study. Cancer Immunol Immunother. 2016;65(2):161-169. - PMC - PubMed
    1. Solito S, Marigo I, Pinton L, Damuzzo V, Mandruzzato S, Bronte V. Myeloid-derived suppressor cell heterogeneity in human cancers. Ann N Y Acad Sci. 2014;1319(1):47-65. - PubMed
    1. Sagiv JY, Michaeli J, Assi S, et al. . Phenotypic diversity and plasticity in circulating neutrophil subpopulations in cancer. Cell Reports. 2015;10(4):562-573. - PubMed
    1. Choi J, Suh B, Ahn YO, et al. . CD15+/CD16low human granulocytes from terminal cancer patients: granulocytic myeloid-derived suppressor cells that have suppressive function. Tumour Biol. 2012;33(1):121-129. - PubMed

Publication types