. 2019 Nov 14;20(22):5710.
doi: 10.3390/ijms20225710.

The Biological Effects of Complete Gasoline Engine Emissions Exposure in a 3D Human Airway Model (MucilAirTM) and in Human Bronchial Epithelial Cells (BEAS-2B)

Affiliations

The Biological Effects of Complete Gasoline Engine Emissions Exposure in a 3D Human Airway Model (MucilAirTM) and in Human Bronchial Epithelial Cells (BEAS-2B)

Pavel Rossner Jr et al. Int J Mol Sci. .

Abstract

The biological effects induced by complete engine emissions in a 3D model of the human airway (MucilAirTM) and in human bronchial epithelial cells (BEAS-2B) grown at the air-liquid interface were compared. The cells were exposed for one or five days to emissions generated by a Euro 5 direct injection spark ignition engine. The general condition of the cells was assessed by the measurement of transepithelial electrical resistance and mucin production. The cytotoxic effects were evaluated by adenylate kinase (AK) and lactate dehydrogenase (LDH) activity. Phosphorylation of histone H2AX was used to detect double-stranded DNA breaks. The expression of the selected 370 relevant genes was analyzed using next-generation sequencing. The exposure had minimal effects on integrity and AK leakage in both cell models. LDH activity and mucin production in BEAS-2B cells significantly increased after longer exposures; DNA breaks were also detected. The exposure affected CYP1A1 and HSPA5 expression in MucilAirTM. There were no effects of this kind observed in BEAS-2B cells; in this system gene expression was rather affected by the time of treatment. The type of cell model was the most important factor modulating gene expression. In summary, the biological effects of complete emissions exposure were weak. In the specific conditions used in this study, the effects observed in BEAS-2B cells were induced by the exposure protocol rather than by emissions and thus this cell line seems to be less suitable for analyses of longer treatment than the 3D model.

Keywords: 3D models; cell monocultures; complete engine emissions; gene expression.


Conflict of interest statement

The authors declare no conflict of interest.

Figures
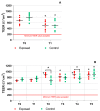
Figure 1
Figure 1
Transepithelial electrical resistance (TEER) measurement in the MucilAirTM tissues. (A) A significant drop in TEER values was observed after one-day exposure. (B) A significant increase of TEER values in exposed samples after longer exposures (time points T2–T5). Asterisks denote significant (p ≤ 0.05) differences between T0 and later time points or between the exposed and controls for a given time point (T2 and T4).
Figure 2
Figure 2
Mucin production by BEAS-2B cells and the MucilAirTM tissues. (A) A decrease in mucin production by the MucilAirTM tissues after one-day treatment. (B) A weak increase of mucin levels after longer treatment of the MucilAirTM tissues (time points T3–T5). (C) Low mucin production in BEAS-2B cells after one-day exposure. (D) Time-dependent increase of mucin production in BEAS-2B cells after longer exposure periods. Asterisks denote significant (p ≤ 0.05) differences between T0 and later time points or between the exposed and controls for a given time point (T4 and T5).
Figure 3
Figure 3
The activity of adenylate kinase after exposure to complete emissions. Very low activity in the MucilAirTM system after one-day (A) and five-day (B) exposure. (C) Minimal activity in BEAS-2B cells after one-day exposure. (D) A weak response in BEAS-2B cells after five-day treatment (time points T3–T5).
Figure 4
Figure 4
The activity of lactate dehydrogenase after exposure to complete emissions. No activity in the MucilAirTM system after one-day (A) and five-day (B) exposure. (C) Increased LDH activity in BEAS-2B cells after one-day exposure. (D) High LDH activity in BEAS-2B cells after five-day treatment in both exposed and control samples. Asterisks denote significant (p ≤ 0.05) differences between T0 and later time points.
Figure 5
Figure 5
Histone H2AX phosphorylation after exposure to complete emissions. (A) No induction in the MucilAirTM system after either time period. (B) Increased levels of DNA double-strand breaks in BEAS-2B cells after one-day and five-day treatment. Asterisks denote significant (p ≤ 0.05) differences between the exposed cells and controls.
Figure 6
Figure 6
Microscopic images of cell models grown at the air–liquid interface (ALI) used in the study. The images were recorded using an Olympus BX41 light microscope using final magnification 1000×. (A) MucilAirTM tissue grown on polyester membrane (0.4-µm pore size) with visible cilia on the apical side of the tissue, (B) BEAS-2B cells grown at ALI conditions (polyester membrane (0.4-µm pore size)) formed a monolayer with no visible over-grown structures.
Figure 6
Figure 6
Microscopic images of cell models grown at the air–liquid interface (ALI) used in the study. The images were recorded using an Olympus BX41 light microscope using final magnification 1000×. (A) MucilAirTM tissue grown on polyester membrane (0.4-µm pore size) with visible cilia on the apical side of the tissue, (B) BEAS-2B cells grown at ALI conditions (polyester membrane (0.4-µm pore size)) formed a monolayer with no visible over-grown structures.
Figure 7
Figure 7
Exposure schemes used to expose the MucilAirTM tissues and BEAS-2B cells to complete emissions. (A) One-day exposure and definition of “the exposure unit”. (B) Five-day exposure. Individual time points (T0–T5) and parameters analyzed at these time points are shown. For details, see the description in Section 4.3. WLTC: World Harmonized Light Vehicle Test Cycle; AK: adenylate kinase; LDH: lactate dehydrogenase.
Figure 7
Figure 7
Exposure schemes used to expose the MucilAirTM tissues and BEAS-2B cells to complete emissions. (A) One-day exposure and definition of “the exposure unit”. (B) Five-day exposure. Individual time points (T0–T5) and parameters analyzed at these time points are shown. For details, see the description in Section 4.3. WLTC: World Harmonized Light Vehicle Test Cycle; AK: adenylate kinase; LDH: lactate dehydrogenase.

References

    1. Lewtas J. Air pollution combustion emissions: Characterization of causative agents and mechanisms associated with cancer, reproductive, and cardiovascular effects. Mutat. Res. 2007;636:95–133. doi: 10.1016/j.mrrev.2007.08.003. - DOI - PubMed
    1. De Marini D.M. Genotoxicity biomarkers associated with exposure to traffic and near-road atmospheres: A review. Mutagenesis. 2013;28:485–505. doi: 10.1093/mutage/get042. - DOI - PubMed
    1. International Agency for Research on Cancer (IARC) Diesel and Gasoline Engine Exhausts and Some Nitroarenes. Volume 105 IARC Publications; Lyon, France: 2013. IARC Monographs on the Evaluation of the Carcinogenic Risk of Chemicals to Humans. - PubMed
    1. Eisenbrand G., Pool-Zobel B., Baker V., Balls M., Blaauboer B.J., Boobis A., Carere A., Kevekordes S., Lhuguenot J.-C., Pieters R., et al. Methods of in vitro toxicology. Food Chem. Toxicol. 2002;40:193–236. doi: 10.1016/S0278-6915(01)00118-1. - DOI - PubMed
    1. Müller L. 4.3 In vitro genotoxicity tests to detect carcinogenicity: A systematic review. Hum. Exp. Toxicol. 2009;28:131–133. doi: 10.1177/0960327109105770. - DOI - PubMed

LinkOut - more resources