. 2019 Nov 18;16(1):229.
doi: 10.1186/s12974-019-1614-1.

Neuronal maturation reduces the type I IFN response to orthobunyavirus infection and leads to increased apoptosis of human neurons

Affiliations

Neuronal maturation reduces the type I IFN response to orthobunyavirus infection and leads to increased apoptosis of human neurons

Clayton W Winkler et al. J Neuroinflammation. .

Abstract

Background: La Crosse virus (LACV) is the leading cause of pediatric arboviral encephalitis in the USA. LACV encephalitis can result in learning and memory deficits, which may be due to infection and apoptosis of neurons in the brain. Despite neurons being the primary cell infected in the brain by LACV, little is known about neuronal responses to infection.

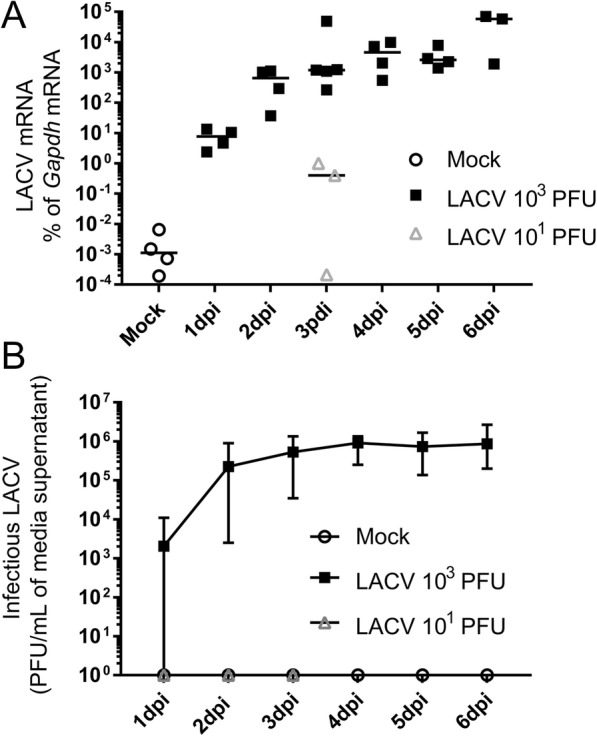
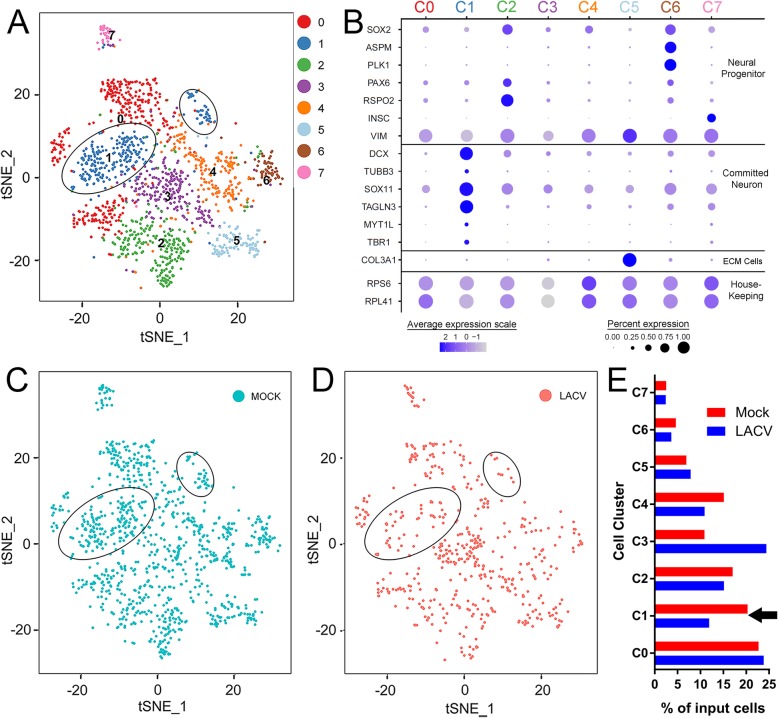
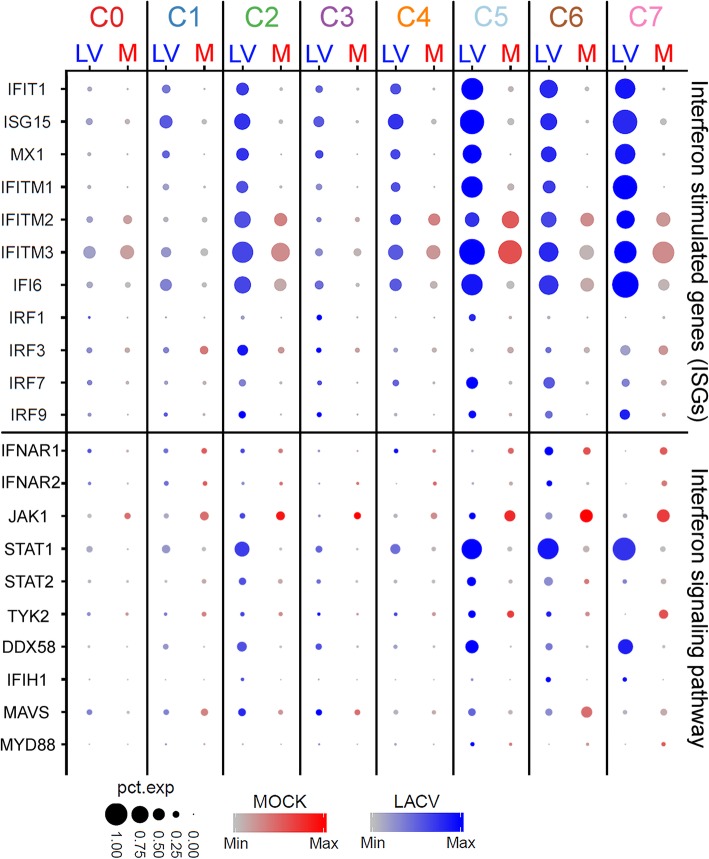
Methods: Human cerebral organoids (COs), which contain a spectrum of developing neurons, were used to examine neuronal responses to LACV. Plaque assay and quantitative reverse transcription (qRT) PCR were used to determine the susceptibility of COs to LACV infection. Immunohistochemistry, flow cytometry, and single-cell transcriptomics were used to determine specific neuronal subpopulation responses to the virus.

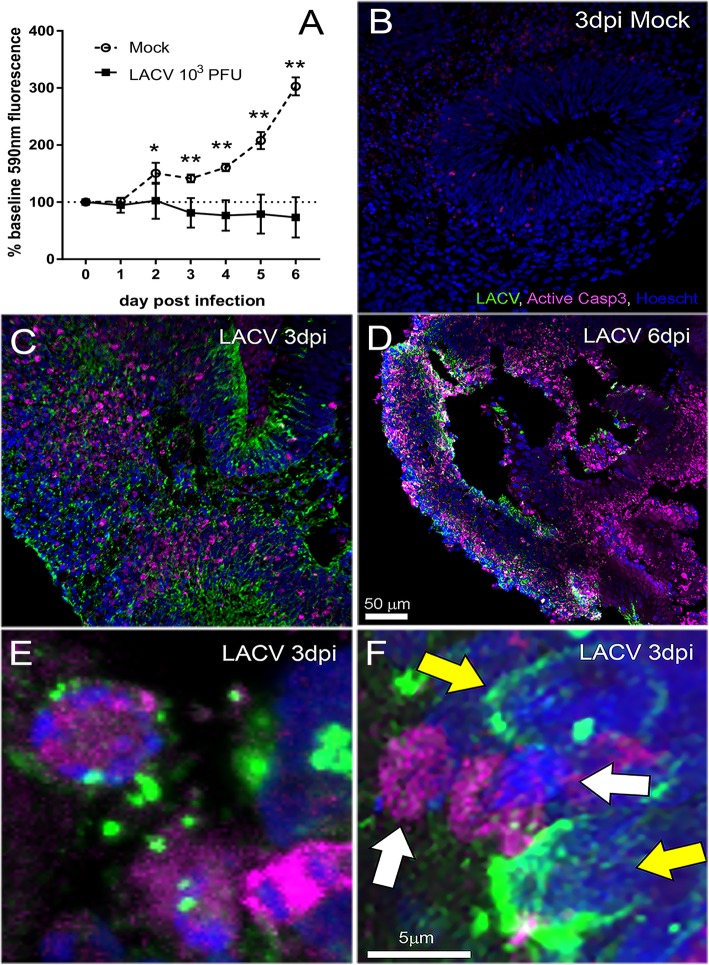
Results: Overall, LACV readily infected COs causing reduced cell viability and increased apoptosis. However, it was determined that neurons at different stages of development had distinct responses to LACV. Both neural progenitors and committed neurons were infected with LACV, however, committed neurons underwent apoptosis at a higher rate. Transcriptomic analysis showed that committed neurons expressed fewer interferon (IFN)-stimulated genes (ISGs) and genes involved IFN signaling in response to infection compared to neural progenitors. Furthermore, induction of interferon signaling in LACV-infected COs by application of recombinant IFN enhanced cell viability.

Conclusions: These findings indicate that neuronal maturation increases the susceptibility of neurons to LACV-induced apoptosis. This susceptibility is likely due, at least in part, to mature neurons being less responsive to virus-induced IFN as evidenced by their poor ISG response to LACV. Furthermore, exogenous administration of recombinant IFN to LACV COs rescued cellular viability suggesting that increased IFN signaling is overall protective in this complex neural tissue. Together these findings indicate that induction of IFN signaling in developing neurons is an important deciding factor in virus-induced cell death.

Keywords: Apoptosis; Encephalitis; Human cerebral organoids; Neurogenesis; Neuron; Orthobunyavirus; Single-cell transcriptomics; Type I interferon.


Conflict of interest statement

The authors declare that they have no competing interests.

Figures

Fig. 1
Fig. 1
Morphology of cerebral organoids during LACV infection. Representative brightfield images of a mock, b 3 dpi LACV, and c 6 dpi LACV COs. d-f Enlargements of boxed areas in a-c are shown. White arrows in d and e indicate areas of structural complexity that appear diminished by 6 dpi (f). Scale bar in c corresponds to a-f. g Representative immunofluorescence scanned image of a whole-mount, mock-infected cerebral organoid labeled with doublecortin (DCX, red) and Hoechst (blue) to label committed neurons and nuclei respectively. Areas in white boxes are analogous to those highlighted in a–f and are similar to areas focused on in subsequent experiments
Fig. 2
Fig. 2
Replication kinetics in LACV-infected iPSC-derived human COs. a COs were collected at indicated timepoints for evaluation of viral RNA via qRT PCR with virus-specific primers. Viral RNA levels for each sample were calculated as the percentage difference in threshold cycle (CT) value (ΔCT = CT for Gapdh gene-CT for virus). Viral mRNA was plotted as the percentage of gene expression relative to that of the Gapdh gene. Open circles indicate mock COs, closed squares COs infected with 103 PFU, and open squares CO infected with 101 PFU. Each point represents one CO. b Media supernatants were collected from individual wells containing COs at the indicated time point and assayed for PFU/mL by plaque assay. Data are representative of n = 6–12 mock, n = 6–24 LACV 103, and n = 3 LACV 101 COs
Fig. 3
Fig. 3
Cell death in LACV-infected iPSC-derived human COs. a A resazurin reduction-based cell viability assay was performed daily on individual COs within a 24 well plate. Data is plotted as an average percent of base fluorescence measured at 590 nm for each CO just prior to infection with mock (open circles) or LACV (closed squares). Fluorescence for each sample at each time point was read in triplicate at the indicated time point. A two-way ANOVA with a Sidak’s multiple comparisons test was used to determine significance. *p < 0.05, **p < 0.001. Data are representative of n = 3 mock and n = 6 LACV 103 COs. b–d Representative images of COs immunohistochemically labeled for active caspase-3 (Casp3, magenta), LACV (green), and nuclei (blue). b is from a mock-infected CO, c a 3 dpi LACV-infected organoid and d a 6 dpi LACV-infected organoid. Scale bar in d also applies to b and c. e, f High magnification images taken from the same section of a 3 dpi LACV-infected CO. e Illustrates a caspase3+ cell (magenta) that is infected with LACV (green). f Caspase3+ cells that are not infected with LACV (white arrows) and LACV-infected cells that are not caspase3+ (yellow arrows). Scale bar in f also applies to e
Fig. 4
Fig. 4
Committed neurons are susceptible to LACV-induced apoptosis. Representative confocal images of (a, f, and k) mock or (be, gj, and lo) 3 dpi LACV-infected COs immunohistochemically labeled with LACV (green), neuronal phenotyping antibodies (white), activated poly caspases (magenta), and nuclei (blue). Images are grouped by row using the neuronal phenotyping antibody with Sox2 being top, DCX middle, and βIII tubulin bottom. The three middle columns are images of single channels overlaid on nuclei from 3 dpi LACV-infected COs that are labeled accordingly. The far-right column (e, j, and o) is a combination of all four labels. The insets in e, j, and o are enlarged images of the highlighted yellow boxes in each panel. The corresponding yellow arrows in the associated individual label panels highlight the cell of interest shown in the inset. The images in the a, f, and k mock column are a combination of all four labels. All images were taken with a × 63 objective and are maximum intensity projects of 3 μm z-stacks taken with a 0.5 μm step. Scale bar in B = 20 μm and applies to all panels
Fig. 5
Fig. 5
Single-cell transcriptomic profiling of mock- and LACV-infected organoids. a t-distributed stochastic neighbor embedding (tSNE) plots of canonical correlation analysis (CCA) aligned cell transcript profiles from 3 dpi mock- and LACV-infected COs clustered according to relatedness. Seven clusters were identified for optimal data resolution according to CCA and each is indicated by a different color. Each dot within each cluster represents the transcript profile from an individual cell. b Neural progenitors, committed neurons or extracellular matrix (ECM) producing mesenchymal cell-related transcript expression are shown for each identified cluster in a. Ribosomal (house-keeping) transcript expression in each cluster is shown as a positive control for sequencing. Increasing expression of each transcript is illustrated according to the deepening shade of gray to purple to blue. The proportion of cells expressing each transcript within the cluster is indicated by the size of the dot (scales at bottom). The tSNE plot in a was split to show cell transcript profiles from the (c) mock- or (d) LACV-infected CO still arranged within the 7 clusters. The two ellipses on each plot represent the boundaries of C1. The proportion of input cell transcript profiles in each cluster (e) is shown for both the mock (red) and LACV (blue) CO. The arrow in e denotes the decrease observed in C1 with LACV infection
Fig. 6
Fig. 6
Flow cytometry analysis of neuronal cells from mock- and LACV-infected COs. Mock- (ad) and LACV-infected (eh) COs were non-enzymatically digested into a single cell suspension and analyzed via flow cytometry as described in the “Methods” section. Two representative examples are shown. Live cells were identified and interrogated for expression of activated poly-caspases (y-axis) and LACV expression (x-axis). a, e Active caspase and LACV staining from the whole live cell population. Gating within the whole live cell population for Sox2 (b, f), DCX (c, g) and βIII tubulin-positive cells allowed for examination of active poly-caspase and LACV staining within each neuronal population. Proportions of LACV-infected (i), activated poly-caspase (j), and LACV-infected/activated poly-caspase double-positive (k) neuronal cells within mock (closed circles) or infected (open squares) COs are shown. A two-way ANOVA with a Sidak’s multiple comparisons test was used to determine significance. **p < 0.001, ****p < 0.0001
Fig. 7
Fig. 7
The type I interferon (IFN) response to LACV in neural progenitors and committed neurons. Expression of interferon-stimulated gene (ISG, upper section) type I IFN signaling and effector transcripts in the mock and LACV cells from COs that underwent single-cell transcriptome analysis. The same 7 clusters that were identified in Fig. 5 are shown and are segregated into the mock (red) and LACV (blue) samples. Increasing expression of each transcript is illustrated according to the deepening shade of either red for mock or blue for LACV. The proportion of cells expressing each transcript within the cluster are indicated by the size of the dot (scales at the bottom)
Fig. 8
Fig. 8
Type I IFN signaling induction in committed neurons increases cell survival. Cell viability of mock- or LACV-infected COs treated with either a IFNα2 and IFNα4 concomitantly or b IFNβ1 individually were measured using a resazurin reduction-based assay. Data is plotted as an average percent of base fluorescence measured at 590 nm for each CO. Mock IFN-treated samples are indicated by open circles, LACV vehicle-treated samples are indicated by open squares and LACV IFN-treated samples are indicated by open triangles. Fluorescence for each sample at each time point was read in triplicate at the indicated time point. A two-way ANOVA with a Sidak’s multiple comparisons test was used to determine significance. *p < 0.05. Data are representative of n = 3 mock IFNα2/4, n = 6 LACV Vehicle, n = 3 LACV IFNα2/4, n = 6 mock IFNβ1 and n = 6 LACV IFNβ1 treated COs. c Supernatants from mock (black circles), LACV IFNβ1 (green triangles), LACV IFNα2/4 (blue triangles), or LACV vehicle (red squares) treated COs were collected daily and assayed for viral RNA via qRT PCR. Data are presented as LACV RNA expression relative to an experimentally determined PFU standard. A two-way repeated measure ANOVA with a Dunnett’s multiple comparison test was performed on the antilog of the experimental values to establish differences between LACV vehicle and IFN treated samples. **p < 0.01, *p < 0.05. *Color denotes which condition differed relative to LACV vehicle. d Quantification of immunohistochemical labeling for Sox2, DCX, and βIII tubulin in sections from the same COs shown in b are plotted as a percent positive signal of organoid area. A Kruskal-Wallis one-way ANOVA test with multiple comparisons was used to determine significance. ***p < 0.005. Representative sections of βIII tubulin staining in whole COs treated with e mock INFβ1, f LACV vehicle, or g LACV IFNβ1 are shown

References

    1. Haddow AD, Bixler D, Odoi A. The spatial epidemiology and clinical features of reported cases of La Crosse virus infection in West Virginia from 2003 to 2007. BMC Infect Dis. 2011;11:29. doi: 10.1186/1471-2334-11-29. - DOI - PMC - PubMed
    1. Thompson WH, Kalfayan B, Anslow RO. Isolation of California encephalitis group virus from a fatal human illness. Am J Epidemiol. 1965;81:245–253. doi: 10.1093/oxfordjournals.aje.a120512. - DOI - PubMed
    1. La Crosse Encephalitis Epidemiology & Geographic Distribution. [https://www.cdc.gov/lac/tech/epi.html]. Accessed 1 July 2019.
    1. McJunkin JE, Khan R, de los Reyes EC, Parsons DL, Minnich LL, Ashley RG, Tsai TF. Treatment of severe La Crosse encephalitis with intravenous ribavirin following diagnosis by brain biopsy. Pediatrics. 1997;99:261–267. doi: 10.1542/peds.99.2.261. - DOI - PubMed
    1. McJunkin JE, de los Reyes EC, Irazuzta JE, Caceres MJ, Khan RR, Minnich LL, Fu KD, Lovett GD, Tsai T, Thompson A. La Crosse encephalitis in children. N Engl J Med. 2001;344:801–807. doi: 10.1056/NEJM200103153441103. - DOI - PubMed

Substances