

Review
doi: 10.1016/j.hoc.2019.09.010.
Epub 2019 Oct 31.
Imaging for Response Assessment in Radiation Oncology: Current and Emerging Techniques
Affiliations
- PMID: 31739950
- PMCID: PMC7253297
- DOI: 10.1016/j.hoc.2019.09.010
Item in Clipboard
Review
Imaging for Response Assessment in Radiation Oncology: Current and Emerging Techniques
Hematol Oncol Clin North Am.
2020 Feb.
Abstract
Imaging in radiation oncology is essential for the evaluation of treatment response in tumors and organs at risk. This influences further treatment decisions and could possibly be used to adapt therapy. This review article focuses on the currently used imaging modalities for response assessment in radiation oncology and gives an overview of new and promising techniques within this field.
Keywords: CT; Functional imaging; MRI; Organs at risk; PET; Radiation oncology; Response assessment; Tumor.
Copyright © 2019 Elsevier Inc. All rights reserved.
Figures

Example of a patient with a lung adenocarcinoma metastasis at the left skull base (red arrow). Left: 140 keV DE-CT (window level: −100 – 250 HU), middle: 60 keV DE-CT (window level: −100 – 250 HU), right: Iodine map of DE-CT (window level: −10 – 100 HU).
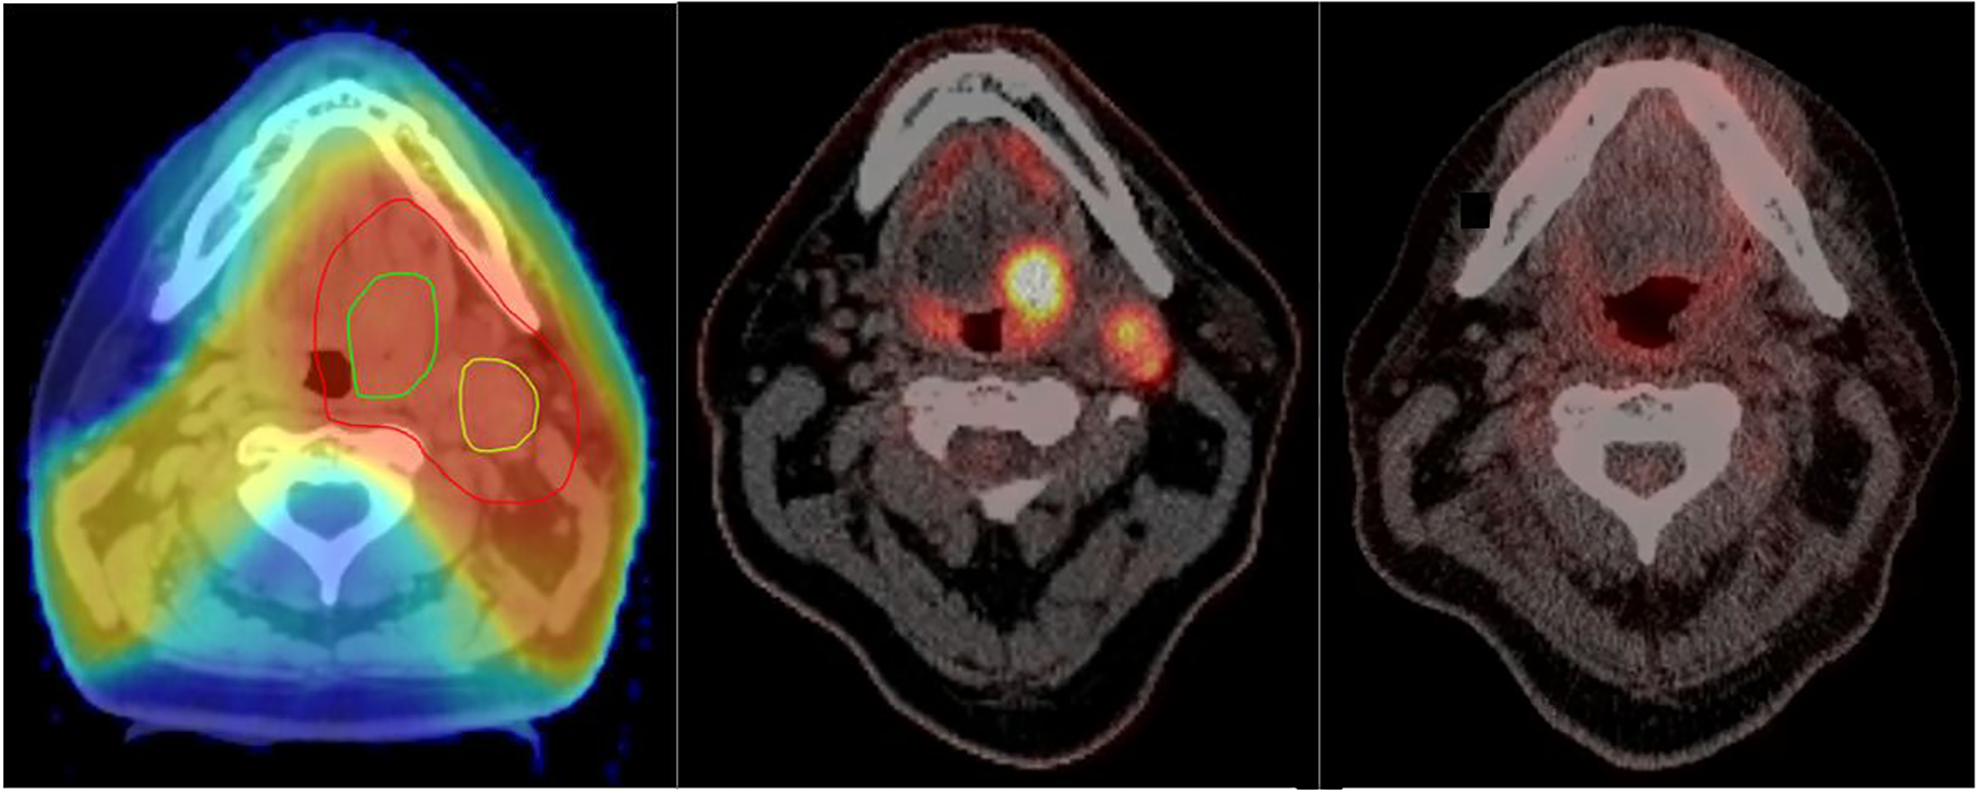
Example of a patient with T2 base of tongue (BOT) tumor and ipsilateral neck lymph node. Left: Treatment plan with BOT tumor delineated in dark green, lymph node in light green and clinical target volume (CTV) in red; middle: PET/CT before treatment (window level for PET: 0.5 – 22 SUV); right: PET/CT 3 months after radiochemotherapy (window level for PET: 0.5 – 22 SUV).
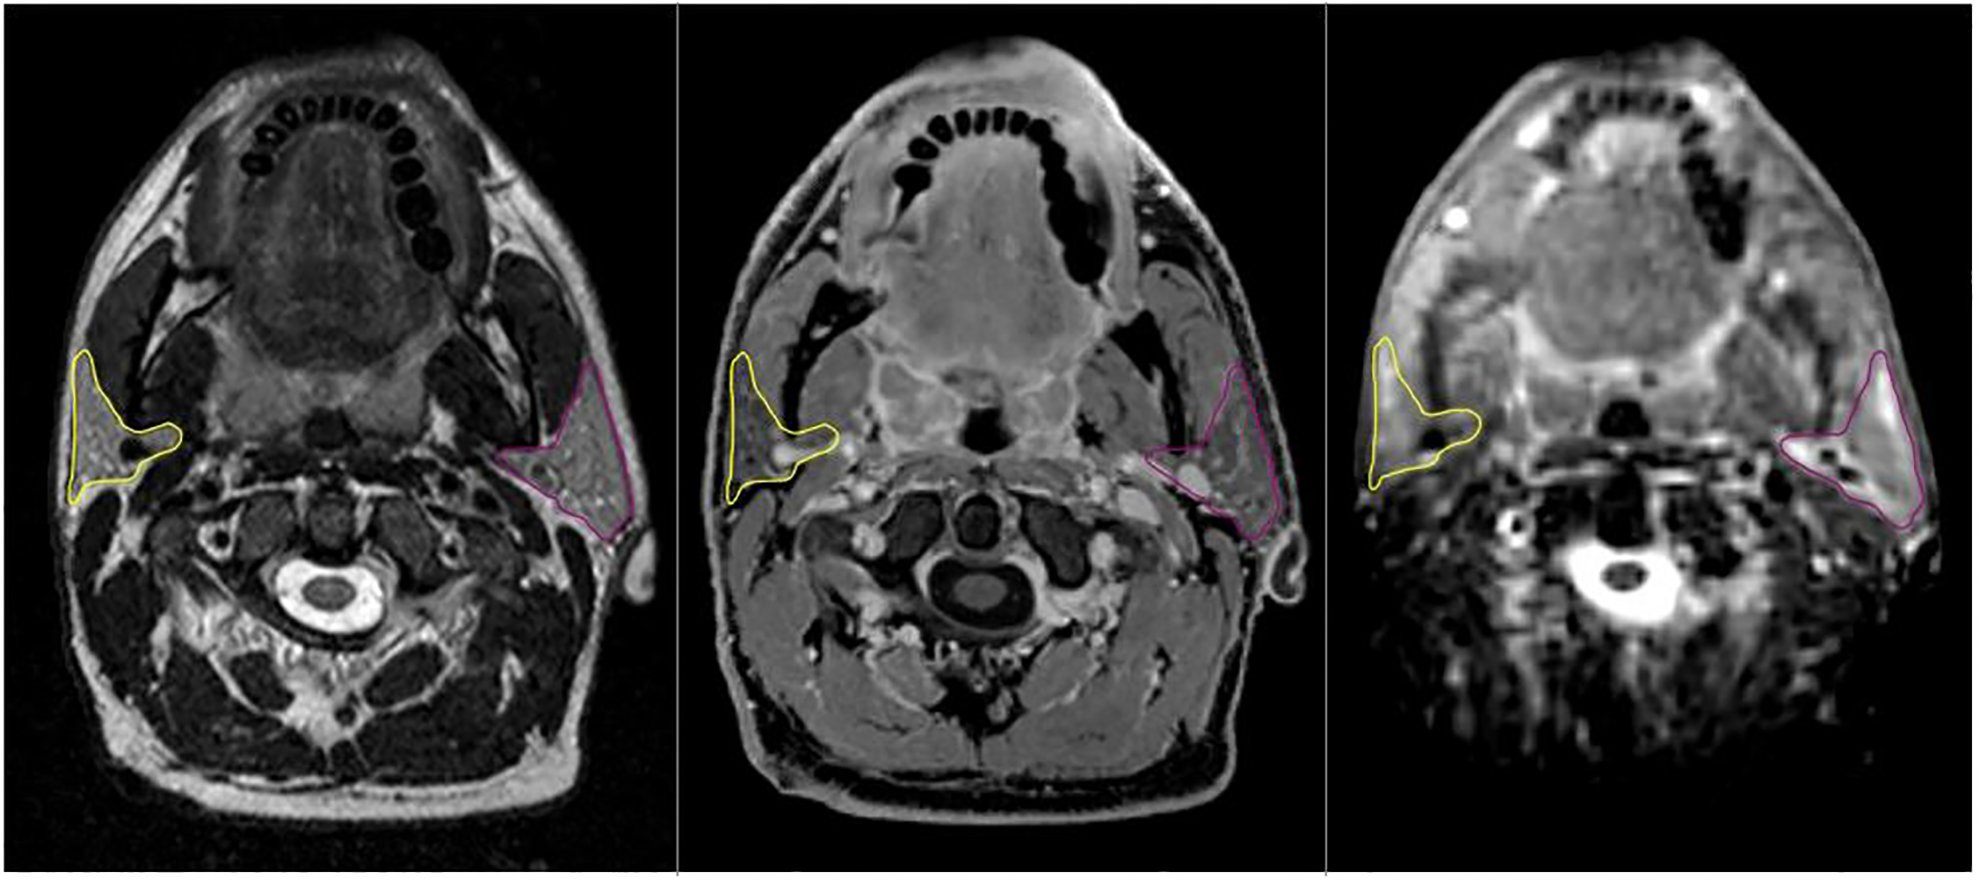
54-year old patient with bilateral tonsil cancer stage IVA. Parotid gland structures are highlighted in yellow and pink and were rigidly propagated from T2 image (left) to DIXON (middle) and ADC map (right side).
References
-
- Eisenhauer EA, Therasse P, Bogaerts J, et al. New response evaluation criteria in solid tumours: revised RECIST guideline (version 1.1). Eur J Cancer. 2009;45(2):228–247. - PubMed
-
- Coolens C, Driscoll B, Chung C, et al. Automated voxel-based analysis of volumetric dynamic contrast-enhanced CT data improves measurement of serial changes in tumor vascular biomarkers. International journal of radiation oncology, biology, physics. 2015;91(1):48–57. - PubMed
