. 2019 Nov 18;2(6):e201900491.
doi: 10.26508/lsa.201900491. Print 2019 Dec.

Plasticity in salt bridge allows fusion-competent ubiquitylation of mitofusins and Cdc48 recognition

Affiliations

Plasticity in salt bridge allows fusion-competent ubiquitylation of mitofusins and Cdc48 recognition

Vincent Anton et al. Life Sci Alliance. .

Abstract

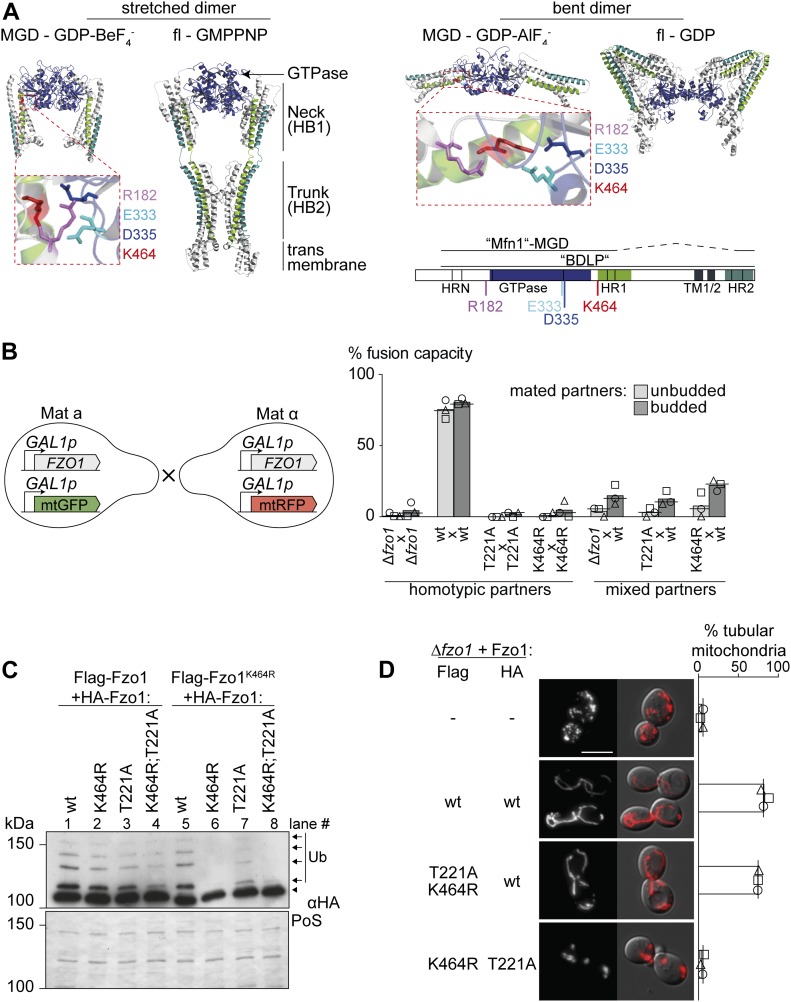
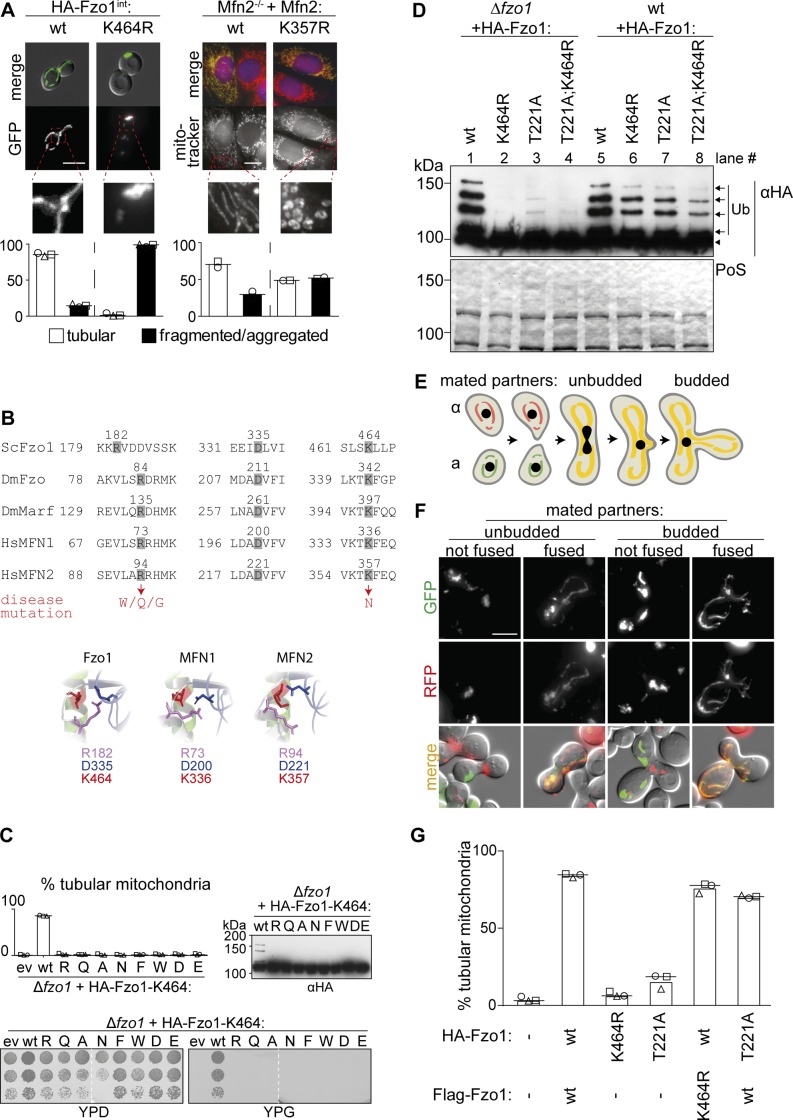
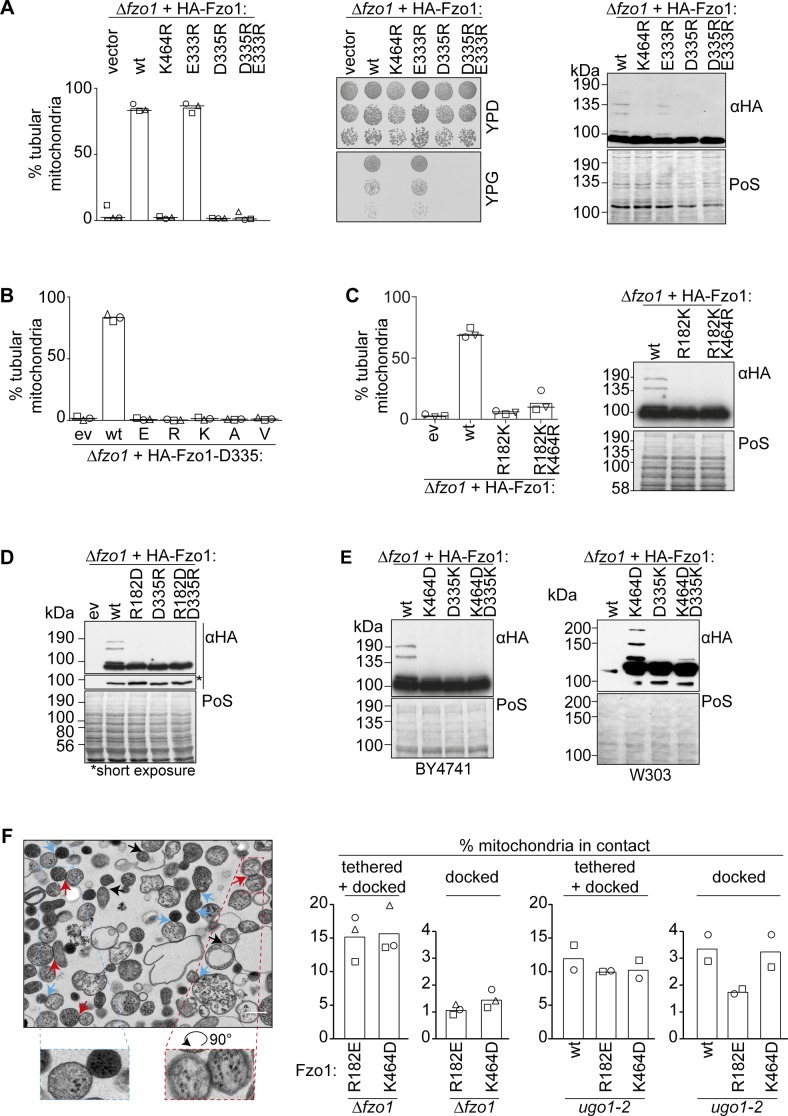
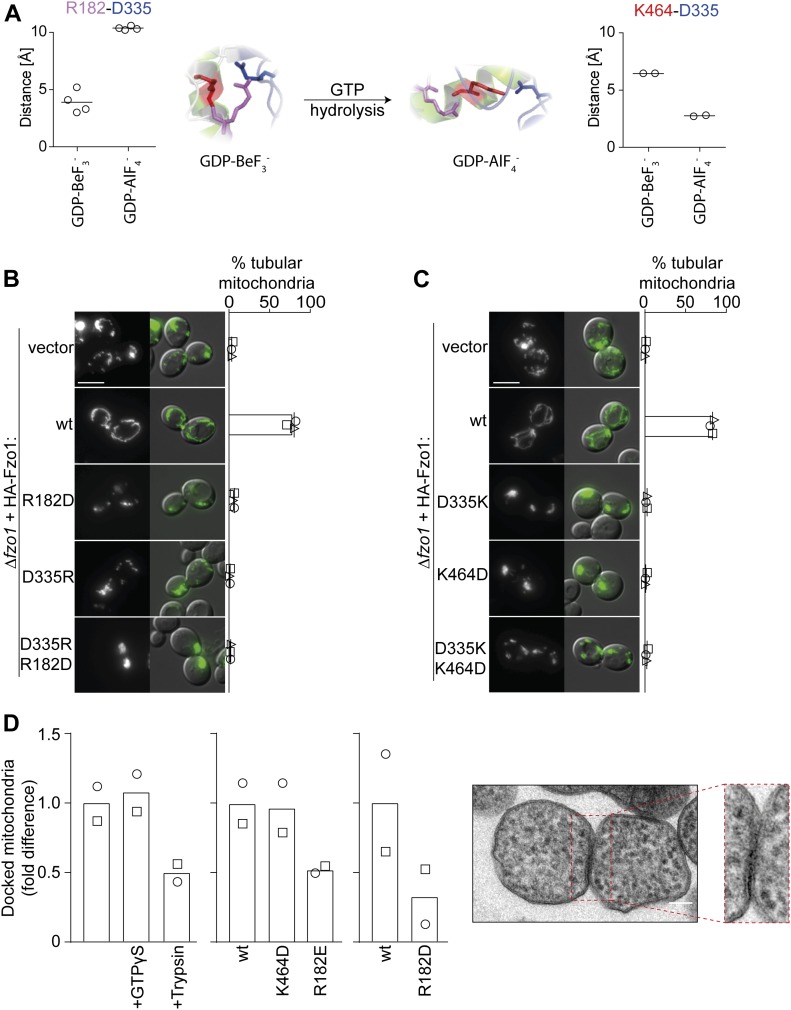
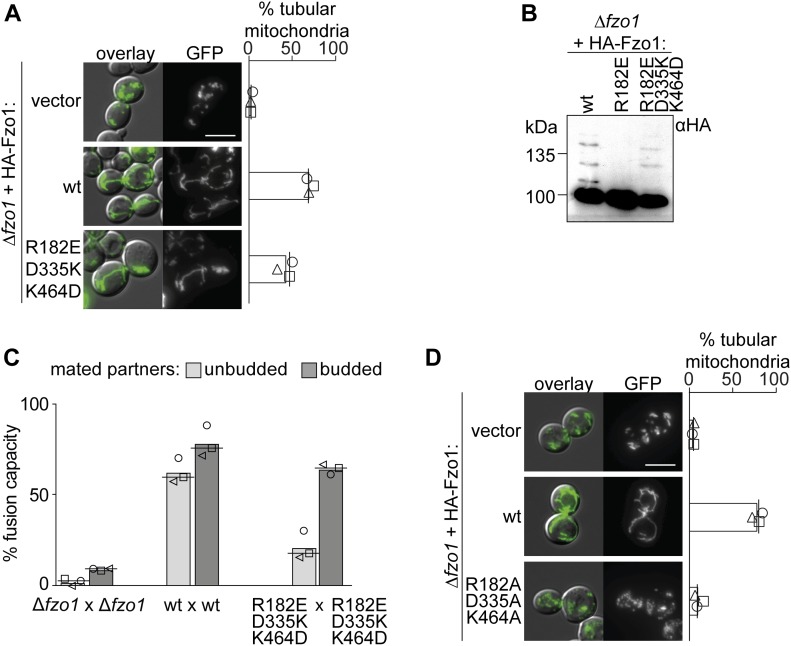
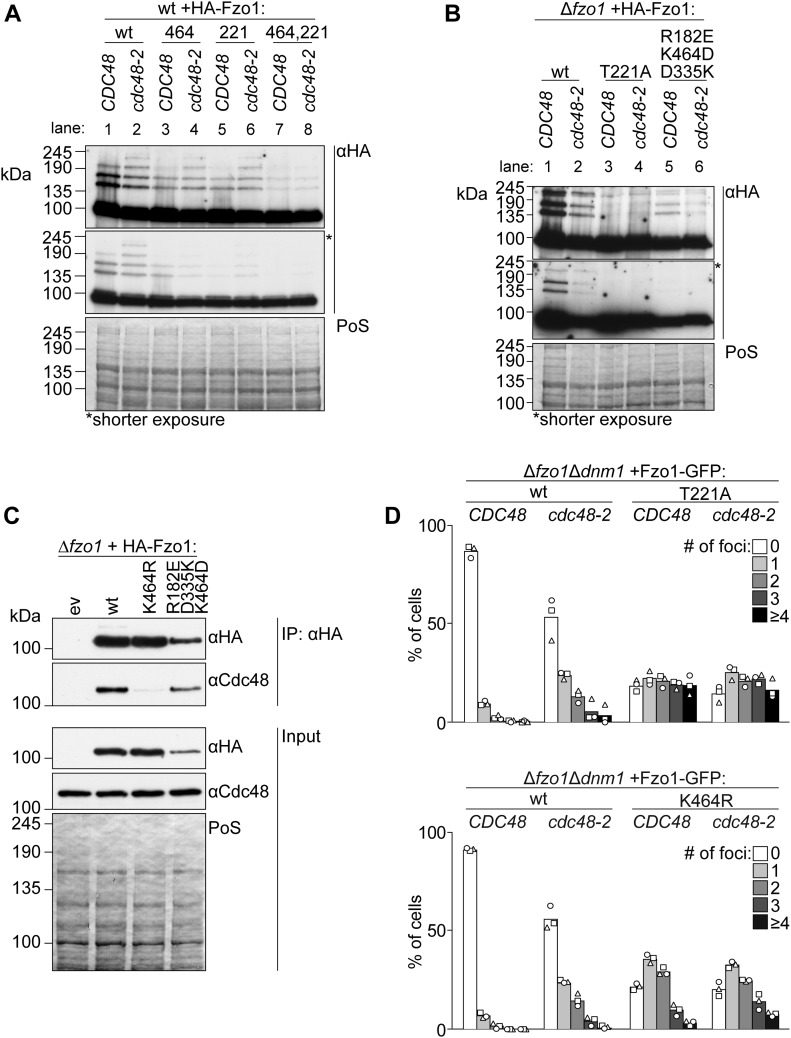
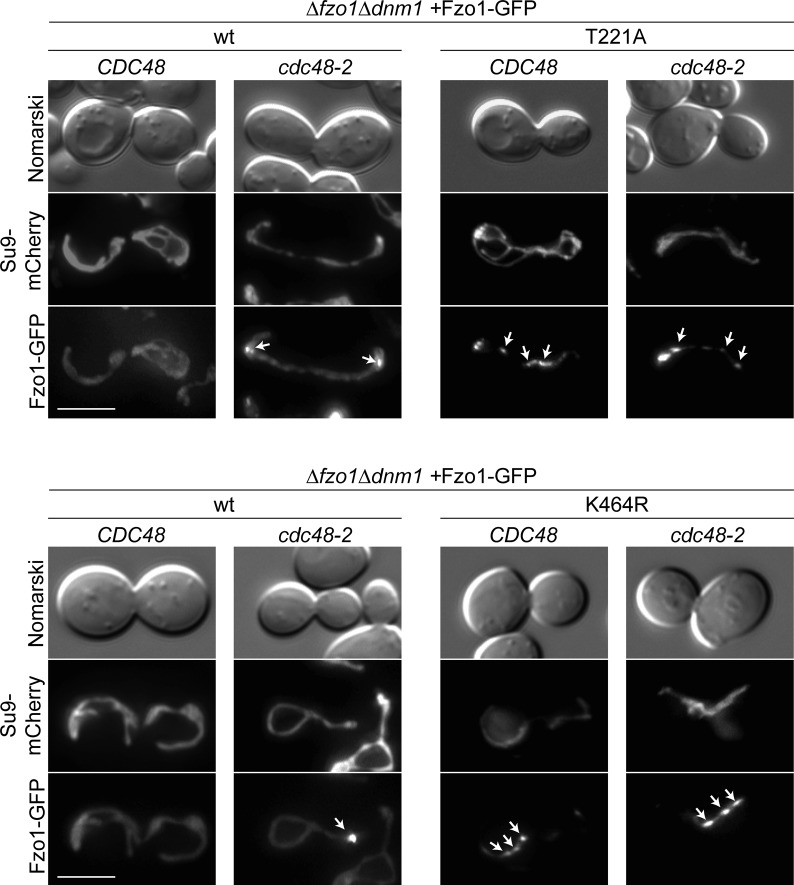
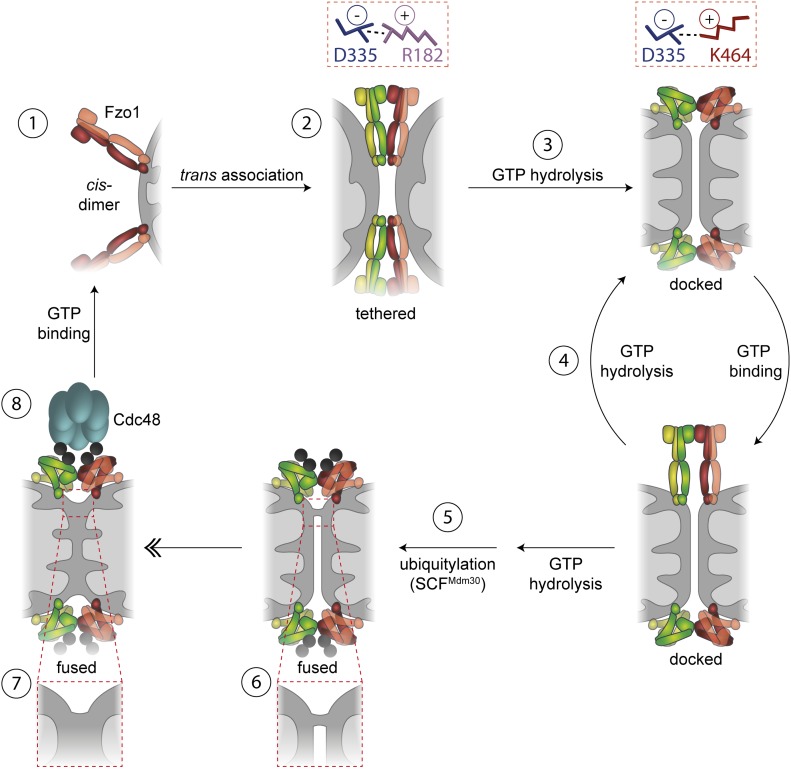
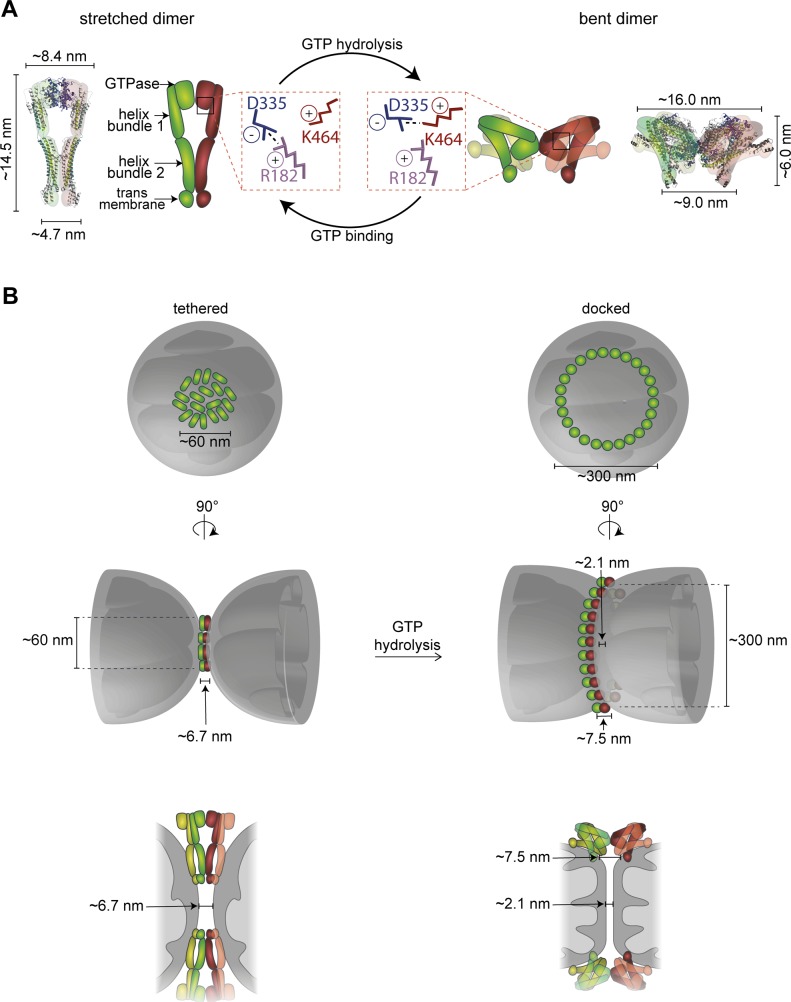
Mitofusins are dynamin-related GTPases that drive mitochondrial fusion by sequential events of oligomerization and GTP hydrolysis, followed by their ubiquitylation. Here, we show that fusion requires a trilateral salt bridge at a hinge point of the yeast mitofusin Fzo1, alternatingly forming before and after GTP hydrolysis. Mutations causative of Charcot-Marie-Tooth disease massively map to this hinge point site, underlining the disease relevance of the trilateral salt bridge. A triple charge swap rescues the activity of Fzo1, emphasizing the close coordination of the hinge residues with GTP hydrolysis. Subsequently, ubiquitylation of Fzo1 allows the AAA-ATPase ubiquitin-chaperone Cdc48 to resolve Fzo1 clusters, releasing the dynamin for the next fusion round. Furthermore, cross-complementation within the oligomer unexpectedly revealed ubiquitylated but fusion-incompetent Fzo1 intermediates. However, Cdc48 did not affect the ubiquitylated but fusion-incompetent variants, indicating that Fzo1 ubiquitylation is only controlled after membrane merging. Together, we present an integrated model on how mitochondrial outer membranes fuse, a critical process for their respiratory function but also putatively relevant for therapeutic interventions.


Conflict of interest statement

The authors declare that the research was conducted in the absence of any commercial or financial relationships that could be construed as a potential conflict of interest.

Figures

Figure 1.
Figure 1.. Fzo1 ubiquitylation is not sufficient for mitochondrial fusion.
(A) Crystal structure models of Fzo1. Left: stretched dimer. Fzo1 modelled on MFN1-MGD bound to GDP-BeF3 and BDLP bound to GMPPNP. Right: bent dimer. Fzo1 modelled on GDP-AlF4-bound MFN1-MGD and GDP-bound BDLP. Zoom-ins show residues proposed to form a salt bridge, displayed as sticks. Bottom right: Linear representation of the domain structure of Fzo1. (B) wt Fzo1 is required on each fusion partner to mediate fusion. Left: experimental setup of the mating assay for mitochondrial fusion. FZO1 and mtGFP or mtRFP are expressed under the control of the repressible GAL1 promoter in the two mating types a and α. Right: quantification of the fusion capacity after transcriptional repression by glucose, in budded or unbudded mated partners of ∆fzo1 cells expressing the indicated Fzo1 variants. Three independent experiments were quantified (with more than 30 budded or unbudded events each), including mean (bars), median (lines), and individual experiments (circles, squares, and triangles). (C) Intermolecular cross talk rescues ubiquitylation in Fzo1K464R and Fzo1T221A. Crude mitochondrial extracts from ∆fzo1 cells expressing the indicated variants of Flag-Fzo1 and HA-Fzo1 were solubilized and analyzed by SDS–PAGE and immunoblotting using HA-specific antibodies. Unmodified and ubiquitylated forms of HA-Fzo1 are indicated by a black arrowhead or black arrows, respectively. Ubiquitylated forms of Fzo1 are labeled with Ub. (D) Fzo1 mutants permissive to its ubiquitylation fail to rescue mitochondrial fusion. Analysis of mitochondrial tubulation in ∆fzo1 cells expressing the indicated Flag- or HA-tagged variants of Fzo1, co-expressing a mitochondrial-targeted mCherry plasmid. Cellular (Nomarski) and mitochondrial (mCherry) morphology were visualized by fluorescence microscopy. Three independent experiments were quantified (with more than 200 cells each), including mean (bars), median (lines), and individual experiments (circles, squares, and triangles). Scale bar: 5 μm. fl, full length; MGD, minimal GTPase domain; PoS, PonceauS staining; TM, transmembrane domain; HRN/HR1/HR2, heptad repeats.
Figure S1.
Figure S1.. Role of the conserved lysine 464 for Fzo1 functionality.
(A) Mitochondrial morphology in yeast and mouse cells. Cells genomically expressing HA-Fzo1 were analyzed as in Fig 1D. Scale bar: 5 μm. MEF Mfn2−/− knockout cells were transfected with the indicated Mfn2 variants. Mitochondrial morphology of at least 75 fixed cells was analyzed using MitoTracker (red). Nuclei were visualized using DAPI (blue). Mfn2-Flag expression was visualized using Flag-specific antibodies (green). Scale bar: 10 μm. (B) Multiple sequence alignment (Clustal Omega [Sievers et al, 2011]) of salt bridge residues in Saccharomyces cerevisiae Fzo1, Drosophila melanogaster Fzo, and Marf and Homo sapiens MFN1 and MFN2 (top). Hinge region of the Fzo1-MGD (bottom, left) and MFN2-MGD (bottom, right) structural models based on MFN1-MGD bound to GDP-BeF3 (PDB ID 5YEW, bottom, center) (Yan et al, 2018). (C) Mitochondrial morphology (top left), ubiquitylation (top right), and respiratory capacity (bottom) of ∆fzo1 cells expressing indicated HA-Fzo1 variants, as indicated in Fig 1. (D) Ubiquitylation of indicated HA-Fzo1 variants expressed in wt or Δfzo1 cells, as in Fig 1C. (E) Schematic representation of mitochondrial fusion during mating of cells of opposite mating type (“a”: BY4741 and “α”: BY4742) and subsequent zygote formation. (F) Example yeast cells from the in vivo mating assay, scored as “fused” or “not fused.” Scale bar: 5 μm. (G) Quantification of mitochondrial morphology of Δfzo1 cells expressing the indicated HA-Fzo1 and Flag-Fzo1 variants, co-expressing a mitochondrial-targeted mCherry plasmid, analyzed as in Fig 1D. PoS, PonceauS staining.
Figure S2.
Figure S2.. Identification of critical residues in Fzo1.
(A) D335 is required for Fzo1 functionality. Mitochondrial morphology (left), respiratory capacity (middle), and ubiquitylation (right) of ∆fzo1 cells expressing the indicated HA-Fzo1 variants, as indicated in Fig 1. (B) Stringent requirement of an asparagine at position 335. Quantification of mitochondrial morphology as in Fig 1D of ∆fzo1 cells expressing the wt or mutant variants of HA-Fzo1D335, as indicated. (C) R182 and K464 cannot be exchanged. Quantification of mitochondrial morphology as in Fig 1D (left) and ubiquitylation as in Fig 1B (right) of ∆fzo1 cells expressing HA-Fzo1 wt or mutant variants. (D, E) Salt bridge charge swap with D338 and either R182 in (D) or K464 in (E). Indicated mutations of Fzo1 were expressed in ∆fzo1 cells and Fzo1 ubiquitylation analyzed as in Fig 1B. In (E), a BY4741 (left) or W303 (right) background were used. PoS, PonceauS staining. (F) In vitro analysis of mitochondrial contact sites. Mitochondria were purified from ∆fzo1 cells expressing HA-Fzo1R182E or HA-Fzo1K464D or from ∆fzo1 ugo1-2 cells expressing HA-Fzo1, HA-Fzo1R182E, or HA-Fzo1K464D and analyzed by TEM. Engaged contact sites, meaning tethering (blue arrows) plus docking events (red arrows) we quantified. Loose contact sites were not regarded for quantification (black arrows) Scale bar: 300 nm (left). At least 1,000 mitochondria were quantified (right), including mean (bars) and individual experiments (circles, squares, and triangles).
Figure 2.
Figure 2.. Double salt bridge swaps block mitochondrial fusion.
(A) Alternation of D335 positioning. Fzo1-MGD modelled on MFN1 bound to GDP-BeF3 (left) and GDP-AlF4 (right) and corresponding distance predictions between all charged ends of D335 and either R182 or K464, resulting in either four or two measurements, respectively. (B, C) Single charge swaps do not rescue mitochondrial fusion. Mitochondrial morphology of ∆fzo1 cells expressing the indicated HA-Fzo1 variants, co-expressing a mitochondrial-targeted GFP plasmid, analyzed as in Fig 1D. Scale bar: 5 μm. (D) In vitro analysis of mitochondrial docking sites. Mitochondria were purified from ugo1-2 cells (left) or from ∆fzo1 ugo1-2 cells expressing HA-Fzo1, HA-Fzo1K464D, HA-Fzo1R182E (middle), or HA-Fzo1R182D (right) and analyzed by TEM for docked events. Mitochondrial tethering was performed in the presence of 1 mM GTPγS or mitochondria were treated with 0.5 μg/ml trypsin before tethering, as indicated (left). At least 900 (left), 1,000 (middle), or 650 (right) mitochondria from two independent experiments were quantified, as described in Fig S2F, including mean (bars) and individual experiments (circles and squares). Example of a mitochondrial docking event (far right). Scale bar: 100 nm.
Figure 3.
Figure 3.. Triple salt bridge swap rescues mitochondrial fusion.
(A, D) Fusion is rescued by a double positive charge swap in (A) but not by the presence of neutral amino acids in (D). Mitochondrial morphology and quantification of ∆fzo1 cells expressing the indicated Fzo1 variants, co-expressing a mitochondrial-targeted GFP plasmid, analyzed as in Fig 1D. Scale bar: 5 μm. (B, C) Triple salt bridge swap between residues in positions 182, 335, and 464 rescues Fzo1 ubiquitylation in (B) and fusion capacity in (C). The indicated Fzo1 mutant variants were analyzed for ubiquitylation as in Fig 1B and for fusion capacity as in Fig 1D. PoS, PonceauS staining.
Figure 4.
Figure 4.. Fusion-incompetent ubiquitylated Fzo1 is insensitive to Cdc48.
(A, B) Ubiquitylation of the indicated HA-tagged Fzo1 mutant variants, expressed in wt and cdc48-2 cells in (A) or in ∆fzo1 and ∆fzo1cdc48-2 cells in (B). Total cell extracts were prepared and analyzed by SDS–PAGE and immunoblotting, using HA-specific antibodies. (C) Analysis of Cdc48-Fzo1 co-immunoprecipitation. The indicated HA-Fzo1 variants were expressed in Δfzo1 cells. Crude mitochondrial extracts were solubilized, subjected to co-immunoprecipitation, and analyzed by SDS–PAGE and Western blot using HA- and Cdc48-specific antibodies. (D) Localization of indicated Fzo1-GFP variants, expressed in ∆fzo1∆dnm1 and ∆fzo1∆dnm1cdc48-2 cells. Fzo1-GFP was co-expressed with Su9-mCherry. Fzo1-GFP foci were quantified as shown in Fig S3 in at least 100 cells showing a tubular mitochondrial network, including mean (bars) and individual experiments (circles, squares, and triangles). PoS, PonceauS staining.
Figure S3.
Figure S3.. Analysis of Fzo1-GFP foci.
Representative pictures of Fzo1-GFP foci (white arrows) present in the yeast cells scored in Fig 4D. Scale bar: 5 μm.
Figure 5.
Figure 5.. Integrated model for mitochondrial OM fusion.
Model for OM fusion. GTP-bound Fzo1 dimers localize at the OMM (1). Fzo1 trans association leads to formation of the tethering complex, which depends on dynamic salt bridge interactions (2). GTP hydrolysis shifts the salt bridge from R182 to K464 and thereby drives conformational changes on Fzo1 (3) eventually promoting membrane curvature and formation of the docked stage. Recurring cycles of GTP binding and hydrolysis (4) allow membrane approximation and ubiquitylation of Fzo1 by SCFMdm30 (5), eventually allowing local lipid merging (6), which rapidly expands for complete fusion of the two OMs (7). After membrane merging, Fzo1 ubiquitylation is controlled by Cdc48, possibly leading to complex disassembly (8).
Figure S4.
Figure S4.. Model of mitochondrial tethering.
(A) Schematic model of Fzo1 subunits in stretched (left) and constricted (right) conformation, highlighting the triparty salt bridge. Fzo1 was modelled on BDLP bound to GMPPNP (left) and GDP (right). Size estimations were calculated using PyMol. (B) Integration of the dimensions of the mitofusin structural models (Low & Lowe, 2006; Low et al, 2009; Qi et al, 2016; Cao et al, 2017; Yan et al, 2018) into the in organello–observed distances between the OM in tethered and docked mitochondria (Brandt et al, 2016). Top view (top) and 90° tilted side view (middle) of schematic model of distribution of protein-dense structures on OMM. Bottom: Schematic model of Fzo1 complexes localizing to the mitochondrial fusion site.

References

    1. Anton F, Dittmar G, Langer T, Escobar-Henriques M (2013) Two deubiquitylases act on mitofusin and regulate mitochondrial fusion along independent pathways. Mol Cell 49: 487–498. 10.1016/j.molcel.2012.12.003 - DOI - PubMed
    1. Anton F, Fres JM, Schauss A, Pinson B, Praefcke GJ, Langer T, Escobar-Henriques M (2011) Ugo1 and Mdm30 act sequentially during Fzo1-mediated mitochondrial outer membrane fusion. J Cell Sci 124: 1126–1135. 10.1242/jcs.073080 - DOI - PubMed
    1. Barbullushi K, Abati E, Rizzo F, Bresolin N, Comi GP, Corti S (2019) Disease modeling and therapeutic strategies in CMT2A: State of the art. Mol Neurobiol 56: 6460–6471. 10.1007/s12035-019-1533-2 - DOI - PubMed
    1. Bodnar N, Rapoport T (2017) Toward an understanding of the Cdc48/p97 ATPase. F1000Res 6: 1318 10.12688/f1000research.11683.1 - DOI - PMC - PubMed
    1. Brandner A, De Vecchis D, Baaden M, Cohen MM, Taly A (2019) Physics-based oligomeric models of the yeast mitofusin Fzo1 at the molecular scale in the context of membrane docking. Mitochondrion 26: S1567–7249–0. 10.1016/j.mito.2019.06.010 - DOI - PubMed

Publication types

MeSH terms

LinkOut - more resources