. 2019 Dec 3;116(49):24662-24667.
doi: 10.1073/pnas.1821387116. Epub 2019 Nov 18.

Pervasive decreases in living vegetation carbon turnover time across forest climate zones

Affiliations

Pervasive decreases in living vegetation carbon turnover time across forest climate zones

Kailiang Yu et al. Proc Natl Acad Sci U S A. .

Abstract

Forests play a major role in the global carbon cycle. Previous studies on the capacity of forests to sequester atmospheric CO2 have mostly focused on carbon uptake, but the roles of carbon turnover time and its spatiotemporal changes remain poorly understood. Here, we used long-term inventory data (1955 to 2018) from 695 mature forest plots to quantify temporal trends in living vegetation carbon turnover time across tropical, temperate, and cold climate zones, and compared plot data to 8 Earth system models (ESMs). Long-term plots consistently showed decreases in living vegetation carbon turnover time, likely driven by increased tree mortality across all major climate zones. Changes in living vegetation carbon turnover time were negatively correlated with CO2 enrichment in both forest plot data and ESM simulations. However, plot-based correlations between living vegetation carbon turnover time and climate drivers such as precipitation and temperature diverged from those of ESM simulations. Our analyses suggest that forest carbon sinks are likely to be constrained by a decrease in living vegetation carbon turnover time, and accurate projections of forest carbon sink dynamics will require an improved representation of tree mortality processes and their sensitivity to climate in ESMs.

Keywords: carbon cycle; carbon turnover; forest carbon stocks; forest productivity; tree mortality.


Conflict of interest statement

The authors declare no competing interest.

Figures

Fig. 1.
Fig. 1.
Long-term forest plot data ranging from 1955 to 2018 over at least 3 censuses across tropical (n = 128), temperate (n = 87), and cold climate zones (n = 480) in South and North America and Europe. The forest climate zones are defined based on Köppen–Geiger climate classification.
Fig. 2.
Fig. 2.
Living vegetation carbon turnover time decreases across forest climate zones as observed by forest plot data. Temporal trend of growth (in kilograms per square meter per year), carbon stock (in kilograms per square meter), carbon loss (in kilograms per square meter per year), and aboveground living vegetation carbon turnover time (in years) quantified by forest plot data ranging from 1955 to 2018 over at least 3 censuses across tropical (n = 128), temperate (n = 87), and cold (n = 480) climate zones. Data were natural log-transformed before analysis. Temporal trends were quantified by linear mixed-effect models accounting for each plot in each forest climate zone as a random effect. The y axes are coefficients of the independent variable (time) ± 95% CIs. Coefficient estimate of each variable refers to proportional change per year when data are log-transferred. Percent change per year in each variable was quantified as follows: (exp (β) – 1) * 100, where β is the coefficient estimate.
Fig. 3.
Fig. 3.
ESMs show a pervasive decrease of historical living vegetation carbon turnover time across forest climate zones but with large cross-model differences. (A) Historical (1971 to 2005) and future (2006 to 2100) temporal trends in living vegetation carbon turnover time across forest climate zones quantified by the 8 ESMs (CanESM2, CCSM4, GFDL-ESM2G, HadGEM2-ES, IPSL-CM5A-MR, MIROC-ESM, MPI-ESM-LR, NorESM1-M) from phase 5 of the Coupled Model Intercomparison Project (CMIP5). Temporal trends were quantified by linear mixed-effect models accounting for pixel in each forest climate zone as a random effect. Data were natural log-transformed before analysis. The y axes are the minimum, mean, and maximum of the temporal trends in the 8 ESMs. (B) Coefficient of variance quantified as the ratio of the SD to the absolute value of mean across the 8 ESMs in CMIP5 while predicting historical and future temporal trends in loge-transformed values of NPP and living vegetation carbon turnover time across forest climate zones. (C) Global patterns of historical (1971 to 2005) percent change of living vegetation carbon turnover time quantified by the ensemble mean of the 8 ESMs in CMIP5. Percent change is quantified as an increase or reduction (percentage) per year relative to initial value at year 1971. The temporal trend was quantified by a linear regression model and expressed as coefficient of the independent variable (time).
Fig. 4.
Fig. 4.
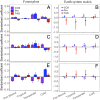
The decrease in living vegetation carbon turnover time across forest climate zones is primarily associated with CO2 fertilization. (A, C, and E) Standardized response coefficients between CO2, precipitation (Prn), temperature (TAS), and growth (A), carbon loss (C), and aboveground living vegetation carbon turnover time (E) quantified for forest plot data using linear mixed models. The y axes are coefficients of each independent variable ± 95% CIs. (B, D, and F) Standardized response coefficients between CO2, Prn, and TAS and NPP (B), carbon loss (D), and living vegetation carbon turnover time (F) for 8 ESMs using linear mixed models. The y axes are minimum, mean, and maximum coefficients of each independent variable in 8 ESMs. The data for NPP, carbon stock, carbon loss, and living vegetation carbon turnover time were natural log-transformed before analysis in both forest plot data and ESMs.

References

    1. Bonan G. B., Forests and climate change: Forcings, feedbacks, and the climate benefits of forests. Science 320, 1444–1449 (2008). - PubMed
    1. Heimann M., Reichstein M., Terrestrial ecosystem carbon dynamics and climate feedbacks. Nature 451, 289–292 (2008). - PubMed
    1. Cramer W., et al. , Global response of terrestrial ecosystem structure and function to CO2 and climate change: Results from six dynamic global vegetation models. Glob. Change Biol. 7, 357–373 (2001).
    1. Friedlingstein P., et al. , Climate-carbon cycle feedback analysis: Results from the C4MIP model intercomparison. J. Clim. 19, 3337–3353 (2006).
    1. Sitch S., et al. , Evaluation of the terrestrial carbon cycle, future plant geography and climate-carbon cycle feedbacks using five Dynamic Global Vegetation Models (DGVMs). Glob. Change Biol. 14, 2015–2039 (2008).

Publication types