. 2019 Nov 18;10(1):4990.
doi: 10.1038/s41467-019-13018-3.

Inhibition of DNA damage response at telomeres improves the detrimental phenotypes of Hutchinson-Gilford Progeria Syndrome

Affiliations

Inhibition of DNA damage response at telomeres improves the detrimental phenotypes of Hutchinson-Gilford Progeria Syndrome

Julio Aguado et al. Nat Commun. .

Abstract

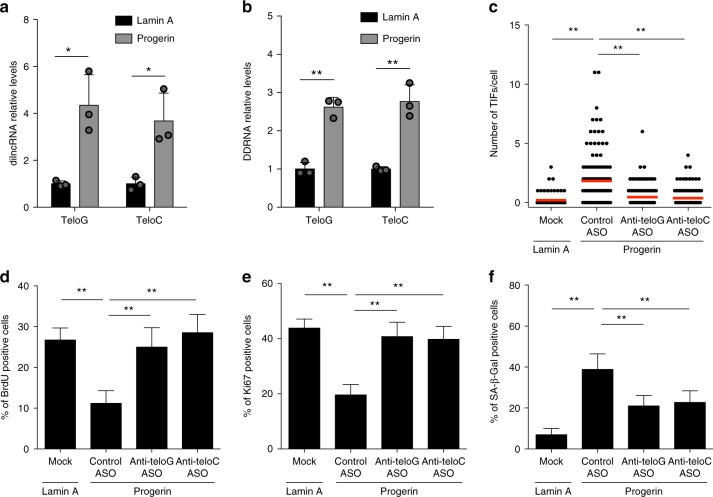
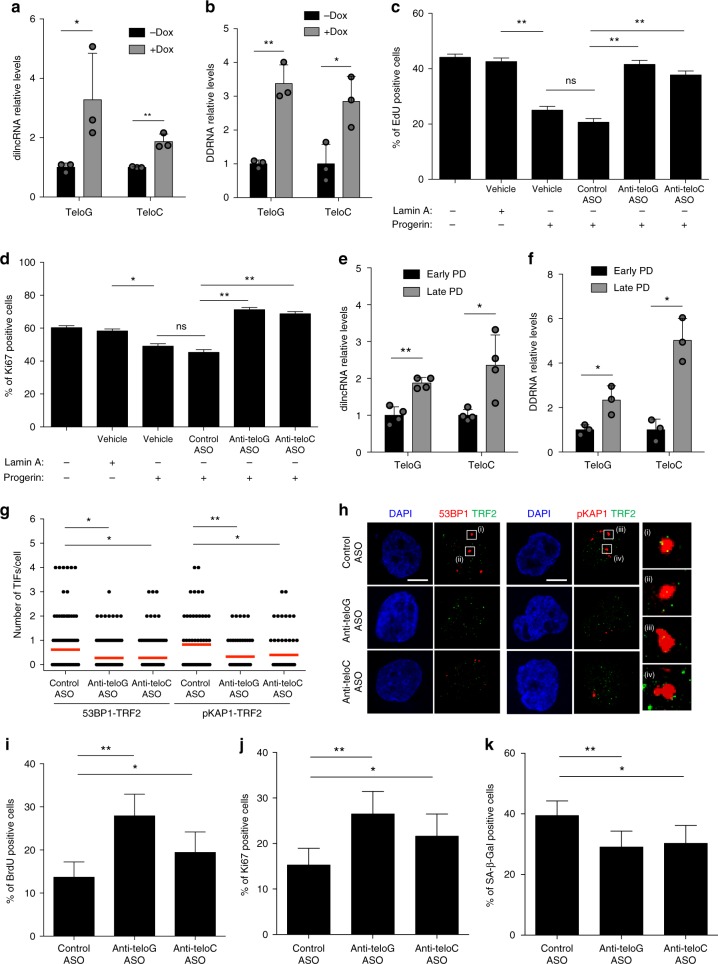
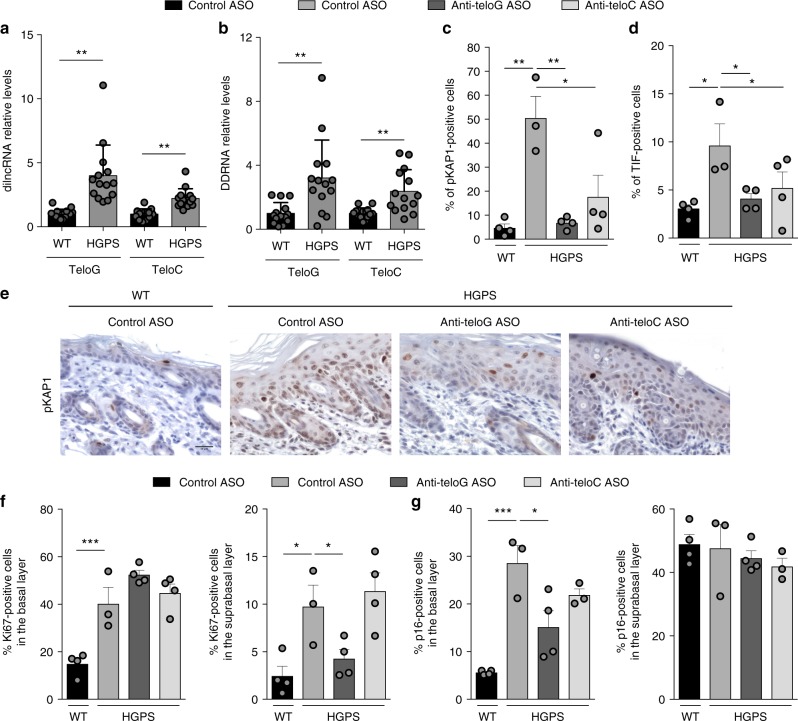
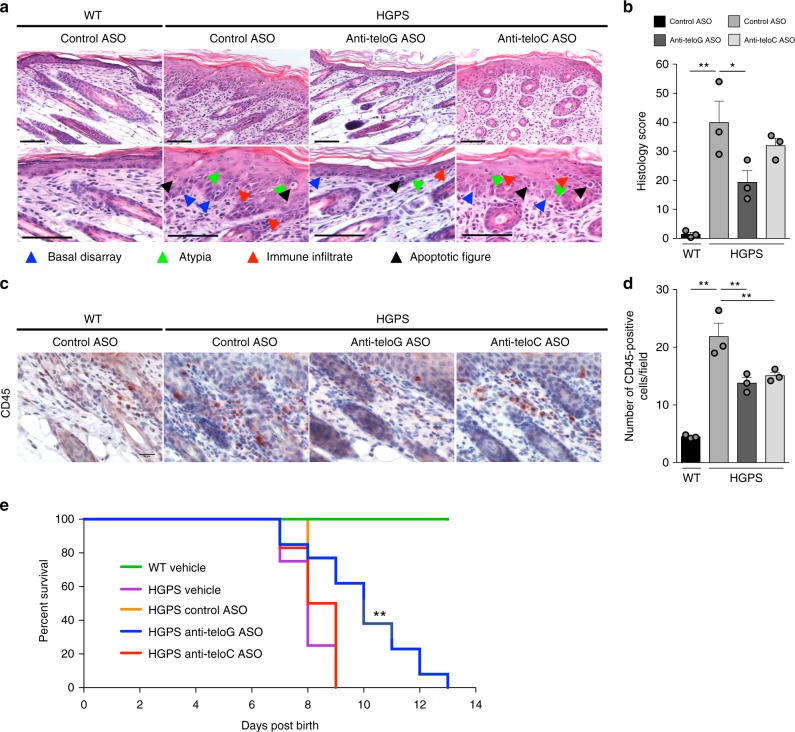
Hutchinson-Gilford progeria syndrome (HGPS) is a genetic disorder characterized by premature aging features. Cells from HGPS patients express progerin, a truncated form of Lamin A, which perturbs cellular homeostasis leading to nuclear shape alterations, genome instability, heterochromatin loss, telomere dysfunction and premature entry into cellular senescence. Recently, we reported that telomere dysfunction induces the transcription of telomeric non-coding RNAs (tncRNAs) which control the DNA damage response (DDR) at dysfunctional telomeres. Here we show that progerin-induced telomere dysfunction induces the transcription of tncRNAs. Their functional inhibition by sequence-specific telomeric antisense oligonucleotides (tASOs) prevents full DDR activation and premature cellular senescence in various HGPS cell systems, including HGPS patient fibroblasts. We also show in vivo that tASO treatment significantly enhances skin homeostasis and lifespan in a transgenic HGPS mouse model. In summary, our results demonstrate an important role for telomeric DDR activation in HGPS progeroid detrimental phenotypes in vitro and in vivo.


Conflict of interest statement

F.R. and F.d’A.d.F. are inventors on the patent applications PCT/EP2013/059753 and PCT/EP2016/068162. C.J.-W. and J.A. are inventors on the patent application PCT/EP2016/068162. Some activities were supported by BiovelocITA. All other authors declare no competing interests.

Figures

Fig. 1
Fig. 1
Inhibition of progerin-induced tncRNAs reduces proliferative defects and cellular senescence. a, b Total cell RNA was purified from human fibroblasts transduced with a retroviral vector expressing either lamin A or progerin. a tdilncRNAs were quantified by strand-specific RT-qPCR. Error bars represent s.d., n = 3 independent experiments. *P < 0.05; two-tailed Student’s t test. b tDDRNAs were quantified by miScript PCR amplification of gel-extracted small RNAs (shorter than 40 nucleotides). Error bars represent s.d., n = 3 independent experiments. **P < 0.01; two-tailed Student’s t test. c Human fibroblasts were transfected with the indicated ASOs and 24 h later transduced with a retroviral vector expressing either lamin A or progerin. Fixed cells were stained for 53BP1 and TRF2 to quantify telomere dysfunction-induced foci (TIFs) as determined by 53BP1 co-localizing with TRF2. n = 3 independent experiments. **P < 0.01; one-way ANOVA with multiple-comparison post-hoc corrections. At least 100 cells per sample were analyzed. df Cells from experiments shown in c were pulsed with BrdU for 8 h and stained for BrdU (d), Ki67 (e), and SA-β-Gal activity (f). Bar graphs show the percentage of positive cells ± 95% confidence interval. n = 3 independent experiments. **P < 0.01; Chi-squared test. Source data are provided as a Source Data file
Fig. 2
Fig. 2
Low levels of progerin expression and lamin A G608G mutation cause telomeric dilncRNAs and DDRNAs accumulation and their inhibition reduces proliferative defects and cellular senescence. a, b Total cell RNA was isolated from human fibroblasts carrying a doxycycline (Dox)-inducible progerin lentiviral-based system. a tdilncRNAs were quantified by strand-specific RT-qPCR. Error bars represent s.d., n = 3 independent experiments. *P < 0.05, **P < 0.01; two-tailed Student’s t test. b tDDRNAs were quantified by miScript PCR amplification of gel-extracted small RNAs (shorter than 40 nucleotides). Error bars represent s.d., n = 3 independent experiments. *P < 0.05, **P < 0.01; two-tailed Student’s t test. c, d Lamin A, Progerin-expressing, and control normal dermal fibroblasts (NDF) were transfected with the indicated ASOs. After 9 days cells were pulsed with EdU for 8 h and stained for EdU (c) and Ki67 (d). Bar graphs show the percentage of EdU and Ki67-positive cells ± 95% confidence interval. n = 3 independent experiments. **P < 0.01; Chi-squared test. At least 1000 cells per sample were analyzed. e, f Total cell RNA was isolated from HGPS patient-derived cells at early and late population doubling (PD). e tdilncRNAs were quantified as in a. Error bars represent the s.d. n = 4 independent experiments. *P < 0.05, **P < 0.01; two-tailed Student’s t test. f tDDRNAs were quantified as in b. Error bars represent the s.d. n = 3 independent experiments. *P < 0.05; two-tailed Student’s t test. g Late PD HGPS patient fibroblasts were transfected with the indicated ASOs and stained for 53BP1 or pKap1 (red) and TRF2 (green) to quantify TIFs. Co-localization analysis was assessed as in Fig. 1c. n = 3 independent experiments. *P < 0.05; one-way ANOVA with multiple-comparison post-hoc corrections. At least 100 cells per sample were analyzed. h Representative stack images from quantifications shown in g. Scale bars, 10 μm. ik HGPS patient fibroblasts from the experiment shown in g were pulsed with BrdU for 24 h prior to fixation and stained for BrdU (i), Ki67 (j), and SA-β-Gal activity (k). Bar graphs show the percentage of BrdU, Ki67, and SA-β-Gal-positive cells ± 95% confidence interval. n = 3 independent experiments. *P < 0.05, **P < 0.01; Chi-squared test. At least 300 cells per sample were analyzed. Source data are provided as a Source Data file
Fig. 3
Fig. 3
A mouse skin model of HGPS shows increased levels of tncRNAs and their inhibition in vivo reduces DDR activation and cellular senescence. a, b Total cell RNA was isolated from the skin of wild type (WT) and HGPS mice at post natal days 3 to 8. a tdilncRNAs were quantified by strand-specific RT-qPCR. Error bars represent the s.d. n = 14 mice per group. **P < 0.01; two-tailed Student’s t test. b tDDRNAs were quantified by miScript PCR amplification of gel-extracted small RNAs (shorter than 40 nucleotides). Error bars represent the s.d. n = 14 mice per group. **P < 0.01; two-tailed Student’s t test. cg Mice subjected to systemic delivery of the indicated ASOs were sacrificed at post natal day 6 and skin samples were stained for DDR and proliferation markers. Mouse skin sections were immunohistochemically stained for pKAP1 (c, e) and positive cells were quantified in the epidermis. Scale bar, 50 μm. d Mouse skin sections were stained for pKAP1 and TRF1 to quantify telomere dysfunction-induced foci (TIFs) as determined by pKAP1 co-localizing with TRF1 in the basal layer of the skin. A cell was counted as positive if showing at least one TIF. n = 3 independent experiments. **P < 0.01; one-way ANOVA with multiple-comparison post-hoc corrections. At least 300 cells per sample were analyzed. Quantification of Ki67 (f) and p16 (g) positive cells in the supra basal and basal layers of epidermis. Error bars represent the s.d. n = 3–4 mice per group. *P < 0.05, **P < 0.01, ***P < 0.001; one-way ANOVA with multiple-comparison post-hoc corrections. At least 300 cells per sample were analyzed. Source data are provided as a Source Data file
Fig. 4
Fig. 4
Systemic delivery of tASOs in a mouse skin model of HGPS reduces skin inflammation and degeneration and extends maximal and mean animal survival. ad Mice subjected to systemic delivery of the indicated ASOs were sacrificed at post natal day 6 for histopathological characterization. a Hematoxylin and eosin stained skin sections of mice treated with the indicated ASOs. Scale bars, 100 μm. b Histopathology scores represent the cumulative analysis of the individual parameters shown in Supplementary Fig. 4b–f. Error bars represent the s.d. *P < 0.05, **P < 0.01; one-way ANOVA with multiple-comparison post-hoc corrections. c Mouse skin sections were immunohistochemically stained for CD45. Scale bar, 50 μm. d Quantifications of images shown in c. Error bars represent the s.d. **P < 0.01; one-way ANOVA with multiple-comparison post-hoc corrections. Color scales are assigned as for b. e Kaplan–Meier curve of wild type (WT) mice treated with vehicle (n = 16) and progerin-expressing mice treated with vehicle (n = 8), control (n = 4), anti-teloG (n = 13), or anti-teloC ASOs (n = 7). **P < 0.01. Kaplan–Meier survival analysis. Source data are provided as a Source Data file

References

    1. De Sandre-Giovannoli A, et al. Lamin a truncation in Hutchinson-Gilford progeria. Science. 2003;300:2055. - PubMed
    1. Eriksson M, et al. Recurrent de novo point mutations in lamin A cause Hutchinson–Gilford progeria syndrome. Nature. 2003;423:293–298. - PMC - PubMed
    1. Goldman RD, et al. Accumulation of mutant lamin A causes progressive changes in nuclear architecture in Hutchinson–Gilford progeria syndrome. Proc. Natl Acad. Sci. USA. 2004;101:8963–8968. - PMC - PubMed
    1. Bridger JM, Kill IR. Aging of Hutchinson–Gilford progeria syndrome fibroblasts is characterised by hyperproliferation and increased apoptosis. Exp. Gerontol. 2004;39:717–724. - PubMed
    1. Scaffidi P, Misteli T. Lamin A-dependent misregulation of adult stem cells associated with accelerated ageing. Nat. Cell Biol. 2008;10:452–459. - PMC - PubMed

Publication types