. 2019 Nov 18;9(1):17009.
doi: 10.1038/s41598-019-53582-8.

The molecular genealogy of sequential overlapping inversions implies both homologous chromosomes of a heterokaryotype in an inversion origin

Affiliations

The molecular genealogy of sequential overlapping inversions implies both homologous chromosomes of a heterokaryotype in an inversion origin

Dorcas J Orengo et al. Sci Rep. .

Abstract

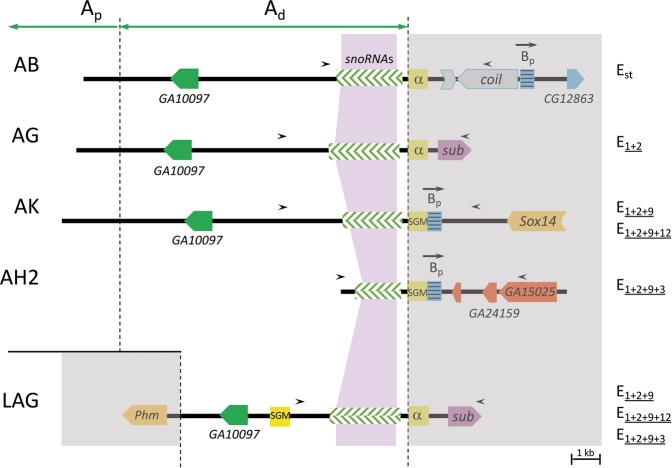
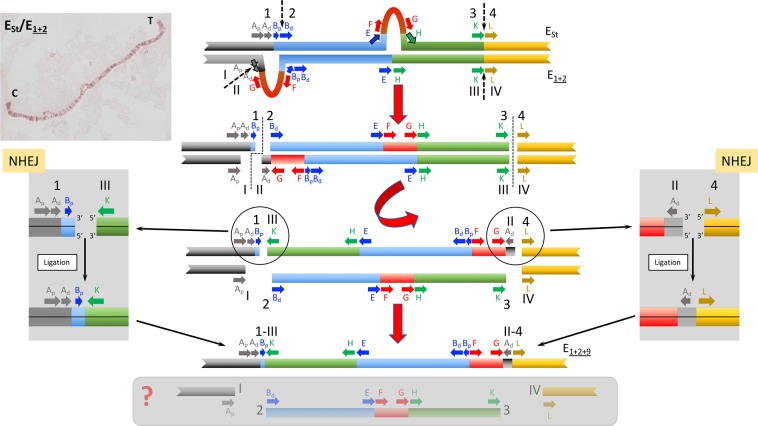
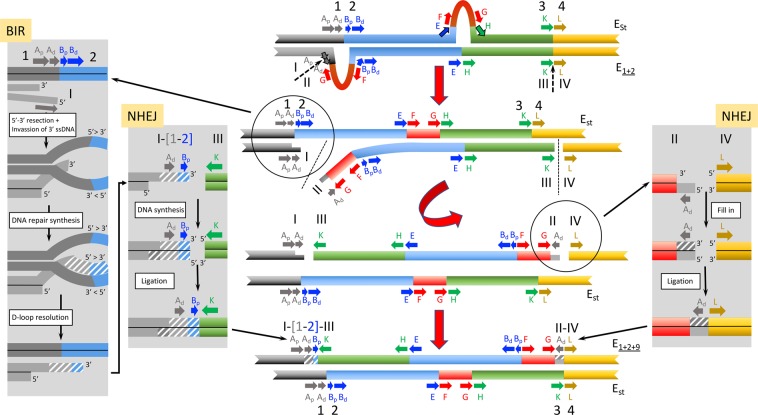
Cytological and molecular studies have revealed that inversion chromosomal polymorphism is widespread across taxa and that inversions are among the most common structural changes fixed between species. Two major mechanisms have been proposed for the origin of inversions considering that breaks occur at either repetitive or non-homologous sequences. While inversions originating through the first mechanism might have a multiple origin, those originating through the latter mechanism would have a unique origin. Variation at regions flanking inversion breakpoints can be informative on the origin and history of inversions given the reduced recombination in heterokaryotypes. Here, we have analyzed nucleotide variation at a fragment flanking the most centromere-proximal shared breakpoint of several sequential overlapping inversions of the E chromosome of Drosophila subobscura -inversions E1, E2, E9 and E3. The molecular genealogy inferred from variation at this shared fragment does not exhibit the branching pattern expected according to the sequential origin of inversions. The detected discordance between the molecular and cytological genealogies has led us to consider a novel possibility for the origin of an inversion, and more specifically that one of these inversions originated on a heterokaryotype for chromosomal arrangements. Based on this premise, we propose three new models for inversions origin.


Conflict of interest statement

The authors declare no competing interests.

Figures

Figure 1
Figure 1
Schematic representation of chromosomal arrangements Est, E1+2, E1+2+9, E1+2+9+3, and E1+2+9+12 of Drosophila subobscura. Inversions originating these arrangements are indicated by crossed lines. Breakpoint regions including the A fragment that is shared by various inversions are highlighted. The cytological location of these breakpoints on the Kunze-Mühl and Müller map is given. Ap and Ad refer, respectively, to the proximal and distal section of the A fragment (see text). The Ad section was duplicated when inversion E9 originated. Not at scale.
Figure 2
Figure 2
Functional annotation of breakpoint regions spanning fragment A. Annotation extracted from our previous work,. Breakpoint regions are named as in Fig. 1 except for the GAL region that is here presented in reverse orientation (and therefore named LAG) to facilitate its comparison with the other regions. Chromosomal arrangements presenting each breakpoint region are indicated on the rightmost part of the figure. Ap and Ad refer, respectively, to the proximal and distal sections of the A part (see text). Small black arrowheads indicate the location of amplification primers. The sequenced A fragment at each breakpoint is rose shadowed. Bp refers to the proximal fragment of the ancestral B part of the Est arrangement with the arrow indicating its orientation relative to the breakpoint. Colored arrowed boxes represent protein-coding regions. Green-striped boxes represent the presence of multiple snoRNA genes. SGM indicates an SGM element. α indicates an alpha element exhibiting some similarity to the SGM element.
Figure 3
Figure 3
Neighbor-joining tree of the A fragment sequences corresponding to the breakpoint regions of different E chromosomal arrangements. Bootstrap values >70% (based on 1000 replicates) are shown on the tree. Positions with over 5% alignment gaps, missing data, or ambiguous bases were not considered. D. guanche was used as outgroup.
Figure 4
Figure 4
Schematic representation of the NHEJ-4-chromosome model for the origin of inversion E9. The sequential steps of how arrangement E1+2+9 could have originated from an Est/E1+2 heterokaryotypic individual through inversion E9 are graphically represented in the central part of the figure. Fragments flanking the different breakpoint regions are labeled as in Fig. 1. Initial state: pairing of the E homologous chromosomes of an Est/E1+2 heterokaryotypic individual with discontinuous arrows indicating the location of future breaks. Parts flanking future breaks are labeled in Est and E1+2 homologues by ordinal numbers and roman numerals, respectively. Upper left corner inset, image of an Est/E1+2 polytene chromosome preparation. First step: a total of four breaks considering both homologous chromosomes, with the two breaks in the proximal region occurring at different sites in both homologues —between sections Bp and Bd of the Est homologue and between sections Ap and Ad of the E1+2 homologue—, and those in the distal region (KL) occurring at the same site. Discontinuous lines indicate the location of breaks. Second step: inversion of the central fragment of the E1+2 homologue and resolution of the double-strand breaks. Insets on both sides of the central scheme highlight the resolution phase. Final state: result of the inversion process with the generation of the E1+2+9 arrangement. Also shown within a grey-shaded box are the chromosomal fragments that might have resulted —highlighted by a question mark,?— in an evolutionary unsuccessful arrangement.
Figure 5
Figure 5
Schematic representation of the NHEJ-3-chromosome model for the origin of inversion E9. The sequential steps of how arrangement E1+2+9 could have originated from an Est/E1+2 heterokaryotypic individual through inversion E9 are graphically represented in the central part of the figure. Fragments flanking the different breakpoint regions are labeled as in Fig. 1. Initial state: pairing of the E homologous chromosomes of an Est/E1+2 heterokaryotypic individual with discontinuous arrows indicating the location of future breaks. Parts flanking breakpoints are labeled as in Fig. 4. First step: a total of three breaks considering both homologous chromosomes, with the two breaks in the proximal region occurring at different sites in both homologues —between sections Bp and Bd of the Est homologue and between sections Ap and Ad of the E1+2 homologue—, and that in the distal region (KL) occurring at the E1+2 homologue. Discontinuous lines indicate the location of breaks. Second step: inversion of the central fragment of the E1+2 homologue and resolution of the double-strand breaks. Insets on both sides of the central scheme highlight the resolution phase. Final state: result of the inversion process with the generation of the E1+2+9 arrangement. Also shown within a grey-shaded box are the chromosomal fragments that might have resulted —highlighted by a question mark,?— in an Est chromosome lacking sections Ad and Bp.
Figure 6
Figure 6
Schematic representation of the BIR-NHEJ-chromosome model for the origin of inversion E9. The sequential steps of how arrangement E1+2+9 could have originated from an Est/E1+2 heterokaryotypic individual through inversion E9 are graphically represented in the central part of the figure. Fragments flanking the different breakpoint regions are labeled as in Fig. 1. Initial state: pairing of the E homologous chromosomes of an Est/E1+2 heterokaryotypic individual with discontinuous arrows indicating the location of future breaks. Parts flanking breakpoints are labeled as in Fig. 4. First step: two breaks in the E1+2 homologue, with that in the proximal region occurring between sections Ap and Ad, and that in the distal region occurring between the K and L parts of the KL breakpoint region. Discontinuous lines indicate the location of breaks. Second step: inversion of the central fragment of the E1+2 homologue and resolution of the double-strand break of the proximal region through the BIR pathway and that of the distal region through the NHEJ mechanism. Insets on both sides of the central scheme highlight the different steps of the BIR and NHEJ pathways, respectively. Final state: result of the inversion process with the generation of the E1+2+9 arrangement. Also shown is the Est chromosome that did not undergo any break.

References

    1. Sturtevant AH. A Case of rearrangement of genes in Drosophila. Proc. Natl. Acad. Sci. USA. 1921;7:235–237. doi: 10.1073/pnas.7.8.235. - DOI - PMC - PubMed
    1. Painter TS. A new method for the study of chromosome rearrangements and the plotting of chromosome maps. Science. 1933;78:585–586. doi: 10.1126/science.78.2034.585. - DOI - PubMed
    1. Krimbas, C. B. & Powell, J. R. Drosophila inversion polymorphism. (CRC Press, 1992).
    1. Coluzzi M, Petrarca V, Di Deco MA. Chromosomal inversion intergradation and incipient speciation in Anopheles gambiae. Bolletino di Zool. 1985;52:45–63. doi: 10.1080/11250008509440343. - DOI
    1. Gupta JP, Kumar A. Cytogenetics of Zaprionus indianus Gupta (Diptera: Drosophilidae): Nucleolar organizer regions, mitotic and polytene chromosomes and inversion polymorphism. Genetica. 1987;74:19–25. doi: 10.1007/BF00055090. - DOI

Publication types