. 2019 Nov 18;9(1):16947.
doi: 10.1038/s41598-019-52598-4.

Novel Small Molecules Targeting the Intrinsically Disordered Structural Ensemble of α-Synuclein Protect Against Diverse α-Synuclein Mediated Dysfunctions

Affiliations

Novel Small Molecules Targeting the Intrinsically Disordered Structural Ensemble of α-Synuclein Protect Against Diverse α-Synuclein Mediated Dysfunctions

Gergely Tóth et al. Sci Rep. .

Abstract

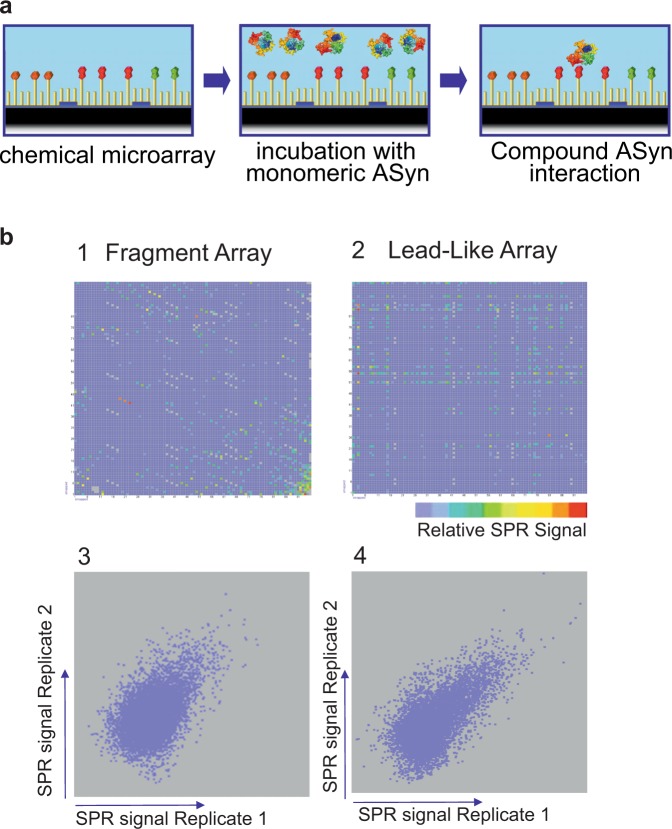
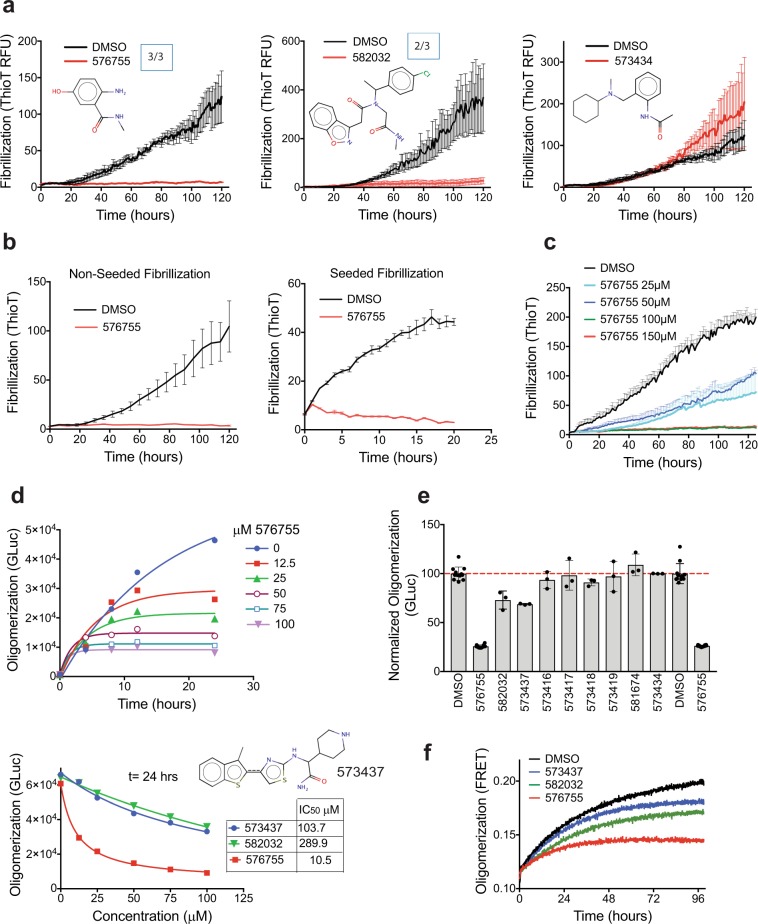
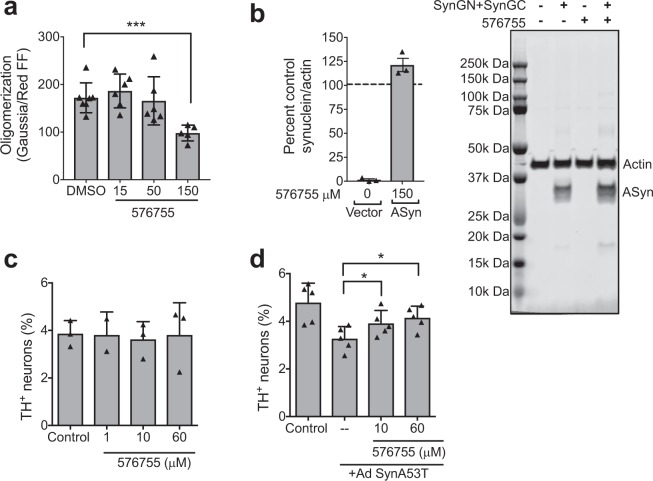
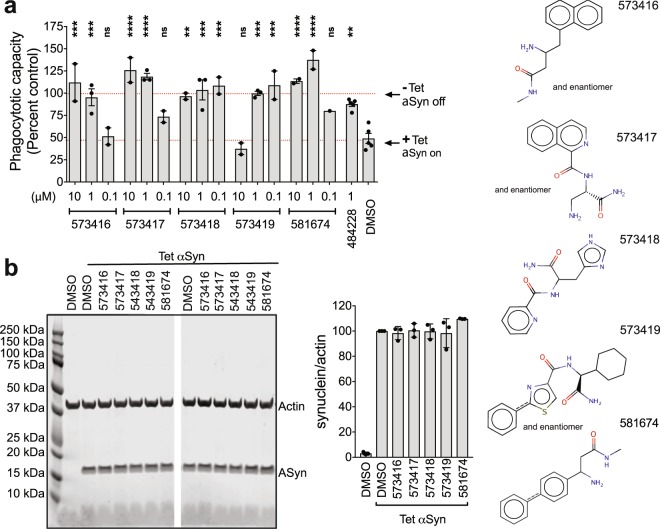
The over-expression and aggregation of α-synuclein (αSyn) are linked to the onset and pathology of Parkinson's disease. Native monomeric αSyn exists in an intrinsically disordered ensemble of interconverting conformations, which has made its therapeutic targeting by small molecules highly challenging. Nonetheless, here we successfully target the monomeric structural ensemble of αSyn and thereby identify novel drug-like small molecules that impact multiple pathogenic processes. Using a surface plasmon resonance high-throughput screen, in which monomeric αSyn is incubated with microchips arrayed with tethered compounds, we identified novel αSyn interacting drug-like compounds. Because these small molecules could impact a variety of αSyn forms present in the ensemble, we tested representative hits for impact on multiple αSyn malfunctions in vitro and in cells including aggregation and perturbation of vesicular dynamics. We thereby identified a compound that inhibits αSyn misfolding and is neuroprotective, multiple compounds that restore phagocytosis impaired by αSyn overexpression, and a compound blocking cellular transmission of αSyn. Our studies demonstrate that drug-like small molecules that interact with native αSyn can impact a variety of its pathological processes. Thus, targeting the intrinsically disordered ensemble of αSyn offers a unique approach to the development of small molecule research tools and therapeutics for Parkinson's disease.


Conflict of interest statement

Drs Agard and McConlogue are owners of Dainton Biosciences, LLC, which has rights to the described compounds. No other authors have competing interests.

Figures

Figure 1
Figure 1
HT-CM-SPR Screening of αSyn. (a) The HT-CM-SPR process: Monomeric αSyn analyte floats over the array surface in screening buffer to allow binding events to occur. SPR imaging enables the detection of binding events. (b) SPR Test Screening Results: The upper two panels show images of color coded SPR signals obtained during HT-CM-SPR of αSyn under optimized screening conditions against individual representative microarrays comprised of (1) a fragment microarray containing 3,070 fragments (out of 23,000 fragments present in the entire screened NovAliX chemical microarray library) spotted in triplicate along a diagonal and (2) a lead-like microarray of 9,216 lead-like compounds (out of 91,000 lead-like compounds present in the entire screened NovAliX chemical microarray library) individually spotted. The lead-like compounds are derived from combinatorial synthesis approaches with each row and column on the microarrays consisting of a common fragment in combination with 96 other diversities. In these fingerprint representations of the microarrays each spot is representative of a separate small molecule tethered to the array with the location on the chip reflected by the location on the fingerprint and the color representing the intensity of signal for that spot (color ranging from low shifts (blue) to high (red) signals). The lower panels 3 and 4 show reproducibility of duplicate screening experiments for chemical microarrays shown in panels 1 and 2. The reproducibility of these subsets of compounds is representative of results obtained for the entire NovAliX chemical microarray library with (3) triplicates of 3,070 fragments and for (4) individual 9,216 lead-like compounds immobilized. In these scatter plots, each spot compares the signal strength measured for the microarray samples in each of the independent array experiments with signals from one replicate experiment indicated on the Y-axis and that of the other experiment represented on the X-axis.
Figure 2
Figure 2
Multiple HT-CM-SPR screening hit compounds block αSyn misfolding. (a) The impact of compounds on αSyn fibrillization activity, monitored by thioflavin T fluorescence, is shown. Examples are shown of three independent experiments for compounds tested at 300 μM in the αSyn fibrillization assay along with 0.5% DMSO control. Boxed numbers indicate the ratio of experiments demonstrating significant impact. Statistical analyses, (see Supplementary Information) indicate significant differences (p-value < 0.05) from DMSO for 576755 in 3 out of the 3 shown experiments, and for 582032 in 2 out of 3 experiments. Compound 573434 has no impact on αSyn fibrillization in a biochemical assay. (b) Anti-fibrillization activity of compound 576755 at 300 μM is demonstrated in both the standard (left) and seeded-aggregation (right) assays in which αSyn protofibrils are added at the initiation of the assay. (c) A dose response for compound 576755 in the fibrillization assay shows activity as low as 25 μM. For all fibrillization figures each data point represents the mean ± SEM of quadruplicate wells. (d) Dose response of anti-oligomerization activity of three compounds are shown in a split Gaussia luciferase (GLuc) complementation assay executed as described in Methods. GLuc units are in arbitrary light units. The top panel shows the time course of inhibition by 576755 at multiple doses and the bottom panel shows the dose response and IC50s of all three active compounds at t = 24 hours. (e) The impact on oligomerization for all compounds discussed in this manuscript are shown. GLuc units are normalized to the mean of DMSO control. Means ± SD. are shown. (f) The anti-oligomerization activities of the three compounds identified in panel (d) are validated in a FRET based αSyn oligomerization assay executed as described in Methods. Compound structures are also shown in Supplementary Fig. S4.
Figure 3
Figure 3
Cellular activities of anti-aggregation compound 576755. (a) 576755 reduces αSyn oligomerization in H4 cells as measured by complementation of αSyn proteins with split luciferase tags executed as described in methods. Trace firefly luciferase co-transfected provides a normalization measure for transfection efficiency. 0.3% DMSO is present in all samples. Data are plotted as means +/− SD. Shown are representative results from 3 independent experiments. A reduction in cellular oligomerization by 576755 was determined by one-way ANOVA with Dunnett’s post-test. (b) 576755 does not reduce on αSyn levels in H4 cells as determined by Western analyses (trend towards small increase seen). (Right) representative Western from one experiment of a merged image detecting actin and αSyn from H4 cells transiently transfected with vector control or αSyn containing N or C terminal split luciferase tags (SynGN + SynGC) and treated with 0.3 percent DMSO or 150 µM 576755. The two αSyn bands correspond to different tags. Entire length of blot shown. Outline of full blot shown by black lines. (Left) αSyn was quantitated in 3 separate biological replicates. Samples were normalized to cells transfected with αSyn without drug treatment to allow comparisons between blots. There is no significant difference in αSyn levels in 576755 treated vs. untreated cells (100) as determined by one sample t test. Data are plotted as mean ± SD. (c) 576755 is not toxic and (d) alleviates loss of dopaminergic neurons induced by the A53T mutant of αSyn. Primary rat embryonic midbrain cultures were non-transduced or transduced with adenovirus encoding A53T αSyn (+Ad SynA53T), in the absence or presence of 576755. The cells were then stained immunocytochemically for MAP2 and TH. Preferential dopaminergic cell death was assessed by evaluating the percentage of MAP2-positive cells that also stained positive for TH. Data are plotted as the mean ± SEM. n = 2–3 for the neuron toxicity analysis and n = 5 for the reversal of αSyn toxicity. Shown are representative results from 5 independent experiments. Statistics used a one-way ANOVA with Tukey post-test after square root transformation of the data. *p < 0.05 where shown. ***p < 0.001. **** p < 0.0001. ns is not significant.
Figure 4
Figure 4
Multiple HT-CM-SPR screening hit compounds alleviate αSyn mediated inhibition of phagocytosis in H4-Neuroglioma cells. H4 neuroglioma cells over-expressing αSyn from a tetracycline-inducible promoter were cultured for 24 hours with compound in the absence or presence of αSyn induced by tetracycline. After 24 hours of induction cells were (a) fed 4 micron beads for 90 minutes and a phagocytic index was measured by quantitating the amounts of engulfed beads on an imaging reader or (b) analyzed by Western blot to determine αSyn levels. (a) The phagocytic capacity was calculated by normalizing the indicated samples to the phagocytic capacity of un-induced cells not overexpressing αSyn (Tet off). Each point corresponds to a separate experiment denoting the average of 6 well replicates. Means ± SD for the combined multiple experimental averages are shown. Control compound is 484228, identified in a prior in silico screen. n = 2 or 3 different experiments as shown. Significance was determined by ANOVA with Dunnet’s correction. *p < 0.05, ***p < 0.001, ****p < 0.0001. ns is not significant. (b) Cells were untreated or treated with tetracycline to induce αSyn and treated with DMSO or compounds and analyzed by Western blot for actin and αSyn levels. Left: Representative Western blots of merged actin and αSyn signals of individual wells treated with DMSO or compounds. Image cut as shown to remove irrelevant samples. Entire length of blot shown. Outline of full blot shown by black lines. Right: Westerns from multiple replicates were quantitated and the αSyn band intensity was normalized to that of actin. Each data point is a separate well. No compounds showed significant impact on αSyn levels. Compound structures are also shown in Supplementary Fig. S4.
Figure 5
Figure 5
One HT-CM-SPR screening hit compound blocks cell-to-cell transmission of αSyn. (a) The impact of 573434 on transmission was tested on co-cultured donor and recipient B103 neuroblastoma cells and mean percentage of receiving cells with αSyn is shown. The same data are shown separating all compound doses (left) or combining 100 and 150 µM (right). 3 coverslips/well per group, 10–15 pictures per coverslip, and 43–168 cell total per group were analyzed. Combined 100 and 150 µM drug samples give statistically significant differences from untreated by unpaired t test (n = 3). (b) Donor and acceptor primary neurons were cultured in separate chambers of a Transwell and αSyn in acceptor cells was measured after treatment with 573434 or 576755. Vector control is lentiviral vector not expressing αSyn. 10 and 100 µM 573434 retarded transmission whereas 576755 had no impact as determined by ANOVA with Dunnett’s correction. (c) Total αSyn levels were determined from the fluorescent intensity from αSyn antibody (arbitrary fluorescence units, AFU) in the images used in panel (a). 3 coverslips per group, 8–11 pictures per coverslip, and 24–54 cell total per group were analyzed. 573434 does not impact overall expression of αSyn as determined by unpaired t test. (d) Representative images of αSyn transmission in primary neurons treated with 573434 and 576755. (e) Cells and media produced by B103 cells infected with control or αSyn-lentivirus and treated with DMSO or 150 μM 573434 were analyzed by Western blot for actin and αSyn levels. Left: Western blot of both actin and αSyn proteins of duplicate wells. Image cut as shown to remove irrelevant samples. Entire length of blot shown. Outline of full blot shown by black lines. Right: the ratio of αSyn in the media to αSyn in the cell was quantitated from three separate experiments with duplicate wells (n = 6). αSyn levels in cells and media were normalized to actin levels in cells of that well and then further normalized to control (DMSO) sample on the same gel to allow for comparison between experiments. 573434 has no impact on the amount of αSyn secreted into the media. For all figures drug treated and control cells are in equivalent levels of DMSO (0.15 to 0.3%). Each symbol represents a singe coverslip in a unique well. Mean ± SD. *p < 0.05, ***p < 0.001, ****p < 0.0001, ns–not significant. Compound structure is also shown in Supplementary Fig. S4.

References

    1. Dawson TM, Dawson VL. Molecular pathways of neurodegeneration in Parkinson’s disease. Science. 2003;302:819–822. doi: 10.1126/science.1087753. - DOI - PubMed
    1. Spillantini MG, et al. Alpha-synuclein in Lewy bodies. Nature. 1997;388:839–840. doi: 10.1038/42166. - DOI - PubMed
    1. Braak H, et al. Staging of brain pathology related to sporadic Parkinson’s disease. Neurobiol Aging. 2003;24:197–211. doi: 10.1016/s0197-4580(02)00065-9. - DOI - PubMed
    1. Burre J, Sharma M, Sudhof TC. Definition of a molecular pathway mediating alpha-synuclein neurotoxicity. J Neurosci. 2015;35:5221–5232. doi: 10.1523/JNEUROSCI.4650-14.2015. - DOI - PMC - PubMed
    1. Polymeropoulos MH, et al. Mutation in the alpha-synuclein gene identified in families with Parkinson’s disease. Science. 1997;276:2045–2047. doi: 10.1126/science.276.5321.2045. - DOI - PubMed

Publication types

MeSH terms