. 2019 Dec;5(12):1237-1249.
doi: 10.1038/s41477-019-0547-0. Epub 2019 Nov 18.

Widespread long-range cis-regulatory elements in the maize genome

Affiliations

Widespread long-range cis-regulatory elements in the maize genome

William A Ricci et al. Nat Plants. 2019 Dec.

Erratum in

Abstract

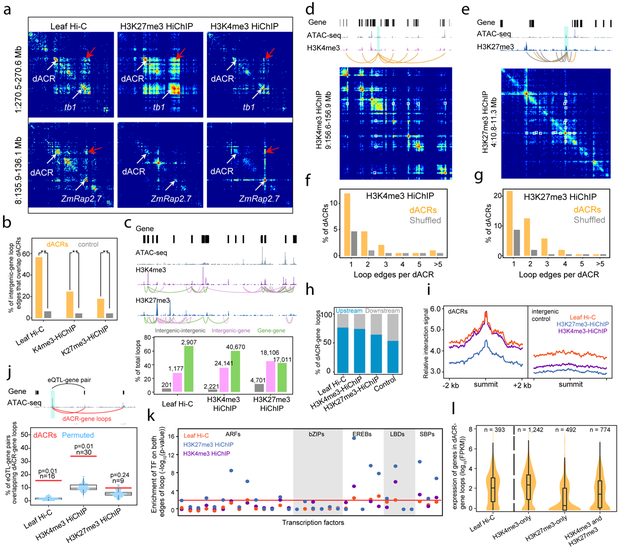
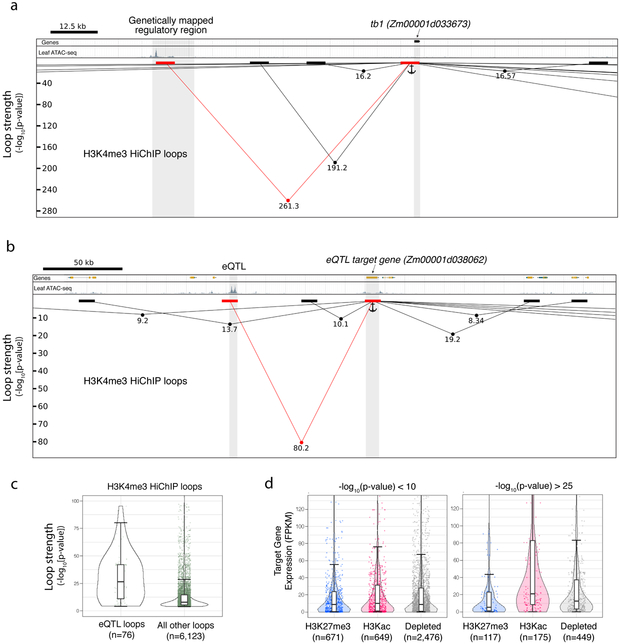
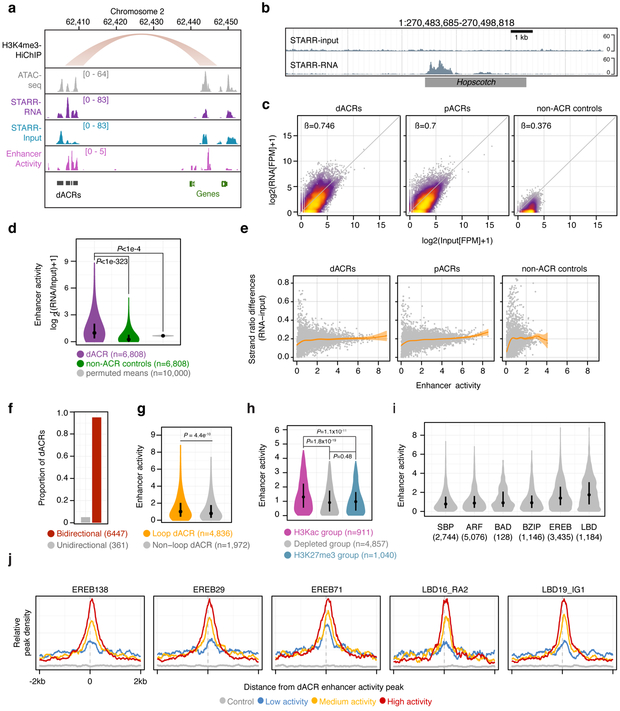
Genetic mapping studies on crops suggest that agronomic traits can be controlled by gene-distal intergenic loci. Despite the biological importance and the potential agronomic utility of these loci, they remain virtually uncharacterized in all crop species to date. Here, we provide genetic, epigenomic and functional molecular evidence to support the widespread existence of gene-distal (hereafter, distal) loci that act as long-range transcriptional cis-regulatory elements (CREs) in the maize genome. Such loci are enriched for euchromatic features that suggest their regulatory functions. Chromatin loops link together putative CREs with genes and recapitulate genetic interactions. Putative CREs also display elevated transcriptional enhancer activities, as measured by self-transcribing active regulatory region sequencing. These results provide functional support for the widespread existence of CREs that act over large genomic distances to control gene expression.


Figures

Fig. 1 ∣
Fig. 1 ∣. Accessible chromatin regions in the maize genome.
a, tb1 is expressed in immature inflorescences and silenced in leaves. The genetically mapped tb1 CRE (gray shaded area) displays tissue-dynamic chromatin accessibility and histone modifications. ATAC-seq and ChIP-seq experiments were performed in duplicate and yielded the same results both times. b, Genome-wide distribution of leaf ATAC-seq peaks in relation to the AGPv4.38 annotated genes. gACRs overlap genes; pACRs fall within 2,000 bp of genes; dACRs are > 2,000 bp from genes. c, Lengths of total ATAC-seq peaks. d, Distances of ATAC-seq peaks (excluding gACRs) from the closest annotated gene. e, GC content at each dACR versus gene-distal uniquely mapping negative control regions. f, Percentage of each class of ACR that overlap ≥ 1 DAP-seq TF peaks. g, Meta-analysis of DAP-seq peak signals for individual TFs at dACR summits. No replicates of this analysis were performed. h, Distribution of Arabidopsis-derived TF binding motifs at dACR summits. i, Number of total SNPs among maize inbred lines or j, phenotype-associated SNPs per 10 bp bins flanking dACR summits. For normalization of i and j, the negative control distribution was subtracted from the dACR distribution and the difference was plotted. k, Probability that a cis-eQTL's highest-significance SNP overlaps a dACR. Y-axis shows posterior probability. The center values correspond to the medians of the distributions. Figures e-k use the same set of negative control regions (i.e. uniquely mapping, intergenic, non-accessible regions).
Fig. 2 ∣
Fig. 2 ∣. Chromatin attributes of dACRs and patterns among dACR-flanking genes.
a, Meta-analysis of DNA methylation, ATAC-seq, ChIP-seq, and RNA-seq signals at transcription start sites (TSS) and termination sites (TTS) of annotated genes, ranked by expression. 2 kb upstream and downstream of TSS and TTS are included. Note that the bottom ~1/3 of ranked genes likely correspond to pseudogenes. b-g, Chromatin attributes at dACRs, aligned at dACR summits and clustered into four groups. Shown are +/− 2 kb from summits. ChIP-seq and RNA-seq experiments for a-g were performed in duplicate and yielded identical results each time. h, GO term enrichment for the nearest genes flanking the dACRs on both sides. p-values were determined with a two-sided hypergeometric test, as implemented in the BiNGO program (see methods). p-values were adjusted for multiple testing with Benjamini & Hochberg. Sample sizes were twice the number of dACRs in each chromatin group (since each dACR had two flanking genes). i, Expression Shannon entropy values and j, expression levels (TPM) of the nearest genes on both sides of each dACR. k, Percent of total leaf dACRs in each chromatin group that are present in leaves but absent from inflorescences (i.e., the leaf dACR does not overlap an inflorescence dACR). l, Among the genes flanking leaf-specific differential dACRs, the percent of first neighbor (primary) and second neighbor (secondary) genes that are differentially expressed, and m, the percent of differentially expressed genes for which the differential dACR occurs downstream or upstream of the gene's 5' end. All figures use the same set of negative control regions. For i, j, l, and m, percentages from genes flanking intergenic negative control regions were subtracted from the percentages of genes flanking dACRs.
Fig. 3 ∣
Fig. 3 ∣. Hi-C and HiChIP identify dACR-gene interactions.
a, Contact matrix heat maps showing the dACR-gene interactions at tb1 and ZmRap2.7. Red arrows indicate dACR-gene contacts. b, Percent of intergenic-gene loop edges overlapping dACRs. ** denotes denotes p<< 2.2e-16 (Fisher's exact test, two sided). Leaf Hi-C n = 1,177 total loops (within a single biological replicate), H3K4me3 HiChIP n = 24,141, and H3K27me3 HiChIP n = 18,106. c, Representative region containing various HiChIP loops (top panel) and called loop numbers from Hi-C and HiChIP experiments (bottom panel). d-e, Regions demonstrating dACR interaction hubs (dACR anchors in shaded blue regions). White squares in heat maps indicate loops. f-g, Percentages of dACRs involved in multiple dACR-gene loops, compared to a control of shuffled dACRs and loops. From a total 6,939 dACRs (excluding the transcribed group dACRs), 2,809 dACRs looped with >=1 genes in H3K4me3-HiChIP while 2,001 dACRs looped with >=1 genes in H3K27me3-HiChIP. h, The percentages of dACR-gene loops in which the dACR resides either upstream or downstream of the target gene's promoter. dACR-gene pairs which were not crossing gene(s) were used for the analysis. i, virtual 4C intrachromosomal interaction signals at dACR summits and flanking regions. j, Top panel: a representative eQTL-gene pair (black curve) connected with Hi-C/HiChIP loops (red curves). Bottom panel: the percent of eQTL-gene pairs that were connected by loops (red line), compared to genomic-distance-constrained dACR-gene random permutations (blue dots). P-values were determined by a two-sided permutation test (n=100). k, Enrichment of DAP-seq peaks of the same TF in both edges of the same loop (dACR-gene loops only). The Red line indicates a p-value of 0.01 (Fisher's exact test, two-sided). l, Expression of genes involved in different dACR-gene loops, separated by HiChIP loop type. n = the number of genes shown in the violin distribution. The box plot shows median and quartiles. For the Hi-C and HiChIP experiments in this figure, biological replicates were not performed.
Fig. 4 ∣
Fig. 4 ∣. Loop strength identifies specific CRE-gene regulatory interactions.
a, Genome browser shot of tb1 and its fine-mapped distal regulatory region. Chromatin loops are represented as lines with dots indicating −log10(p-value). Black and red blocks represent loop edges for all loops interacting with the tb1 locus (indicated as anchor). b, A similar browser shot as in a, but this time showing a genetically mapped eQTL and its predicted target gene. Figures a and b were not performed in replicate. c, The statistical significance of all H3K4me3 HiChIP loops which link dACR-overlapping eQTL to their target genes, versus all other dACR-gene H3K4me3 HiChIP loops. d, The expression of target genes at one edge of the loop and dACR at the other end of the loop, split into the three chromatin groups classified in fig. 2. Shown are loops at high and low −log10(p-value). Boxplots in c and d comprise a median with quartiles, with outliers above the top whiskers. All p-values shown in figures were determined in the FitHiChIP program utilizing a two-tailed binomial test.
Fig. 5 ∣
Fig. 5 ∣. Distal ACRs display elevated transcriptional enhancer capacity.
a, representative region showing a H3K4me3-HiChIP loop, ATAC-seq, RNA from STARR-seq, input from STARR-seq, and the estimated enhancer activity using the log2-transformed ratio of STARR-seq signal to input (RNA/input). b, STARR DNA input from a bacterial artificial chromosome (top track) and its corresponding RNA output (bottom track) at the Hopscotch positive control locus characterized by Studer et al (2011). c, STARR-RNA versus STARR-input fragments per million (FPM) across distal ACRs (dACRs, including H3Kac, depleted, and H3K27me3 group dACRs and excluding transcribed group dACRs; left panel), proximal ACRs (pACRs, middle panel), and intergenic control regions (right panel). Regression coefficients are from a generalised linear model. d, Distributions of enhancer activities (max log2[RNA/input] FPM) for dACRs (excluding the transcribed group) and matched control regions compared (Mann-Whitney; two-sided; P<10−323), and mean enhancer activities of permuted random mappable regions matched in length to dACRs (n=6,808 regions per iteration, n=10,000 Monte Carlo iterations). e, Absolute difference in strand ratios between STARR-RNA and STARR-input fragments for dACRs (left), pACRs (middle), and control regions (right) relative to enhancer activity. f, Proportion of dACRs with bidirectional and unidirectional activity determined by a betabinomial model. The number of dACRs are shown in parenthesis. g, Distribution of enhancer activities for dACRs coincident or non-coincident with HiChIP loop edges (Mann-Whitney; P<4.5×10⁻¹⁰). h, distribution of enhancer activities among the different dACR chromatin group classifications. Hypothesis tests were performed using Mann-Whitney. i, Distribution of enhancer activities overlapping binding site peaks of DAP-seq-profiled TF families. n = the number of dACRs containing DAP-seq peaks. j, Average density of DAP-seq peaks centered on enhancer activity summits within dACRs. dACRs are split by enhancer activity. The sample sizes used for metaplots in j were the same as in i. The STARR-seq experiment described in this figure was performed as a single biological replicate. Boxplots shown in d, g, h, and i comprise medians (black dots) and quartiles. Violin plots depict 0-99% of the entire distribution.

Comment in

References

References Cited in Main Text

    1. Shlyueva D, Stampfel G & Stark A Transcriptional enhancers: from properties to genome-wide predictions. Nat Rev Genet 15, 272–86 (2014). - PubMed
    1. Weber B, Zicola J, Oka R & Stam M Plant Enhancers: A Call for Discovery. Trends Plant Sci 21, 974–987 (2016). - PubMed
    1. Marand AP, Zhang T, Zhu B & Jiang J Towards genome-wide prediction and characterization of enhancers in plants. Biochim Biophys Acta Gene Regul Mech 1860, 131–139 (2017). - PubMed
    1. Wallace JG et al. Association mapping across numerous traits reveals patterns of functional variation in maize. PLoS Genet 10, e1004845 (2014). - PMC - PubMed
    1. Huang C et al. ZmCCT9 enhances maize adaptation to higher latitudes. Proc Natl Acad Sci U S A 115, E334–e341 (2018). - PMC - PubMed

References Cited in Methods Section Only

    1. Urich MA, Nery JR, Lister R, Schmitz RJ & Ecker JR MethylC-seq library preparation for base-resolution whole-genome bisulfite sequencing. Nat Protoc 10, 475–83 (2015). - PMC - PubMed
    1. Bartlett A et al. Mapping genome-wide transcription-factor binding sites using DAP-seq. Nat Protoc 12, 1659–1672 (2017). - PMC - PubMed
    1. Benfey PN & Chua NH The Cauliflower Mosaic Virus 35S Promoter: Combinatorial Regulation of Transcription in Plants. Science 250, 959–66 (1990). - PubMed
    1. Ow DW, Jacobs JD & Howell SH Functional regions of the cauliflower mosaic virus 35S RNA promoter determined by use of the firefly luciferase gene as a reporter of promoter activity. Proc Natl Acad Sci U S A 84, 4870–4 (1987). - PMC - PubMed
    1. Yoo SD, Cho YH & Sheen J Arabidopsis mesophyll protoplasts: a versatile cell system for transient gene expression analysis. Nat Protoc 2, 1565–72 (2007). - PubMed

Publication types

MeSH terms