. 2020 Feb;39(8):1797-1806.
doi: 10.1038/s41388-019-1106-x. Epub 2019 Nov 18.

BRF1 accelerates prostate tumourigenesis and perturbs immune infiltration

Affiliations

BRF1 accelerates prostate tumourigenesis and perturbs immune infiltration

Carolyn J Loveridge et al. Oncogene. 2020 Feb.

Erratum in

  • Correction: BRF1 accelerates prostate tumourigenesis and perturbs immune infiltration.
    Loveridge CJ, Slater S, Campbell KJ, Nam NA, Knight J, Ahmad I, Hedley A, Lilla S, Repiscak P, Patel R, Salji M, Fleming J, Mitchell L, Nixon C, Strathdee D, Neilson M, Ntala C, Bryson S, Zanivan S, Edwards J, Robson CN, Goodyear CS, Blyth K, Leung HY. Loveridge CJ, et al. Oncogene. 2020 Mar;39(11):2450. doi: 10.1038/s41388-019-1149-z. Oncogene. 2020. PMID: 31857667 Free PMC article.

Abstract

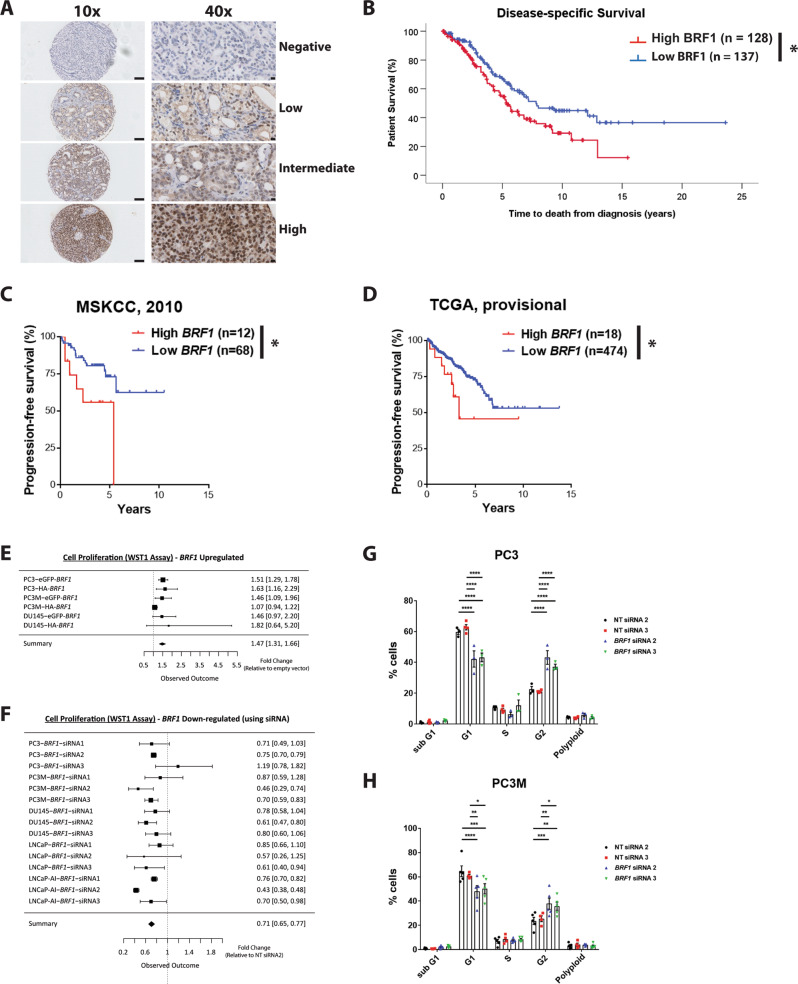
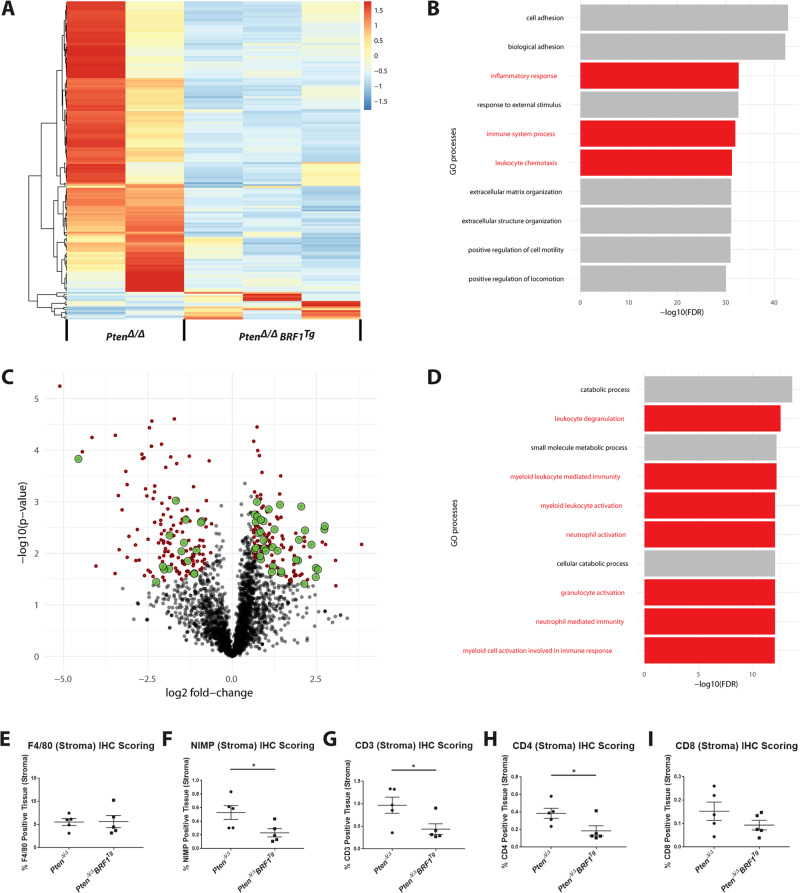
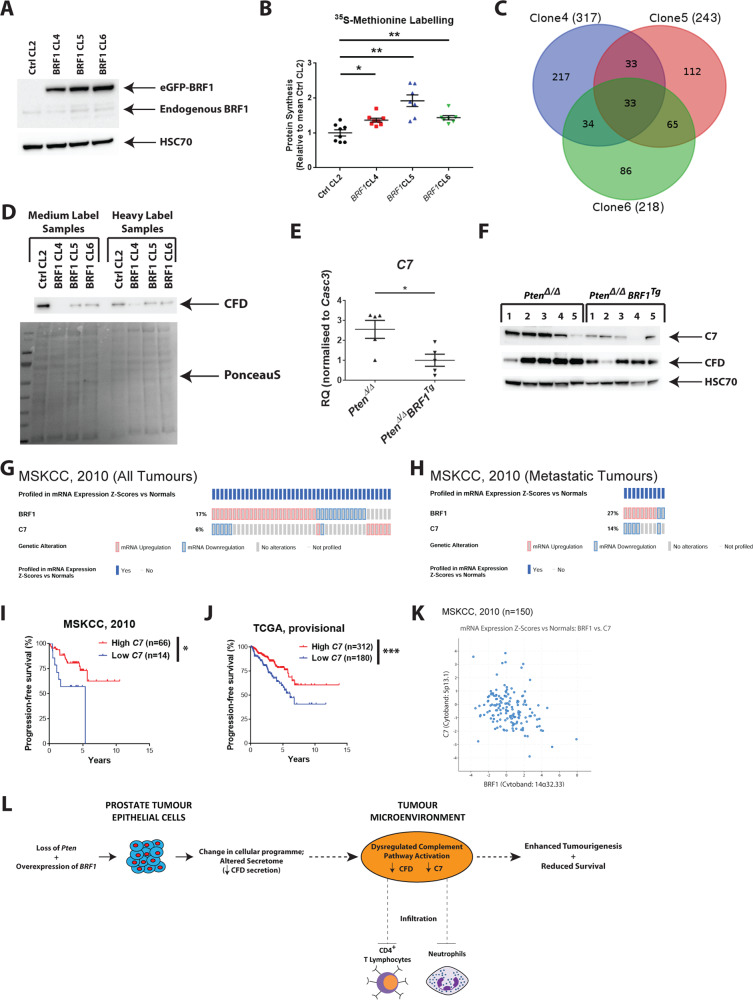
BRF1 is a rate-limiting factor for RNA Polymerase III-mediated transcription and is elevated in numerous cancers. Here, we report that elevated levels of BRF1 associate with poor prognosis in human prostate cancer. In vitro studies in human prostate cancer cell lines demonstrated that transient overexpression of BRF1 increased cell proliferation whereas the transient downregulation of BRF1 reduced proliferation and mediated cell cycle arrest. Consistent with our clinical observations, BRF1 overexpression in a Pten-deficient mouse (PtenΔ/Δ BRF1Tg) prostate cancer model accelerated prostate carcinogenesis and shortened survival. In PtenΔ/Δ BRF1Tg tumours, immune and inflammatory processes were altered, with reduced tumoral infiltration of neutrophils and CD4 positive T cells, which can be explained by decreased levels of complement factor D (CFD) and C7 components of the complement cascade, an innate immune pathway that influences the adaptive immune response. We tested if the secretome was involved in BRF1-driven tumorigenesis. Unbiased proteomic analysis on BRF1-overexpresing PC3 cells confirmed reduced levels of CFD in the secretome, implicating the complement system in prostate carcinogenesis. We further identify that expression of C7 significantly correlates with expression of CD4 and has the potential to alter clinical outcome in human prostate cancer, where low levels of C7 associate with poorer prognosis.


Conflict of interest statement

The authors declare that they have no conflict of interest.

Figures

Fig. 1
Fig. 1
BRF1 is a prognostic marker in prostate cancer and mediates effects on cellular proliferation and the cell cycle in vitro. a Example images of PCa cores stained for BRF1 with varying Histoscores: negative (score 0), low (score 125), intermediate (score 175) or high (score 300). Higher magnification images show finer detail of staining from the same cores. Scale bars are shown (100 µm for lower magnification images; 10 µm for higher magnification images). b Kaplan–Meier plot for disease-specific survival of PCa patients stratified according to low (below median histoscore; n = 128) versus high (above median histoscore; n = 137) expression of BRF1 within PCa cohort. c Kaplan–Meier plot for progression-free survival of patients in MSKCC (2010) dataset segregated for low and high BRF1 expression as indicated in oncoprint in Fig. S1c. d Kaplan–Meier plot for progression-free survival of patients in TCGA (provisional) dataset segregated for low and high BRF1 expression as indicated in oncoprint in Fig. S1d. Log-rank (Mantel–Cox) Test was performed to compare survival curves; *p < 0.05. e Forest plot summarising WST1 cell proliferation assay results from PC3, PC3M and DU145 (all n = 3) cells which were transiently transfected with HA-BRF1, GFP-BRF1 and their respective HA- and GFP-empty vector controls for 48 h. f Forest plot summarising WST1 cell proliferation assay results from PC3 (n = 4), PC3M, DU145, LNCaP and LNCaP AI (all n = 3) cells which were transiently transfected with three independent siRNAs for BRF1 and control non-targeting (NT) siRNA for 48 h. In presented Forest plots in e and f, each box represents the sample mean [relative to empty vector (e) or control NT siRNA (f)]; error bars represent 95% confidence intervals; the centre of the diamond in summary line represents the collective sample mean; the width of the diamond represents the 95% confidence interval for the collective sample mean. PC3 (g) and PC3M (h) cells were transiently transfected with two independent siRNAs for BRF1 and two different control NT siRNAs for 72 h then subjected to bromodeoxyuridine (BrdU)- and propidium iodide (PI)-labelling followed by flow cytometry analysis to determine cell cycle positions. Data presented are from n = 3 (PC3 cells: NT siRNA 2; BRF1 siRNA’s 2 and 3), n = 4 (PC3 cells: NT siRNA 3; PC3M cells: NT siRNA 3) or n = 5 (PC3M cells: NT siRNA 2; BRF1 siRNA’s 2 and 3) experiments. Individual data points are shown in the presented graphs; long horizontal lines indicate the Mean; error bars represent SEM; 2way ANOVA was used to calculate p values; *p < 0.05; **p < 0.01; ***p < 0.001; ****p < 0.0001 from NT siRNA 2 or 3
Fig. 2
Fig. 2
Double mutant PtenΔ/Δ BRF1Tg mice have reduced survival compared with PtenΔ/Δ mice. a Illustration of strategy for targeting overexpression of human BRF1 gene. The mouse Hprt genomic locus, the Hprt targeting vector (including the human BRF1 transgene) and the restored Hprt locus (with transgene inserted on 5’ side) are shown. b Representative micrographs of H + E and BRF1 IHC staining in anterior prostate tissue from WT and BRF1Tg mice (n = 5 for each genotype). Scale bars are shown (100 µm for all images). c Kaplan–Meier plot representing disease-specific survival of BRF1Tg (n = 12), PtenΔ/Δ (n = 12) and PtenΔ/Δ BRF1Tg (n = 14) mice. Log-rank (Mantel–Cox) Test was performed to compare PtenΔ/Δ and PtenΔ/Δ BRF1Tg survival curves; ****p < 0.0001. d Representative images of isolated prostates from PtenΔ/Δ and PtenΔ/Δ BRF1Tg mice that had reached clinical endpoint and a wild type (WT) mouse taken at an equivalent age (top panel). Isolated prostates from PtenΔ/Δ (n = 12) and PtenΔ/Δ BRF1Tg (n = 14) mice were weighed prior to removal of cystic fluid (termed Wet Weight), then were re-weighed to assess the solid tumour mass (termed Dry Weight) (bottom panel). e Whole-cell lysates prepared from prostate tumour tissue obtained from PtenΔ/Δ (n = 4) and PtenΔ/Δ BRF1Tg (n = 4) mice were subjected to SDS-PAGE, followed by western blotting using an anti-BRF1 antibody. HSP70 served as a loading control. f qPCR analysis of RNA isolated from prostate tumour tissue obtained from PtenΔ/Δ (n = 3) and PtenΔ/Δ BRF1Tg (n = 3) mice specifically for the human BRF1 transgene. Casc3 was used as a reference gene for normalisation. g Representative micrographs of H + E staining in anterior prostate tissue from PtenΔ/Δ and PtenΔ/Δ BRF1Tg mice (n = 5 for each genotype). Red box in lower magnification images in upper panel highlights region shown in higher magnification images in lower panel. Scale bars are shown (1 mm for upper panel images; 100 µm for bottom panel images). h Representative micrographs of BRF1, Ki67, Cleaved Caspase-3 and p21 IHC staining in anterior prostate tumour tissue from PtenΔ/Δ and PtenΔ/Δ BRF1Tg mice (n = 5 for each genotype). Yellow arrows highlight p21 staining. Scale bars are shown (100 µm for all images). i Scoring of p21 IHC staining. p21 IHC staining was analysed in 25 manually annotated areas of prostate tumour epithelium per slide from PtenΔ/Δ (n = 5) and PtenΔ/Δ BRF1Tg (n = 5) mice using HALO software (see methods). d, f, i Individual data points are shown in the presented graphs; long horizontal line indicates the Mean; error bars represent SEM; Welch’s t test (unpaired, 2 tailed) was used to calculate p value; *p < 0.05
Fig. 3
Fig. 3
Transcriptomics and proteomics reveal that immune system processes are significantly altered in PtenΔ/Δ BRF1Tg mice and infiltration of neutrophils and CD4 positive T lymphocytes is significantly reduced in PtenΔ/Δ BRF1Tg compared with PtenΔ/Δ mice. a Heatmap of RNA-Seq data. Presented are the 174 genes that are implicated in immune processes which have significantly altered expression (>1.5-fold change; p.adj < 0.05) between PtenΔ/Δ and PtenΔ/Δ BRF1Tg prostate tumours. Because of a technical problem, the library preparation step for one PtenΔ/Δ sample failed resulting in n = 2 for PtenΔ/Δ and n = 3 for PtenΔ/Δ BRF1Tg. In the heatmap, blue represents downregulation of gene expression (Row Z-Score < 0); red represents up-regulation of gene expression (Row Z-Score > 0). b Bar chart illustrating results of gene enrichment analysis from GeneGO MetaCore of RNA-Seq data – the top 10 significantly altered GO processes are shown; highlighted in red are those which relate to the immune response. c Volcano plot of proteomic data from comparison of PtenΔ/Δ (n = 4) and PtenΔ/Δ BRF1Tg (n = 3) prostate tumour samples. Highlighted in red are proteins whose abundance was found to be significantly (fold change > 1.5; p.adj < 0.05) altered between PtenΔ/Δ and PtenΔ/Δ BRF1Tg samples; amongst these significantly altered proteins, highlighted in green are those that related to the immune process GO term (Table S10). d Bar chart illustrating results of gene enrichment analysis from GeneGO MetaCore of proteomic data – the top 10 significantly altered GO processes are shown; highlighted in red are those which relate to the immune response. Analysis of IHC staining for F4/80 (e), NIMP (f), CD3 (g), CD4 (h) and CD8 (i). Total observable prostate stromal tissue per slide was manually annotated on each sample from PtenΔ/Δ (n = 5) and PtenΔ/Δ BRF1Tg (n = 5) mice for each marker then staining within these annotated areas was analysed using HALO software (see supplementary information). ei Individual data points are shown in the presented graphs; long horizontal line indicates the Mean; error bars represent SEM; Welch’s t test (unpaired, 2 tailed) was used to calculate p value; *p < 0.05
Fig. 4
Fig. 4
Complement pathway activation is (i) reduced when BRF1 is overexpressed in vitro, (ii) reduced in prostate tumours from PtenΔ/Δ BRF1Tg mice and (iii) inversely correlates with BRF1 expression in human PCa. a Western blotting of whole-cell lysates prepared from PC3 Ctrl CL2 and BRF1 CL4, 5 and 6 cells using anti-BRF1 antibody and HSC70 as a loading control. Blot shown is representative of three independent experiments. b Comparison of incorporation of 35S-methionine label, which was measured by scintillation counting, between PC3 stable clones (n = 3; 2-3 wells per clone were used per each individual experiment). Data from BRF1 CL4, 5 and 6 cells were normalised to the mean of PC3 Ctrl CL2 cells. Individual data points are shown in the presented graph; long horizontal line indicates the Mean; error bars represent SEM; Welch’s t test (unpaired, two tailed) with Bonferroni correction for multiple testing was used to calculate p.adj values; *p.adj < 0.05; **p.adj < 0.01. c Venn diagram outlining numbers of proteins that had >1.2-fold change in abundance in the same direction in PC3 BRF1 overexpressing clones CL4, 5 and 6 compared with Ctrl CL2. d Western blotting of purified secreted proteins prepared from PC3 Ctrl. CL2 and PC3 BRF1 overexpressing CL4, 5 and 6 using an anti-CFD antibody. PonceauS staining was used as a loading control. e qPCR analysis of isolated RNA prepared from prostate tumour tissue obtained from PtenΔ/Δ (n = 5) and PtenΔ/Δ BRF1Tg (n = 5) mice for C7. Casc3 was used as a reference gene for normalisation. Individual data points are shown in the presented graph; long horizontal line indicates the Mean; error bars represent SEM; Welch’s t test (unpaired, 2 tailed) was used to calculate p value; *p < 0.05. f Western blotting of whole-cell lysates prepared from prostate tumour tissue obtained from PtenΔ/Δ (n = 5) and PtenΔ/Δ BRF1Tg (n = 5) mice using anti-C7 and anti-CFD antibodies. HSC70 served as a loading control. Oncoprint from cBioPortal illustrating mRNA expression profile in BRF1 and C7 in all tumours (216 cases) (g) and metastatic tumours (37 cases) (h) in MSKCC (2010) prostate adenocarcinoma dataset. Kaplan–Meier plots for progression-free survival in MSKCC (2010) (i) and TCGA (provisional) (j) prostate adenocarcinoma datasets of patients segregated for low and high C7 expression as indicated in the Oncoprints presented in Fig. S8c, d, respectively. Log-rank (Mantel–Cox) Test was performed to compare survival curves; *p < 0.05; ***p < 0.001. k Scatter plot showing the correlation of C7 and BRF1 mRNA expression in MSKCC (2010) prostate adenocarcinoma dataset (n = 150; all tumours with mRNA expression data). Pearson correlation coefficient and p value for the comparison is stated in the main text. l Schematic summary of key observations as described in the main text

References

    1. Goodfellow SJ, Innes F, Derblay LE, MacLellan WR, Scott PH, White RJ. Regulation of RNA polymerase III transcription during hypertrophic growth. EMBO J. 2006;25:1522–33. doi: 10.1038/sj.emboj.7601040. - DOI - PMC - PubMed
    1. Arthurs C, Murtaza BN, Thomson C, Dickens K, Henrique R, Patel HRH, et al. Expression of ribosomal proteins in normal and cancerous human prostate tissue. PLoS ONE. 2017;12:e0186047. doi: 10.1371/journal.pone.0186047. - DOI - PMC - PubMed
    1. Uemura M, Zheng Q, Koh CM, Nelson WG, Yegnasubramanian S, De Marzo AM. Overexpression of ribosomal RNA in prostate cancer is common but not linked to rDNA promoter hypomethylation. Oncogene. 2012;31:1254–63. doi: 10.1038/onc.2011.319. - DOI - PMC - PubMed
    1. Zhang Y, Wu H, Yang F, Ning J, Li M, Zhao C, et al. Prognostic value of the expression of DNA repair-related biomarkers mediated by alcohol in gastric cancer patients. Am J Pathol. 2018;188:367–77. doi: 10.1016/j.ajpath.2017.10.010. - DOI - PMC - PubMed
    1. Zhong Q, Xi S, Liang J, Shi G, Huang Y, Zhang Y, et al. The significance of Brf1 overexpression in human hepatocellular carcinoma. Oncotarget. 2016;7:6243–54. doi: 10.18632/oncotarget.6668. - DOI - PMC - PubMed

Publication types

Substances