. 2020 Jan;17(1):73-78.
doi: 10.1038/s41592-019-0628-z. Epub 2019 Nov 18.

Time-resolved serial femtosecond crystallography at the European XFEL

Affiliations

Time-resolved serial femtosecond crystallography at the European XFEL

Suraj Pandey et al. Nat Methods. 2020 Jan.

Abstract

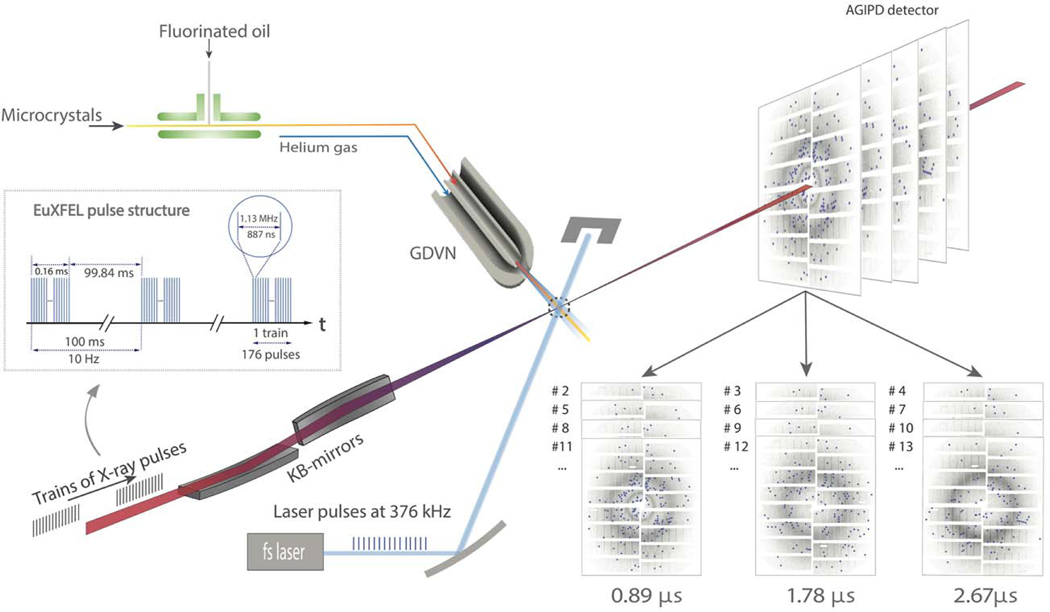
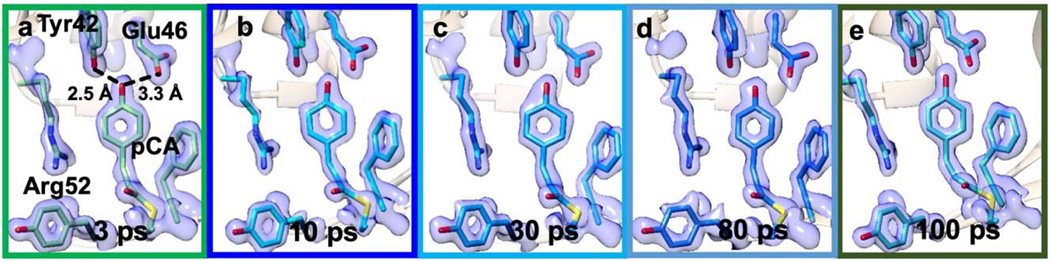
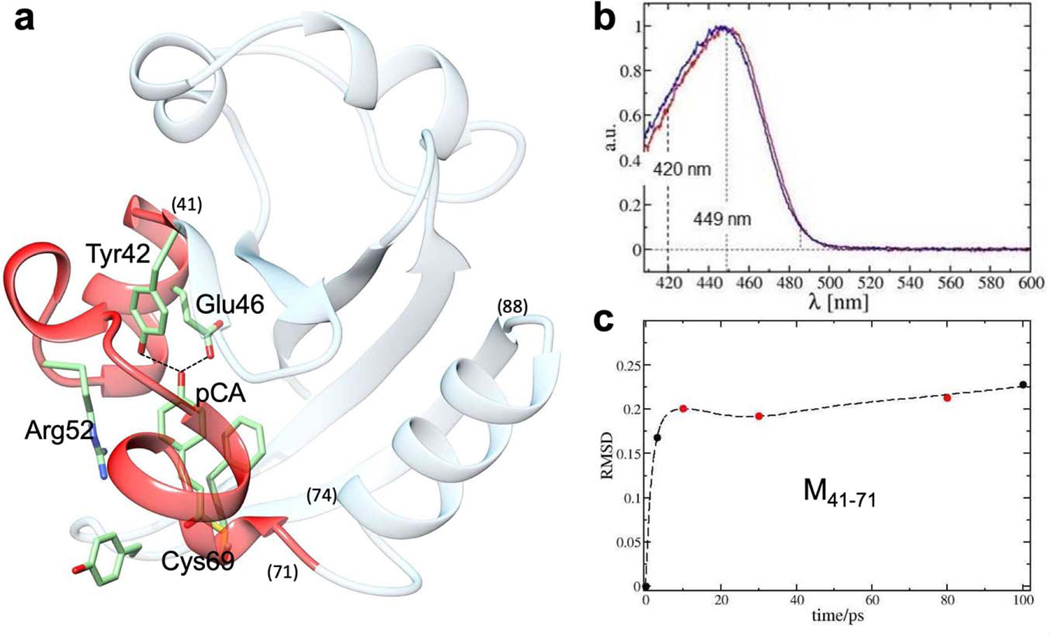
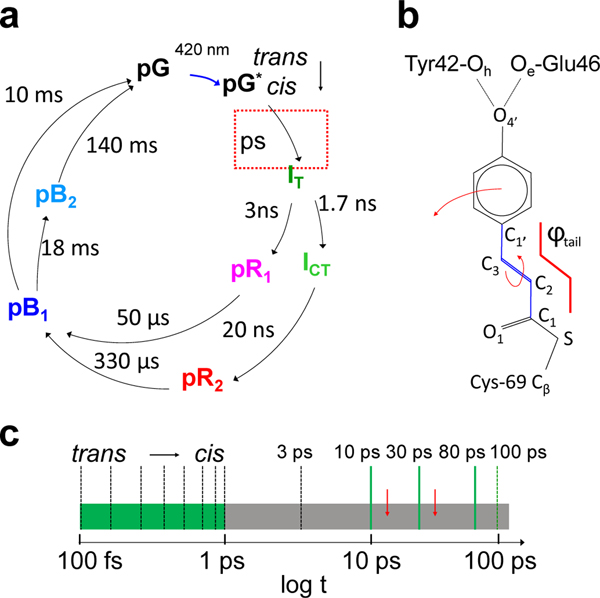
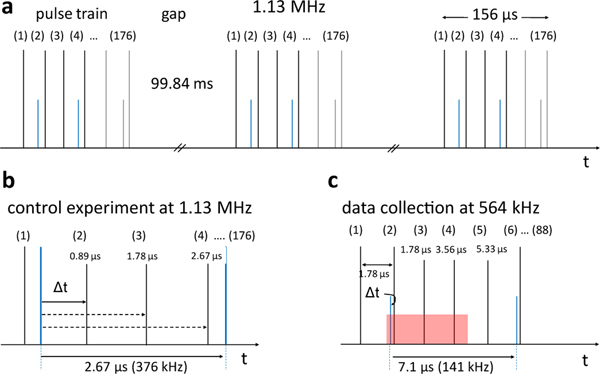
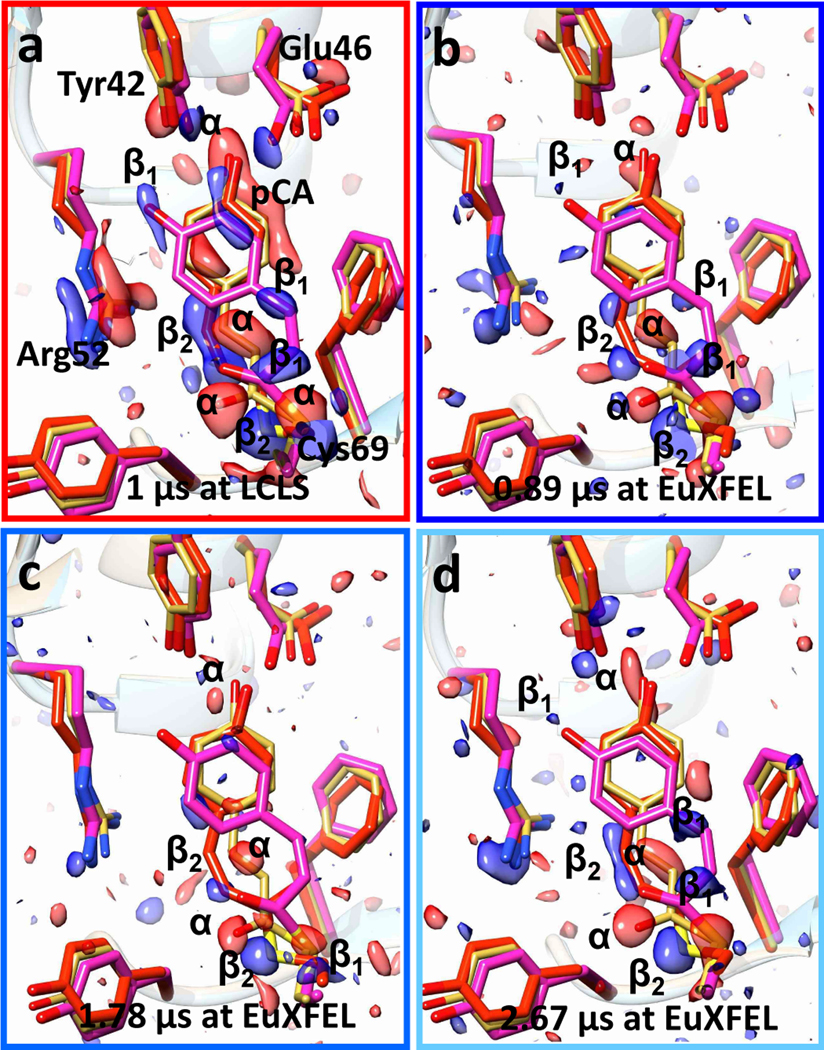
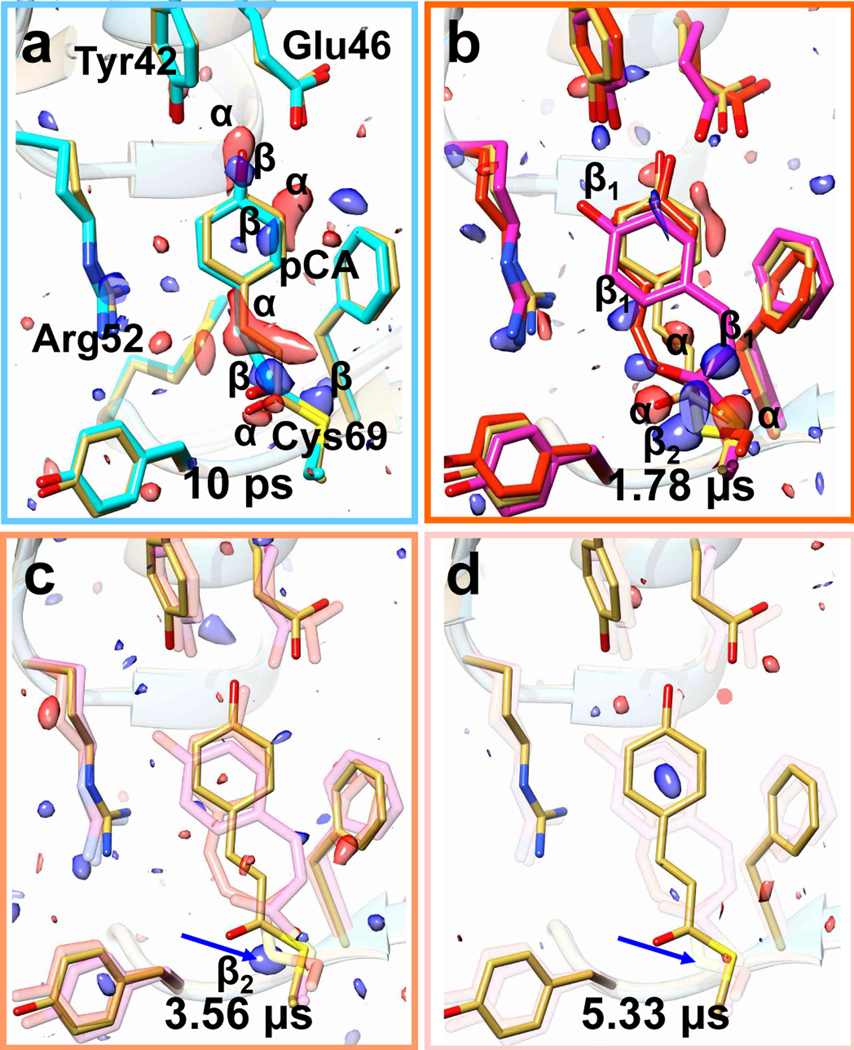
The European XFEL (EuXFEL) is a 3.4-km long X-ray source, which produces femtosecond, ultrabrilliant and spatially coherent X-ray pulses at megahertz (MHz) repetition rates. This X-ray source has been designed to enable the observation of ultrafast processes with near-atomic spatial resolution. Time-resolved crystallographic investigations on biological macromolecules belong to an important class of experiments that explore fundamental and functional structural displacements in these molecules. Due to the unusual MHz X-ray pulse structure at the EuXFEL, these experiments are challenging. Here, we demonstrate how a biological reaction can be followed on ultrafast timescales at the EuXFEL. We investigate the picosecond time range in the photocycle of photoactive yellow protein (PYP) with MHz X-ray pulse rates. We show that difference electron density maps of excellent quality can be obtained. The results connect the previously explored femtosecond PYP dynamics to timescales accessible at synchrotrons. This opens the door to a wide range of time-resolved studies at the EuXFEL.


Figures

Extended Figure 1
Extended Figure 1. Setup of a MHz TR-SFX experiment at the EuXFEL (modified from Wiedorn et al., 2018)
X-ray pulses arrive in 1.13 MHz bursts which repeat every 100 ms. There are 176 X-ray pulses in the burst. The KB-mirror system focuses the X-ray beam to a 2 – 3 μm focal spot. The fs-laser delivers 376 kHz pulses (λ=420 nm, blue) synchronized to the X-ray pulses. The laser focus is 42 μm Ø in the X-ray interaction region (dotted circle). The microcrystals are mixed with fluorinated oil and injected by a GDVN. The jet produced by the GDVN, the laser beam as well as the X-ray pulses precisely intersect. The time-resolved diffraction patterns are collected by the AGIPD. Diffraction patterns with common time-delays were separated based on the pulse ID (see also Fig. 2b) and combined to datasets.
Extended Figure 2
Extended Figure 2. Hit and indexing rates
a, Hit rates (red) and indexing rates (black) with 1.13 MHz X-ray pulse repetition rate. Note, the strong drop of the hit-rate after the first pulse from 2% to 1%. 472,528 total patterns, 41,559 hits and 24,815 indexed patterns were separated on the basis of pulse IDs. From these, hit rates and indexing rates were calculated. b, Hit rates (red) and indexing rates (black) with 564 kHz X-ray pulse repetition. The overall hit rate is about 2%. 52,495,158 total patterns, 304,673 hits and 142,948 indexed patterns were separated on the basis of pulse IDs from which hit rates and indexing rates were calculated. Blue solid line in a and b, X-ray pulse energy (on arbitrary scale). The indexing rate varies only slightly and is about 40% - 60%.
Extended Figure 3
Extended Figure 3. Extrapolated electron density maps (1.5 σ contour level)
a, 3 ps at LCLS (Pande et al., 2016). b - c, 10 ps, 30 ps and 80 ps at EuXFEL. e, 100 ps at APS (Jung et al., 2013). The extrapolated maps were calculated from 13,722, 13,142, 13,014, 12,889 and 13,214 extrapolated structure factors for the 3 ps to 100 ps time delays, respectively.
Extended Figure 4
Extended Figure 4. Excitation and ultrafast displacements in PYP.
a, Structure of PYP. Some important residues in the chromophore (pCA) binding pocket are marked. The M41–71 moiety (residues 41 to 71) is marked in red. Helix H74–88 is marked. b, Dark state spectra of PYP. Black: measured in solution, red: in the crystal. The wavelength at the absorption maximum is marked. Excitation has been achieved with 240 fs laser pulses with λ=420 nm. c, Solid spheres: root mean square displacements of 31 Cα atoms in M41–71 relative to the dark (reference) structure, red spheres: from data measured at EuXFEL. Dashed line: fit by a function consisting of an exponential, a strongly damped, phase shifted cosine function and a straight line as outlined in the text.
Extended Figure 5
Extended Figure 5. Difference distance matrices evaluated for Cα atoms of residues 42 to 93.
The green line denotes the M41–71 moiety. The scale on top is in Å. a - d, Difference distance matrices derived from structures at 10 ps, 30 ps, 80 ps and 100 ps relative to that at 3 ps, respectively. Difference distances are also shown for helix H74–88.
Extended Figure 6
Extended Figure 6. Signal levels in the DED map at the 30 ps delay
The DED map at 30 ps is overlaid on the entire PYP and contoured from +/− 2σ to +/− 4σ in steps of 0.5σ. Red: negative DED, green: positive DED. The 3σ level, c, is the best compromise to distinguish the signal, for example on the pCA chromophore, from spurious noise features distributed within the protein volume.
Extended Figure 7
Extended Figure 7. Method to determine the factor N and the population transfer (PT).
The factor N has been determined to calculate extrapolated, conventional maps from data collected at various X-ray sources. Black spheres: summed absolute negative DED in a sphere of R = 4 Å centered on the PCA chromophore double bond. Red dotted lines: the more horizontal line follows the initial slope of the data; the second line delineates the constant incline with larger Ns. The Next (in brackets) can be estimated from the intersection of the two lines. a, 3ps data from CXI at LCLS collected with fs laser excitation in the absorption maximum (Pande et al., 2016). Factor N = 16, PT = 12.5 %, insert: 1 μs data collected with ns laser excitation. N = 4, and PT = 50% (Tenboer et al., 2014). b, c, and d, Factors N for the 10 ps, 30 ps, and 80 ps data collected at the EXFEL with fs laser excitation outside the absorption maximum. PT is about 7 % throughout. Insert in d, 100 ps data collected at APS (about 6% PT, Jung et al., 2013). 13,214, 13,542, 13,722, 13,142, 13,014 and 12,889 observed difference amplitudes are used to determine extrapolated maps for the 100ps, 1μs, 3ps, 10ps, 30ps and 80ps time delays, respectively.
Extended Figure 8
Extended Figure 8. Observed and calculated difference electron densities (DED) near the pCA chromophore.
Left panels: observed difference electron density (blue: 3 σ, red: -3 σ contour levels). Right panels: calculated difference electron density (blue: 4 σ, red: -4 σ contour levels). Yellow model: structure of the dark (reference) state; blue model: structure at a particular time delay. a, 10 ps; b, 30 ps, c, 80 ps. In panel b pairwise difference density features are marked with α (negative) and β (positive). The feature γ shows the signal caused by the Cys-69 sulfur. The marked DED features can be readily detected at the other time delays. 13,142, 13,014 and 12,889 difference amplitudes were used to calculate the observed DED maps for a, b and c, respectively.
Fig. 1|
Fig. 1|. The photocycle of PYP in crystals.
a, The photocycle (simplified) is initiated by blue light that excites the ground (dark) state pG to the electronic excited state pG*. After the trans to cis isomerization at 600 fs, several electronic ground state intermediate states called IT, pR1, pR2, pB1 and pB2 are populated on various time scales until the photocycle completes. Approximate relaxation times are shown. Red dotted box: relaxations on the picosecond time scale. b, The chemical structure of the pCA chromophore bound to the Cys-69 sulfur. The trans configuration is shown. The torsional angle φtail as defined by chromophore carbon atoms C1-C2=C3-C1’ is outlined in red. Hydrogen bonds between the pCA head and Glu46 and Tyr42 are marked. The rotation about the double bond as well as the head displacement at longer times are shown by arrows. c, The ultrafast time scale from 100 fs to 100 ps. Black dashed bars: time-delays collected at the LCLS (Pande et al., 2016), green dashed bar: time-delay collected at APS (Jung et al., 2013). Green solid bars: time-delays as collected in this study. They cover the poorly explored time-range from 1 ps to 100 ps (gray). Red arrows: picosecond processes observed spectroscopically (Creelman et al., 2014).
Fig. 2|
Fig. 2|. Pulse train structure and laser excitation.
a, X-ray pulse trains (black vertical lines) at EuXFEL with 1.13 MHz pulse repetition rate. A pulse train is 156 μs long, contains 176 X-ray pulses and repeats 10 times per second. There are 99.84 ms gaps between the pulse trains. Blue: laser pulses for a pump-probe dark TR-SFX data collection scheme. Note: when EuXFEL design specifications are reached, 2700 pulses with up to 4.5 MHz pulse repetition rate are in a train. At 4.5 MHz, each pulse train is 600 μs long with 99.4 ms gaps between the trains. In total there are 27,000 pulses/s, a subset of which (about 3520/s) can be stored in, and read out, by in the AGIPD detector. b, 1.13 MHz control experiment with 376 kHz laser excitation. After the laser pulse, subsequent X-ray pulses arrive at 887 ns, at 1.78 μs and at 2.67 μs. The sequence repeats until the end of the pulse train. c, 564 kHz data collection with three interleaved X-ray pulses. 88 pulses are in the train, only. The laser pulses are separated by 7.1 μs (141 kHz) to provide enough time for the laser excited volume (red) to move out of the X-ray interaction region. 519,336 diffraction patterns were averaged to determine the scheme.
Fig. 3|
Fig. 3|. TR-SFX experiments at LCLS and EuXFEL.
a, Difference electron density (DED) in the PYP chromophore pocket at 1 μs time-delay as determined at the LCLS (Tenboer et al., 2014). Red: negative DED, blue: positive DED on the −3σ/3σ contour levels, respectively. Prominent features are labeled α (negative) or β1 and β2 (positive). Features α are on top of the reference structure (yellow), β1 and β2 features correspond to intermediate structures called pR1 (magenta) and pR2 (red), respectively. The pattern of α and β1, β2 features persists in all maps at all times. b – d, Results of the control experiment with 1.13 MHz X-ray pulse repetition and 376 kHz laser excitation (see also Fig. S2b). b, 0.89 μs after the laser pulse, c, 1.78 μs after the laser pulse, d, 2.67 μs after the laser pulse.
Fig. 4|
Fig. 4|. Difference electron density (DED) and structures of the chromophore binding region of PYP.
TR-SFX data were collected with 564 kHz X-ray and 141 kHz laser pulse repetition rates, respectively. a, 10 ps time delay. Yellow: reference structure, green: 10 ps structure. Red features α: negative difference DED (- 3σ contour level), blue, β: positive DED (3 σ contour level). b, The pattern of DED features radically changes compared to (a). Magenta and red: structures of the pR1 (DED features β1) and pR2 (DED features β2) intermediates, respectively. c, After 3.56 μs only the prominent feature of the Cys69 sulfur remains, which is completely absent at 5.33 μs, see blue arrows in c and d.
Fig. 5|
Fig. 5|. Time series of TRX data from 3 ps to 100 ps collected at LCLS, EuXFEL and APS.
Structures and difference electron density (DED) in the chromophore binding region of PYP. Red: negative DED (−3σ contour level), blue positive DED (3 σ contour level). Important residues and the pCA chromophore are marked in a. Yellow structure: structure of the (dark) reference state. Arrows depict structural displacements in a, f and j. Upper: front view, lower side view. a and f, 3 ps delay as collected at LCLS. Green: PYP structure at 3 ps (Pande et al., 2016). b and g, 10 ps time delay, this study, cyan: PYP structure at 10 ps. c and h, 30 ps time delay, this study, sky blue: PYP structure at 30 ps. d and i, 80 ps time delay, this study, blue: PYP structure at 80 ps. e and j, 100 ps time-delay as determined at APS, light blue: PYP structure at 100 ps (Jung et al., 2012).

References

    1. Moffat K. Time-resolved biochemical crystallography: A mechanistic perspective. Chemical reviews 101, 1569–1581, doi:Doi 10.1021/Cr990039q (2001). - DOI - PubMed
    1. Schmidt M. Time-Resolved Macromolecular Crystallography at Modern X-Ray Sources. Methods Mol Biol 1607, 273–294, doi: 10.1007/978-1-4939-7000-1_11 (2017). - DOI - PubMed
    1. Aquila A. et al. Time-resolved protein nanocrystallography using an X-ray free-electron laser. Optics express 20, 2706–2716, doi: 10.1364/OE.20.002706 (2012). - DOI - PMC - PubMed
    1. Tenboer J. et al. Time-resolved serial crystallography captures high-resolution intermediates of photoactive yellow protein. Science 346, 1242–1246, doi: 10.1126/science.1259357 (2014). - DOI - PMC - PubMed
    1. Chapman HN et al. Femtosecond X-ray protein nanocrystallography. Nature 470, 73–77, doi: 10.1038/nature09750 (2011). - DOI - PMC - PubMed

Publication types

Substances