. 2019 Dec;16(12):1297-1305.
doi: 10.1038/s41592-019-0617-2. Epub 2019 Nov 18.

Nanopore native RNA sequencing of a human poly(A) transcriptome

Affiliations

Nanopore native RNA sequencing of a human poly(A) transcriptome

Rachael E Workman et al. Nat Methods. 2019 Dec.

Erratum in

  • Author Correction: Nanopore native RNA sequencing of a human poly(A) transcriptome.
    Workman RE, Tang AD, Tang PS, Jain M, Tyson JR, Razaghi R, Zuzarte PC, Gilpatrick T, Payne A, Quick J, Sadowski N, Holmes N, de Jesus JG, Jones KL, Soulette CM, Snutch TP, Loman N, Paten B, Loose M, Simpson JT, Olsen HE, Brooks AN, Akeson M, Timp W. Workman RE, et al. Nat Methods. 2020 Jan;17(1):114. doi: 10.1038/s41592-019-0697-z. Nat Methods. 2020. PMID: 31819268 Free PMC article.

Abstract

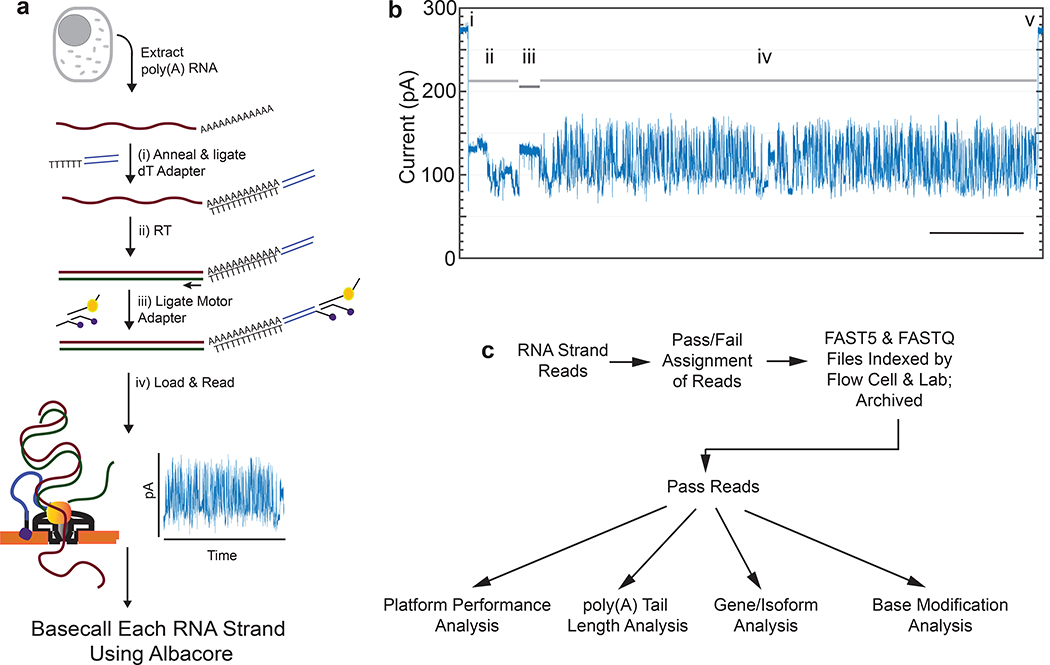
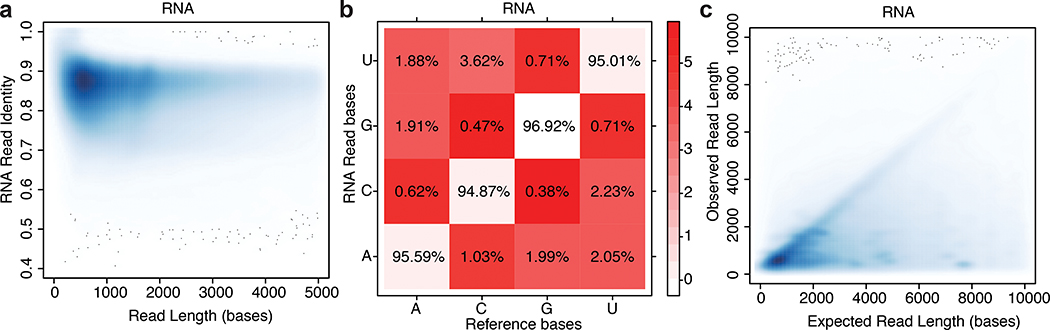
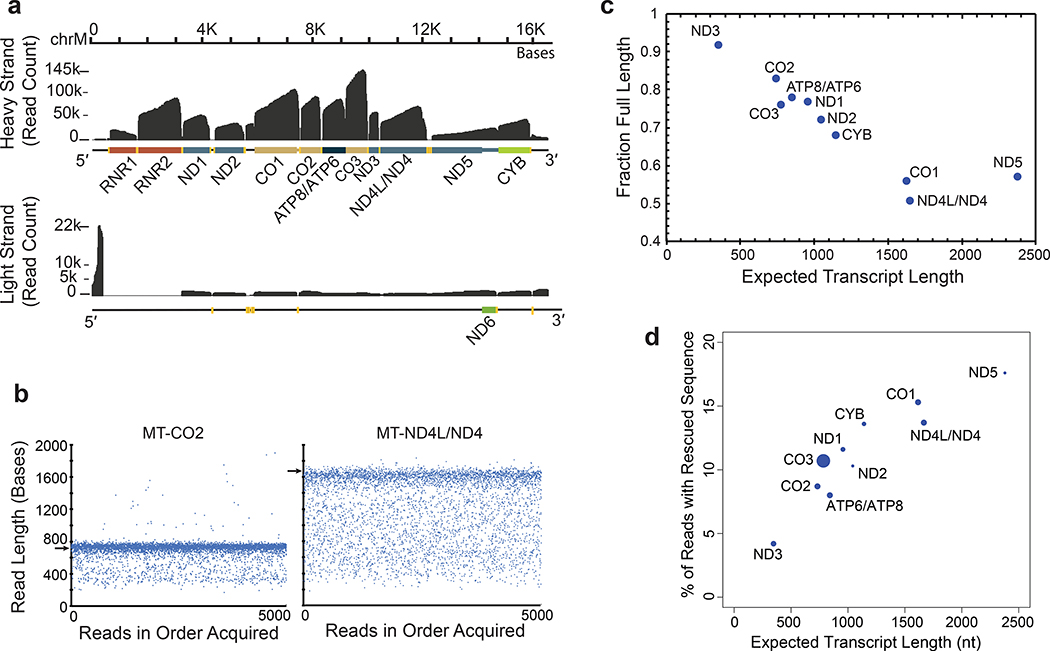
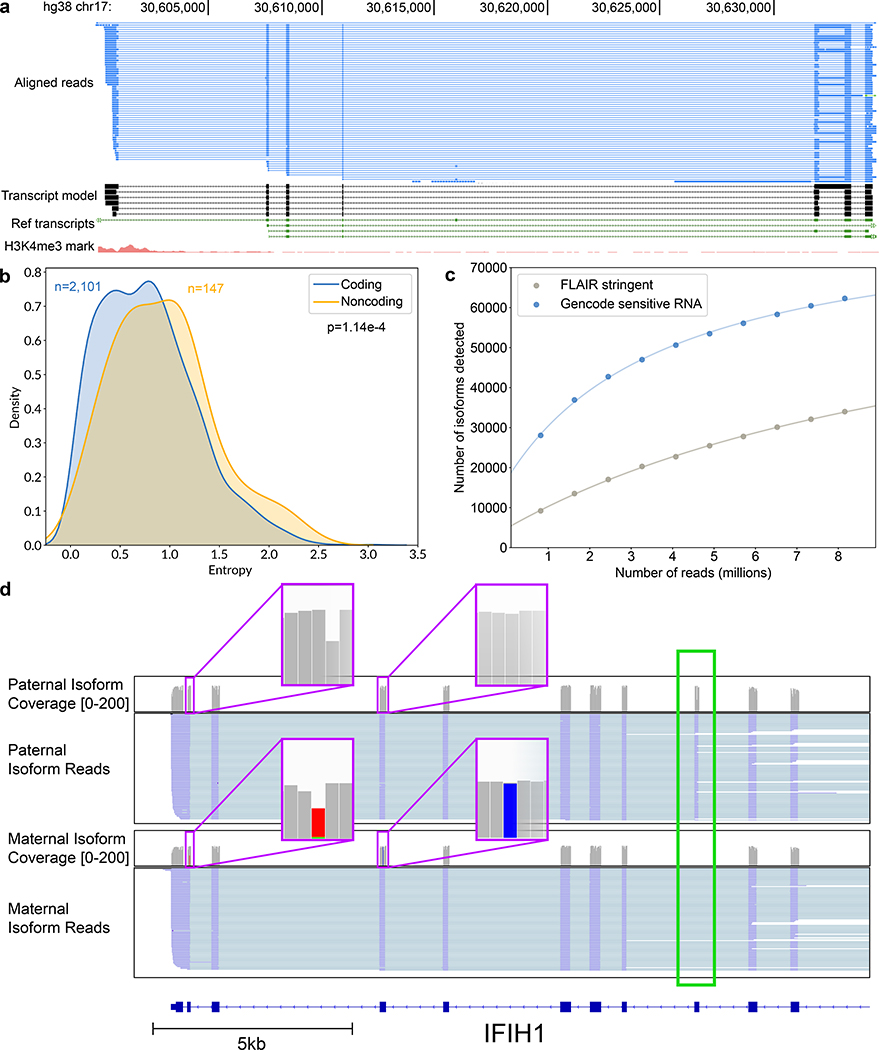
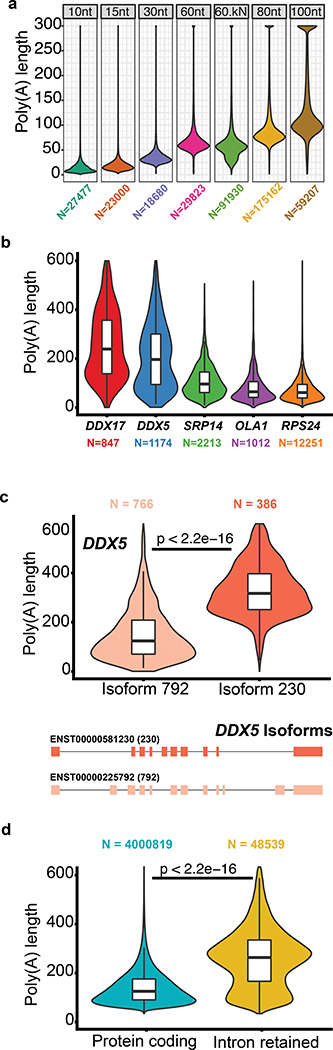
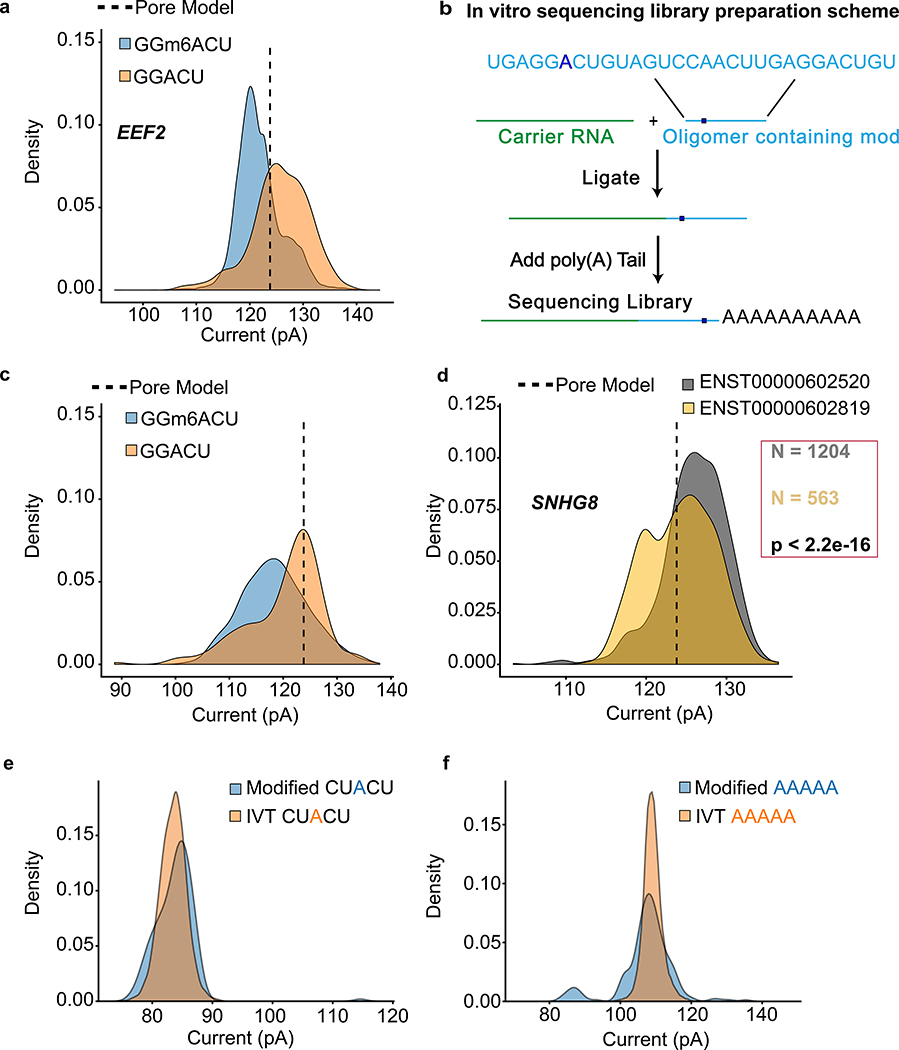
High-throughput complementary DNA sequencing technologies have advanced our understanding of transcriptome complexity and regulation. However, these methods lose information contained in biological RNA because the copied reads are often short and modifications are not retained. We address these limitations using a native poly(A) RNA sequencing strategy developed by Oxford Nanopore Technologies. Our study generated 9.9 million aligned sequence reads for the human cell line GM12878, using thirty MinION flow cells at six institutions. These native RNA reads had a median length of 771 bases, and a maximum aligned length of over 21,000 bases. Mitochondrial poly(A) reads provided an internal measure of read-length quality. We combined these long nanopore reads with higher accuracy short-reads and annotated GM12878 promoter regions to identify 33,984 plausible RNA isoforms. We describe strategies for assessing 3' poly(A) tail length, base modifications and transcript haplotypes.


Conflict of interest statement

COMPETING FINANCIAL INTERESTS

Figures

Figure 1
Figure 1
Nanopore native poly(A) RNA sequencing pipeline. (a) RNA is isolated from cells followed by poly(A) selection using poly(dT) beads. Poly(A) RNA is then prepared for nanopore sequencing using the following steps: (i) A duplex adapter bearing a poly(dT) overhang is annealed to the RNA poly(A) tail, followed by ligation of the strand abutting the poly(A) tail; ii) the poly(dT) complement is extended by reverse transcription. This step improves throughput, but it is not necessary, and the cDNA strands are not read; iii) a proprietary ONT adapter bearing a motor enzyme is ligated to the first adapter; and (iv) the product is loaded onto the ONT flow cell for reading by ionic current impedance. The ionic current trace for each poly(A) RNA strand is base called using a proprietary ONT algorithm (Albacore). (b) A representative ionic current trace for a 2.3 kb TP3 transcript. Ionic current components: (i) Strand capture; ii) ONT adapter translocation; iii) poly(A) RNA tail translocation; iv) mRNA translocation; and (v) exit of the strand into the trans compartment. Bar is 5 seconds. (c) Processing of the RNA strand reads in silico, followed by data analysis.
Figure 2
Figure 2
Performance statistics for nanopore native RNA sequencing. (a) Alignment identity vs. read length for native RNA reads. b) Substitution matrix for native RNA reads. The x-axis is the known base identity for the GENCODE v27 transcriptome at positions that aligned to nanopore reads. The y-axis is base identity at the same position for nanopore reads. The values within boxes are the percentage of times nanopore basecalls corresponded to correct (diagonal) or incorrect (red shaded) calls according to the reference. The color intensity in the boxes represents the negative natural log probability of basecall matches or mismatches (see color key at right). (c) Observed vs. expected read length for ~9.7 million native RNA reads. The discrete clusters below the diagonal represent incorrect assignments to GENCODE isoforms, and the diffuse shading represents fragmented RNA.
Figure 3
Figure 3
Mitochondrially-encoded poly(A) RNA transcripts. (a) Read coverage of the H strand (top) and the L strand (bottom). Dark grey is base coverage along the MT genome. Labeled colored bars represent protein coding genes including known UTRs, or ribosomal RNA (RNR1, RNR2). Text denotes specific genes without the MT prefix. Yellow bars represent tRNA genes. (b) Distribution of nanopore read lengths for MT-CO2 and MT-ND4L/ND4 transcripts. Each point represents one of approximately 5000 reads in the order acquired from a single Lab 1 MinION experiment. Horizontal arrows are expected transcript read lengths. (c) Relationship between expected transcript read length and fraction of nanopore poly(A) RNA reads that were full length. Each point is for a protein coding transcript on the H strand. Labels are for mitochondrial genes without the MT prefix. See Online Methods for definition of ‘Full Length’. (d) Percent of artificially truncated strand reads where sequence was recovered from the ionic current signal. Points are for protein coding transcripts as in panel c.
Figure 4
Figure 4
Isoform-level analysis of GM12878 native poly(A) RNA sequence reads. (a) Genome browser view of unannotated isoforms that aligned to SMURF2P1-LRRC37BP1. The tracks are: a subset of the aligned native RNA reads (blue); the FLAIR-defined isoforms (black); SMURF2P1-LRRC37BP1 annotated isoforms from GENCODE v27 comprehensive set (green); transcription regulatory histone methylation marks (red). (b) Shannon entropy of isoform expression for coding versus noncoding genes detected by FLAIR. Only genes with at least 50 reads and more than two isoforms were used. The p-value was calculated from a Mann-Whitney U test. (c) Saturation plot showing the number of isoforms discovered (y-axis) versus the number of native RNA reads (x-axis). (d) IGV view of allele-specific isoforms for IFIH1. Purple boxes (insets) indicate the location of SNPs used to assign allele specificity (gray reference; red and blue SNPs). The alternatively spliced exon is indicated by a green box.
Figure 5
Figure 5
Testing and implementation of the poly(A) tail length estimator nanopolish-polya. (a) Estimate of poly(A) lengths for a synthetic enolase control transcript bearing 3′ poly(A) tails of 10, 15, 30, 60, 80 or 100 nucleotides. ‘60kN’ contained all possible combinations of a 10nt random sequence inserted between the enolase sequence and the 3′ poly(A) 60mer. (b) Violin/box plots showing poly(A) tail length distributions for genes with the longest (DDX5, DDX17), median (SRP14), and shortest (RPS24, OLA1) values from a ranked list of 1043 genes. (c) Distribution of poly(A) tail lengths and gene models for two isoforms of DDX5. (d) Distribution of poly(A) tail lengths for representative intron-retaining and intron-free transcripts identified using the GENCODE-Sensitive isoform set. Kruskal-Wallis p-value are denoted.
Figure 6
Figure 6
Nanopore detection of m6A and inosine base modifications. (a) Comparing current signal from m6A-modified and unmodified GGACU motifs in the native RNA dataset for EEF2 and in vitro transcribed dataset. Pore model (indicated by a dashed line) is defined as the mean current amplitude (pA) for the canonical GGACU 5-mer in the ONT model. (b) Schematic for the oligomer-ligation. A synthetic RNA oligomer (Trilink Biotechnologies) containing canonical and modified m6A bearing GGACU 5-mer was ligated to a carrier RNA. This was followed by in vitro polyadenylation. (c) Comparison of ionic current signals for m6A-modified and canonical GGACU motifs. The data were acquired using the assay described in (b). (d) Ionic current distributions for GGACU motifs within SNHG8 gene isoforms (see gene models in Supplemental Figure 7). (e) Ionic current distributions for putative inosine-bearing CUACU 5-mer in the 3′-UTR region of the AHR gene. Blue is native RNA and orange is IVT RNA. (f) Ionic current distributions for putative inosine-bearing AAAAA 5-mer in the 3′-UTR region of the AHR gene. Blue is native RNA and orange is IVT RNA.

Comment in

References

    1. Complementary DNA sequencing: expressed sequenced tags and human genome project M.D. Adams et al. Science 252, 1651–1656. Trends Genet. 7, 281 (1991). - PubMed
    1. Temin HM & Mizutani S RNA-dependent DNA polymerase in virions of Rous sarcoma virus. Nature 226, 1211–1213 (1970). - PubMed
    1. Baltimore D Viral RNA-dependent DNA Polymerase: RNA-dependent DNA Polymerase in Virions of RNA Tumour Viruses. Nature 226, 1209 (1970). - PubMed
    1. Saiki RK et al. Primer-directed enzymatic amplification of DNA with a thermostable DNA polymerase. Science 239, 487–491 (1988). - PubMed
    1. Garalde DR et al. Highly parallel direct RNA sequencing on an array of nanopores. Nat. Methods (2018). doi: 10.1038/nmeth.4577 - DOI - PubMed

Publication types