. 2019 Dec;16(12):1289-1296.
doi: 10.1038/s41592-019-0619-0. Epub 2019 Nov 18.

Fast, sensitive and accurate integration of single-cell data with Harmony

Affiliations

Fast, sensitive and accurate integration of single-cell data with Harmony

Ilya Korsunsky et al. Nat Methods. 2019 Dec.

Abstract

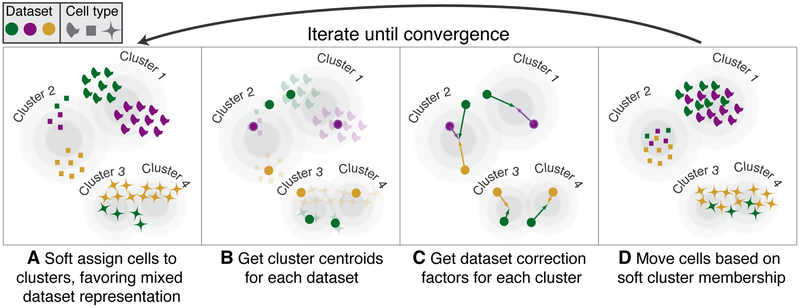
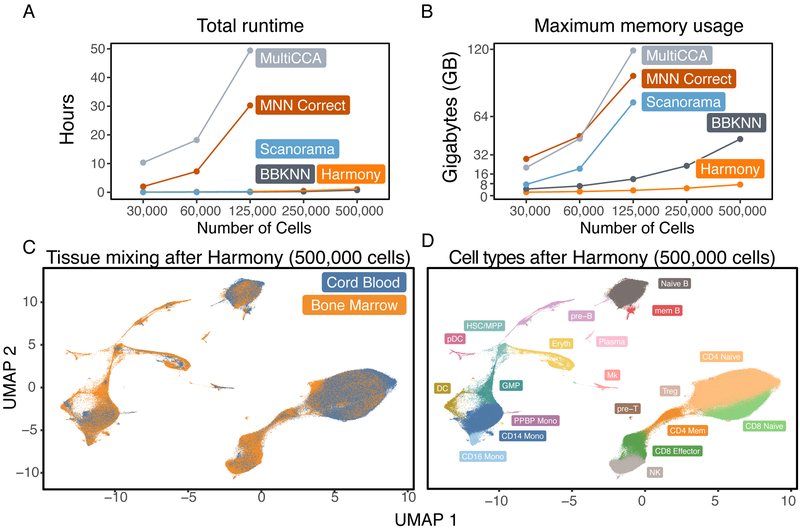
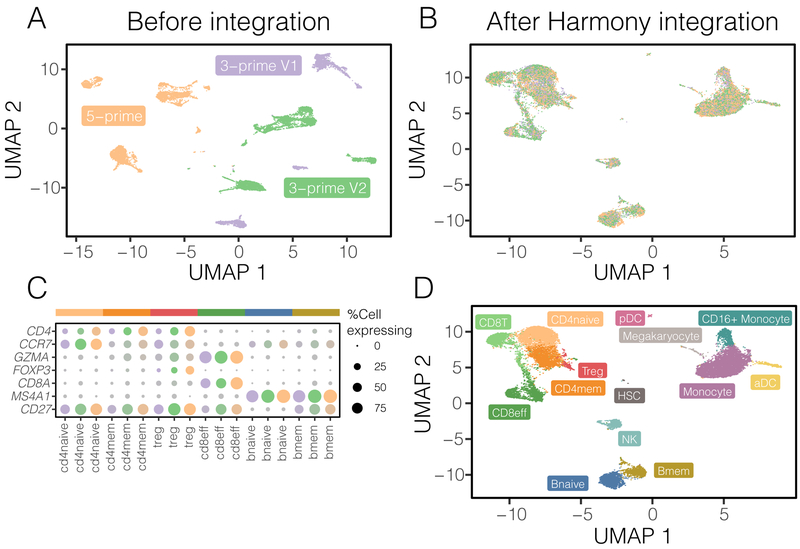
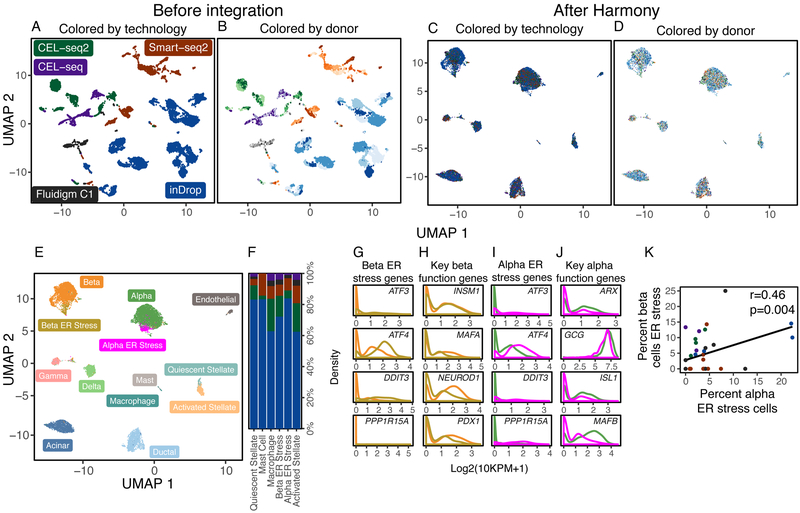
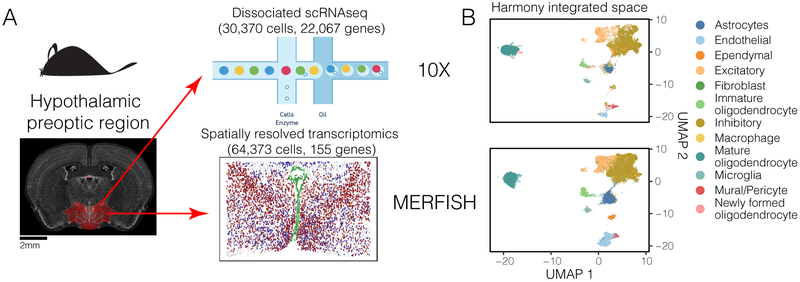
The emerging diversity of single-cell RNA-seq datasets allows for the full transcriptional characterization of cell types across a wide variety of biological and clinical conditions. However, it is challenging to analyze them together, particularly when datasets are assayed with different technologies, because biological and technical differences are interspersed. We present Harmony (https://github.com/immunogenomics/harmony), an algorithm that projects cells into a shared embedding in which cells group by cell type rather than dataset-specific conditions. Harmony simultaneously accounts for multiple experimental and biological factors. In six analyses, we demonstrate the superior performance of Harmony to previously published algorithms while requiring fewer computational resources. Harmony enables the integration of ~106 cells on a personal computer. We apply Harmony to peripheral blood mononuclear cells from datasets with large experimental differences, five studies of pancreatic islet cells, mouse embryogenesis datasets and the integration of scRNA-seq with spatial transcriptomics data.


Figures

Figure 1.
Figure 1.
Overview of Harmony algorithm. We represent datasets with colors, and different cell types with shapes. Before we apply Harmony, principal components analysis embeds cells into a space with reduced dimensionality. Harmony accepts the cell coordinates in this reduced space and runs an iterative algorithm to adjust for data set specific effects. (A) Harmony uses fuzzy clustering to assign each cell to multiple clusters, while a penalty term ensures that the diversity of datasets within each cluster is maximized. (B) Harmony calculates a global centroid for each cluster, as well as dataset-specific centroids for each cluster. (C) Within each cluster, Harmony calculates a correction factor for each dataset based on the centroids. (D) Finally, Harmony corrects each cell with a cell-specific factor: a linear combination of dataset correction factors weighted by its soft cluster assignments made in step A. Harmony repeats steps A through D until convergence. The dependence between cluster assignment and dataset diminishes with each round.
Figure 2.
Figure 2.
Quantitative assessment of dataset mixing and cell-type accuracy with cell line datasets. (A) iLISI measures the degree of mixing among datasets in an embedding, ranging from 1 in an unmixed space to B in a well mixed space. B is the number of datasets in the analysis. (B) cLISI measures integration accuracy using the same formulation but computed on cell-type labels instead. An accurate embedding has a cLISI close to 1 for every neighborhood, reflecting separation of different cell types. Jurkat and HEK293T cells from pure (purple and yellow) and mixed (green) cell-line datasets were analyzed together. Before Harmony integration, cells grouped by dataset (C) and known cell-type (D). (C) iLISI and (D) cLISI were computed for every cell's neighborhood and summarized with quantiles (5, 25, 50, 75, 95). After Harmony integration, cells from the mixture dataset are mixed into the other datasets (E), achieved by mixing Jurkat with Jurkat cells and HEK293T with HEK293T cells (F). (E) iLISI and (F) cLISI were re-computed in the Harmony embedding.
Figure 3.
Figure 3.
Computational efficiency benchmarks. We ran Harmony, BBKNN, Scanorama, MNN Correct, and MultiCCA on 5 downsampled HCA datasets of increasing sizes, from 25,000 to 500,000 cells. We recorded the (A) total runtime and (B) maximum memory required to analyze each dataset. Scanorama, MultiCCA, and MNN Correct were terminated for excessive memory requests on the 250,000 and 500,000 cell datasets. The mixing between tissues in the Harmony embedding is visualized in (C). In the Harmony embedding, (D) we clustered cells and labeled populations by canonical markers: pre-T cells, CD4 Naive T cells, CD4 Memory T cells, T-regs, CD8 Naive T cells, CD8 Effector T cells, natural killer cells (NK), pre-B cells, Naive B cells, Memory B cells, plasma cells, plasmacytoid dendritic cells (pDC), conventional dendritic cells (DC), granulocyte macrophage progenitor (GMP), CD16− monocytes (CD14 Mono), CD16+ monocytes (CD16 Mono), a population of monocytes also positive for Megakaryocyte markers (PPBP Mono), Megakaryocytes (Mk), Erythroid progenitors (Eryth), and a cluster of hematopoietic stem cells and multipotent progenitor cells (HSC/MPP).
Figure 4.
Figure 4.
Fine-grained subpopulation identification in PBMCs across technologies. Three PBMC datasets were assayed with 10X, using different library construction protocols: 5-prime (orange), 3-prime V1 (purple), and 3-prime V2 (green). Before integration (A), cells group by dataset. After Harmony integration (B), datasets are mixed together. (C) Harmony achieves the most thorough integration among datasets, while preserving (D) cell type differences. Using canonical markers (E), we identified (F) 5 shared subtypes of T cells and 2 shared subtypes of B cells. (G) Other integration algorithms fail to group these cells by subtype.
Figure 5.
Figure 5.
Integration of pancreatic islet cells by both donor and technology. Human pancreatic islet cells from 36 donors were assayed on 5 different technologies. Cells initially group by (A) technology, denoted by different colors, and (B) donor, denoted by shades of colors. Harmony integrates cells simultaneously across (C) technology and (D) donor. (E) Clustering in the Harmony embedding identified common and rare cell types, including a previously identified beta population under ER stress. Except for activated stellate cells, all rare cell types were found across the 5 technology datasets (F). The ER stress beta population was enriched for ER stress genes (G) and had decreased expression of key genes necessary for endocrine function (H). We also identified a previously undescribed population of alpha cell, also enriched for ER stress genes (I) with decreased expression of key endocrine genes (J). The abundances of the two ER stress populations were correlated across donors (K).
Figure 6.
Figure 6.
Harmony integrates spatially resolved transcriptomic with dissociated scRNAseq datasets. (A) Cells from the hypothalamic preoptic region of mouse brain were assayed in parallel with two technologies. The full transcriptome of dissociated cells was profiled with 10X. 155 genes were profiled in-situ on intact tissue with MERFISH. (B) Harmony integrated cells from the two modalities into a shared embedding, correctly merging the 12 previously identified cell types. (C) Satb1 expression (blue), unmeasured in the MERFISH dataset, was inferred and predicted to be spatially autocorrelated in inhibitory neurons. Satb1 expression was highest in anterior slices and diminished in slices that contained ventricle-lining Ependymal cells (green). (D) Matched images from an independent in-situ hybridization experiment measuring Satb1 expression from the Allen Brain Atlas. Satb1 expression (blue) is co-localized in similar regions of the slices and diminishes with the appearance of ventricle structures (green).

References

    1. Svensson V, Vento-Tormo R & Teichmann SA Exponential scaling of single-cell RNA-seq in the past decade. Nature Protocols 13, 599–604 (2018). - PubMed
    1. Regev A et al. The human cell atlas. Elife 6 (2017). - PMC - PubMed
    1. Zhang F et al. Defining inflammatory cell states in rheumatoid arthritis joint synovial tissues by integrating single-cell transcriptomics and mass cytometry. Nature immunology 1 (2019). - PMC - PubMed
    1. Arazi A et al. The immune cell landscape in kidneys of lupus nephritis patients. Nature Immunology 20, 902–914 (2019). - PMC - PubMed
    1. Der E et al. Tubular cell and keratinocyte single-cell transcriptomics applied to lupus nephritis reveal type I IFN and fibrosis relevant pathways. Nature Immunolology 20, 915–927 (2019). - PMC - PubMed

Methods-only References

    1. Mao Q, Wang L, Goodison S & Sun Y Dimensionality reduction via graph structure learning. In Proceedings of the 21th ACM SIGKDD International Conference on Knowledge Discovery and Data Mining, KDD ‘15, 765–774 (ACM, New York, NY, USA, 2015).
    1. Dhillon IS & Modha DS Concept decompositions for large sparse text data using clustering. Mach. Learn. 42,143–175 (2001).
    1. Jordan MI & Jacobs RA Hierarchical mixtures of experts and the EM algorithm. Neural Comput. 6, 181–214 (1994).
    1. Buttner M, Miao Z, Wolf FA, Teichmann SA & Theis FJ A test metric for assessing single-cell RNA-seq batch correction. Nature Methods 16, 43–49 (2019). - PubMed
    1. Azizi E et al. Single-Cell map of diverse immune phenotypes in the breast tumor microenvironment. Cell 174, 1293–1308.e36 (2018). - PMC - PubMed

Publication types