. 2019 Dec;51(12):1732-1740.
doi: 10.1038/s41588-019-0525-5. Epub 2019 Nov 18.

The mutational footprints of cancer therapies

Affiliations

The mutational footprints of cancer therapies

Oriol Pich et al. Nat Genet. 2019 Dec.

Abstract

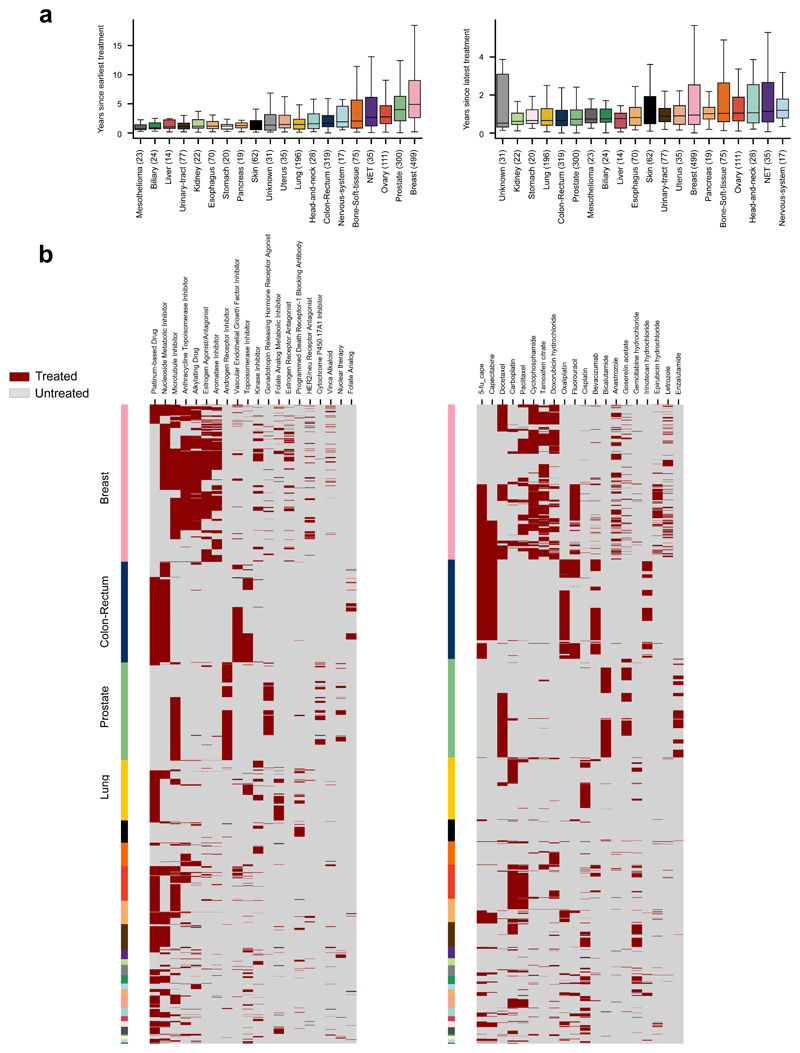
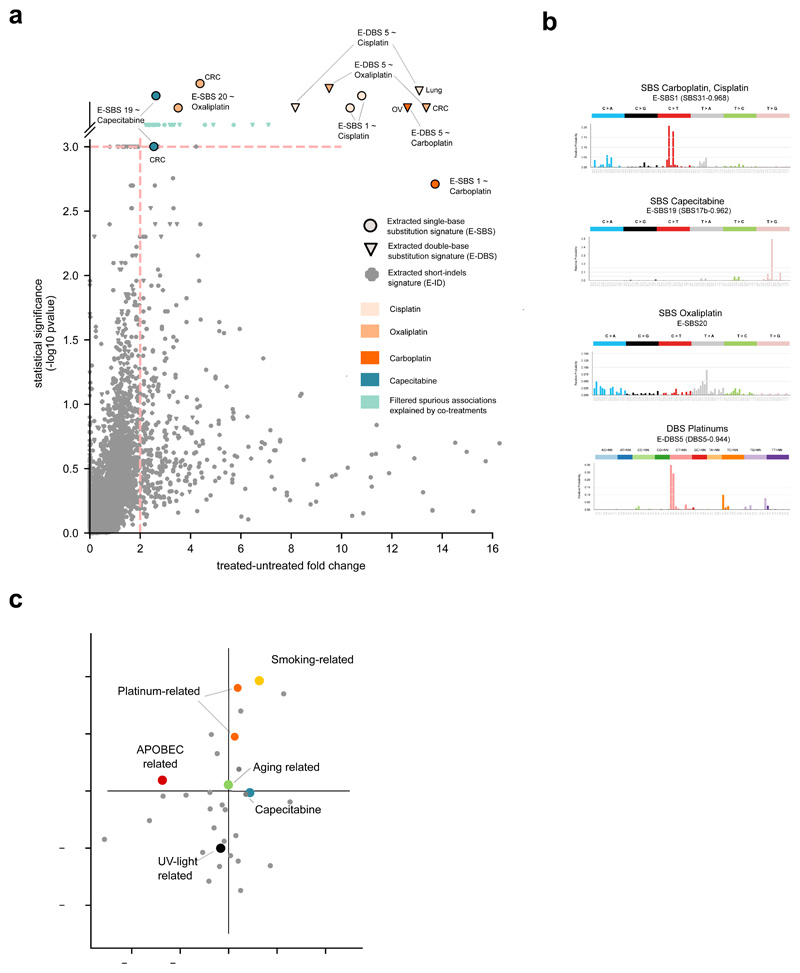
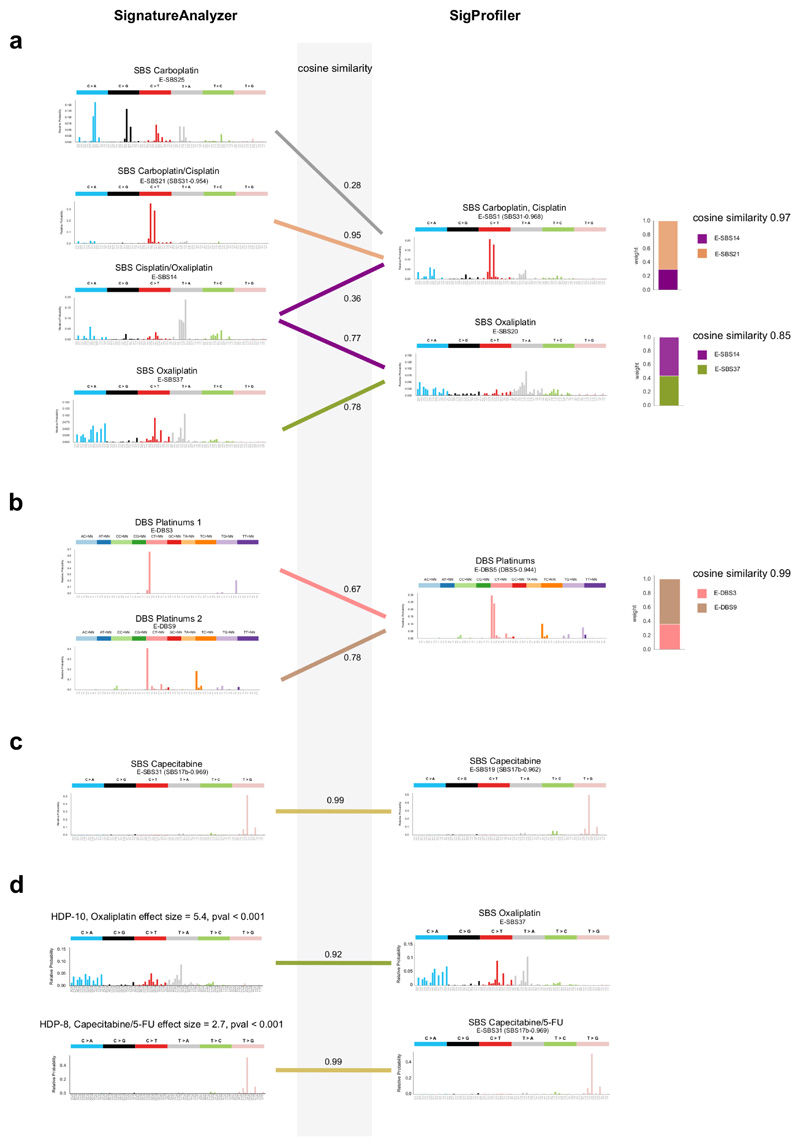
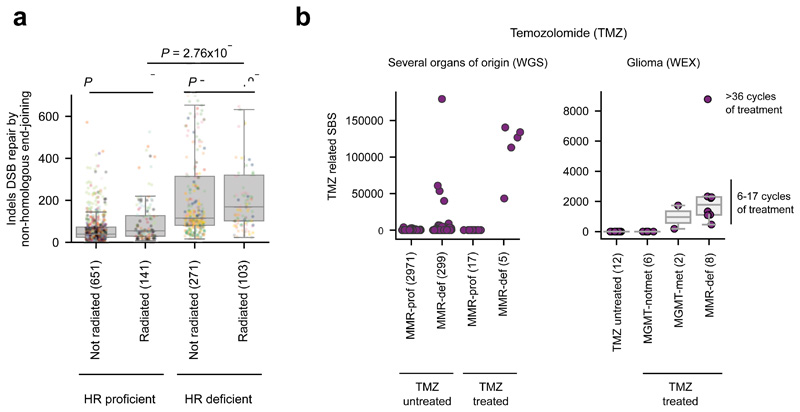
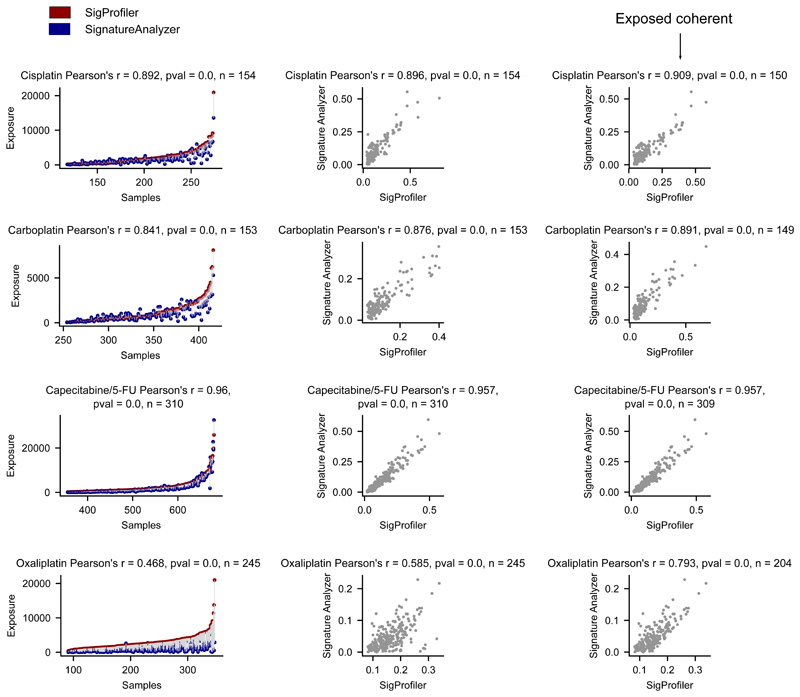
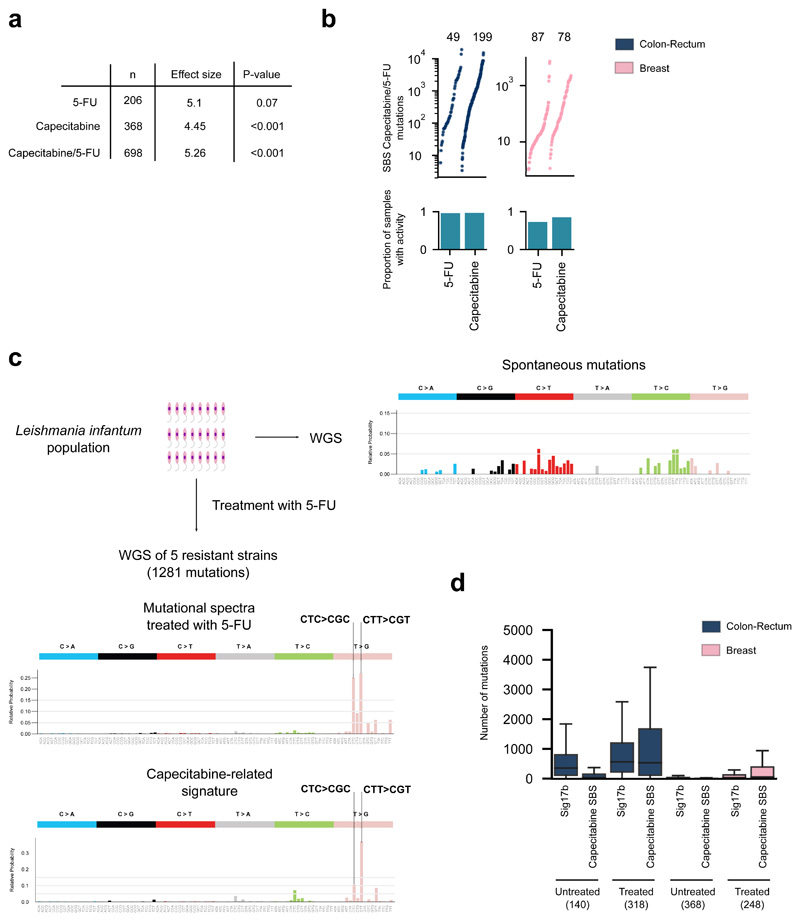
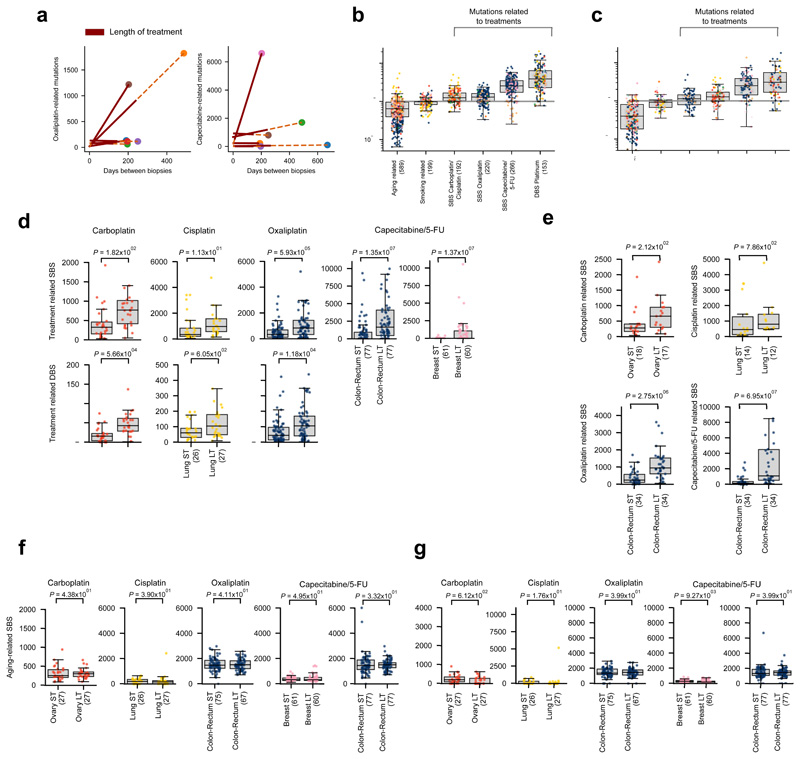
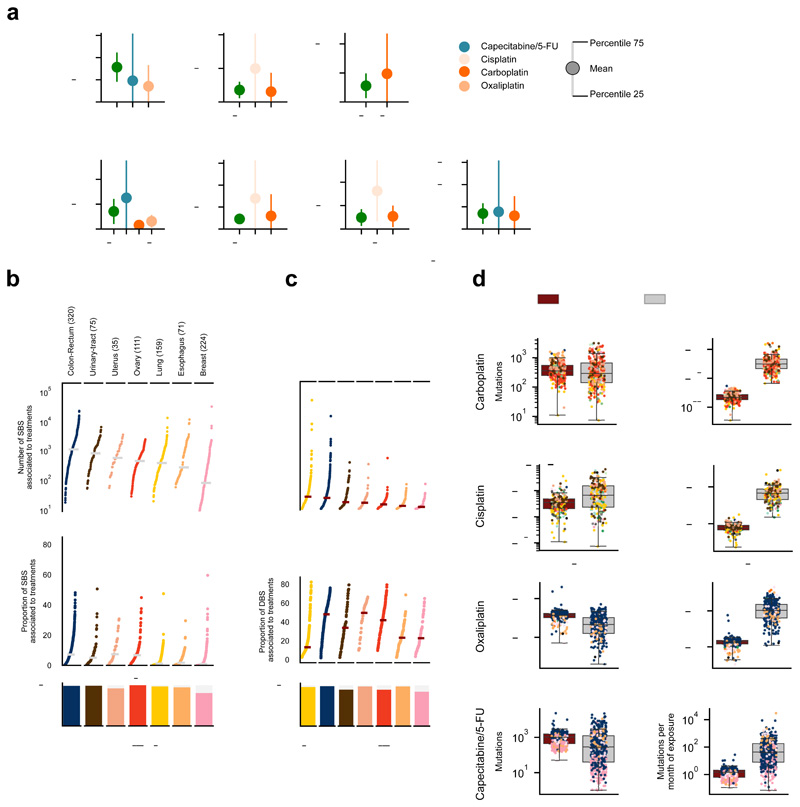
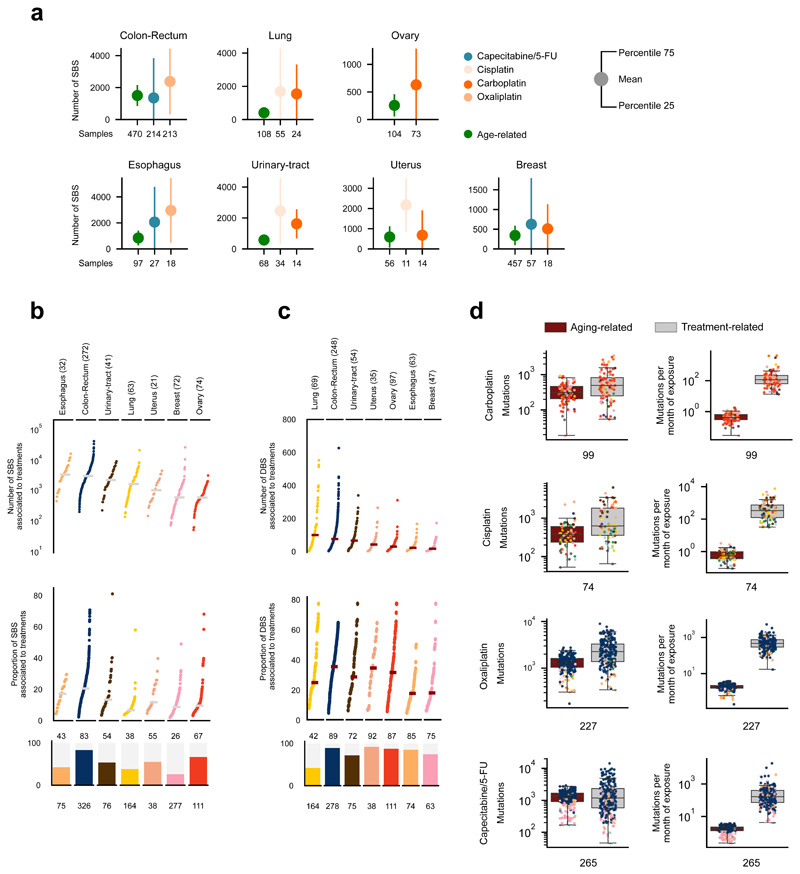
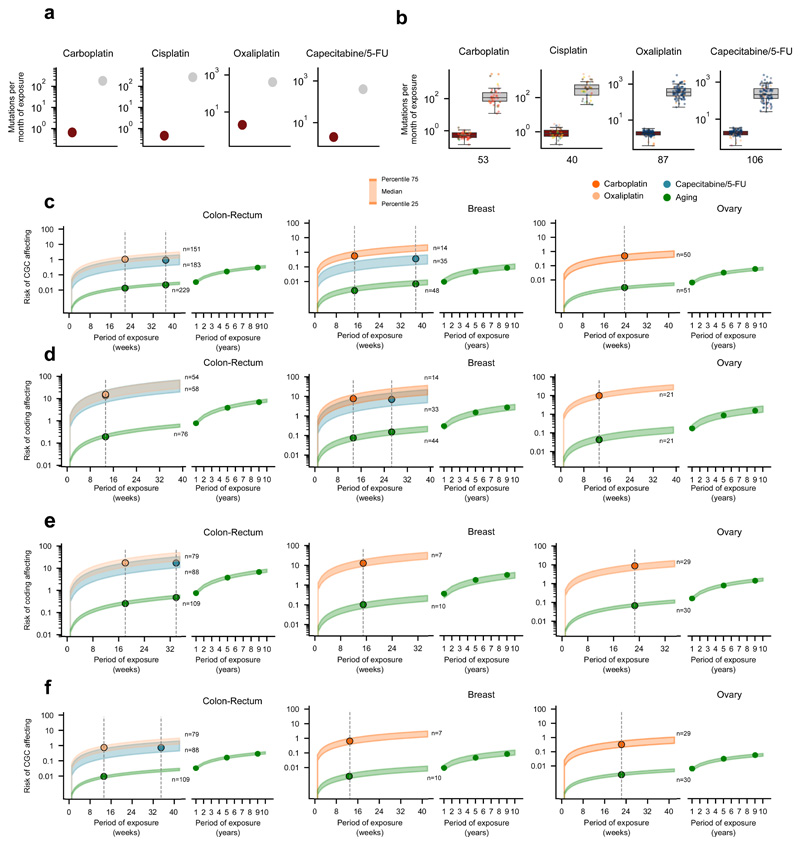
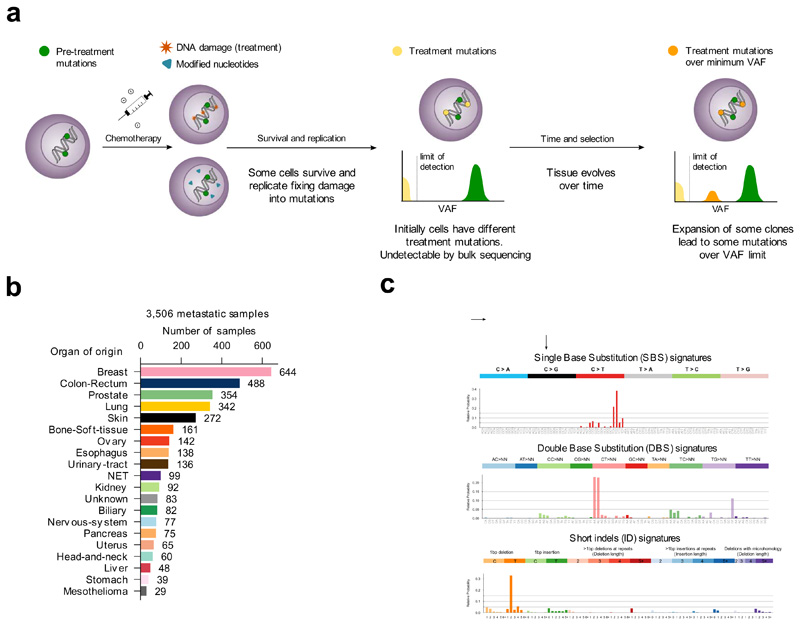
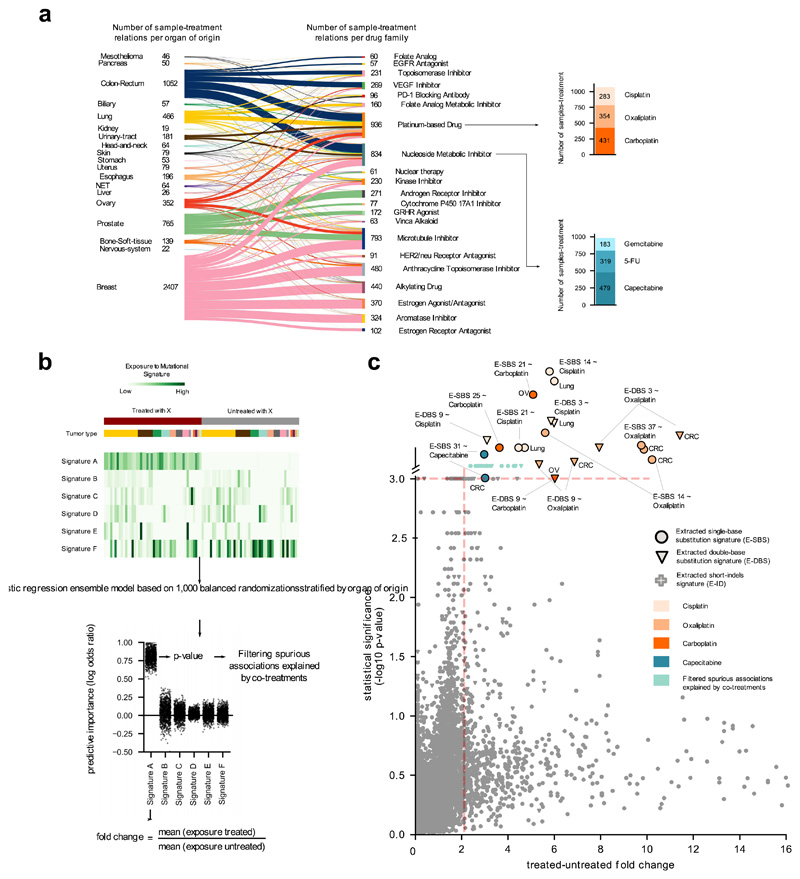
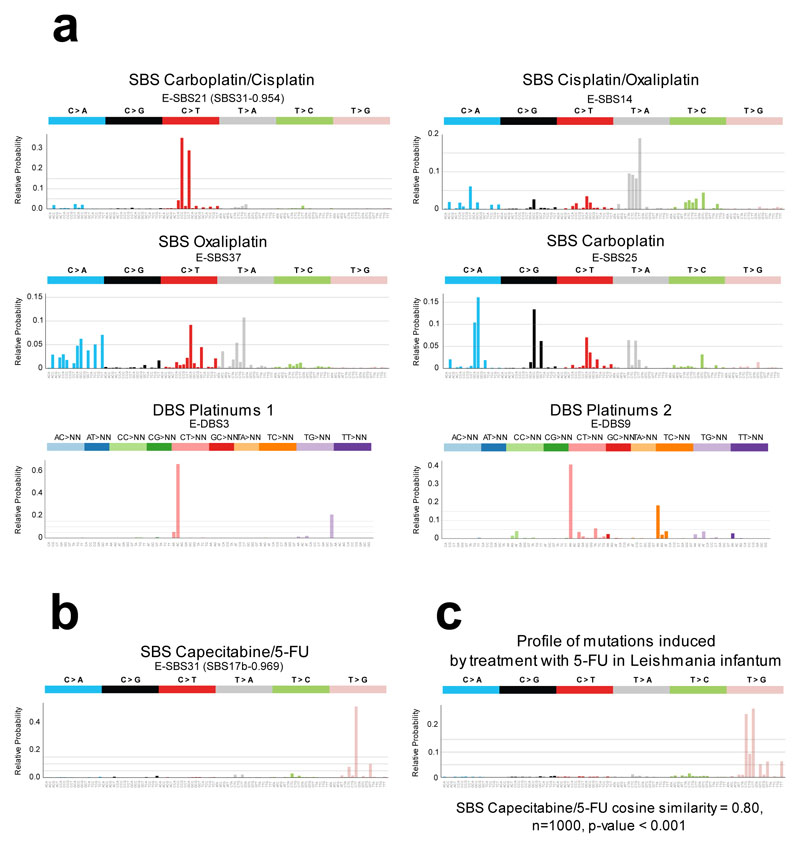
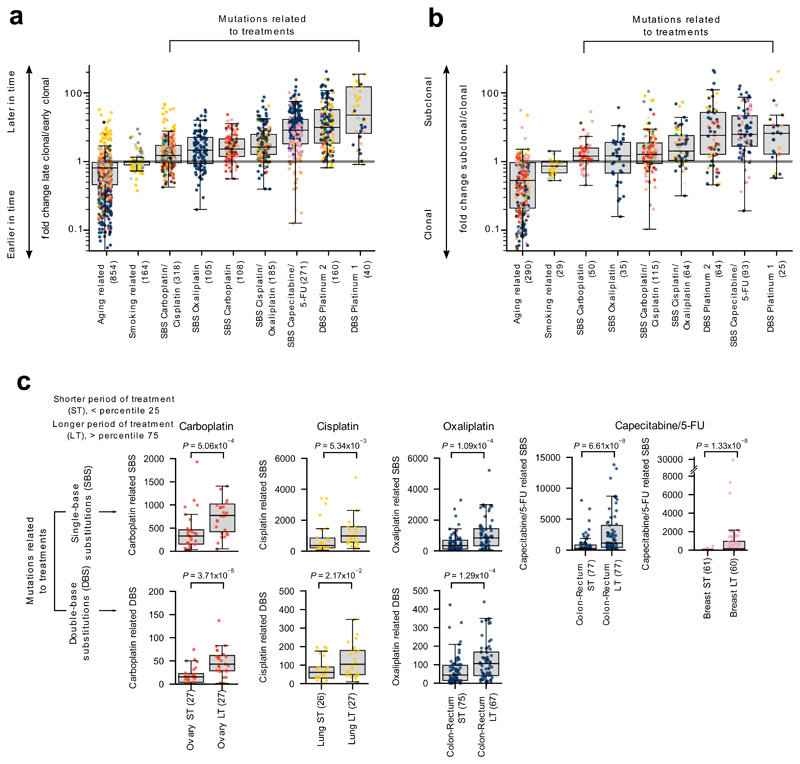
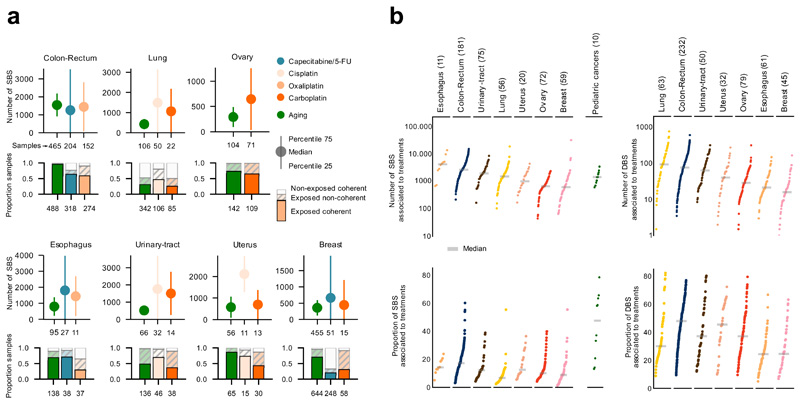
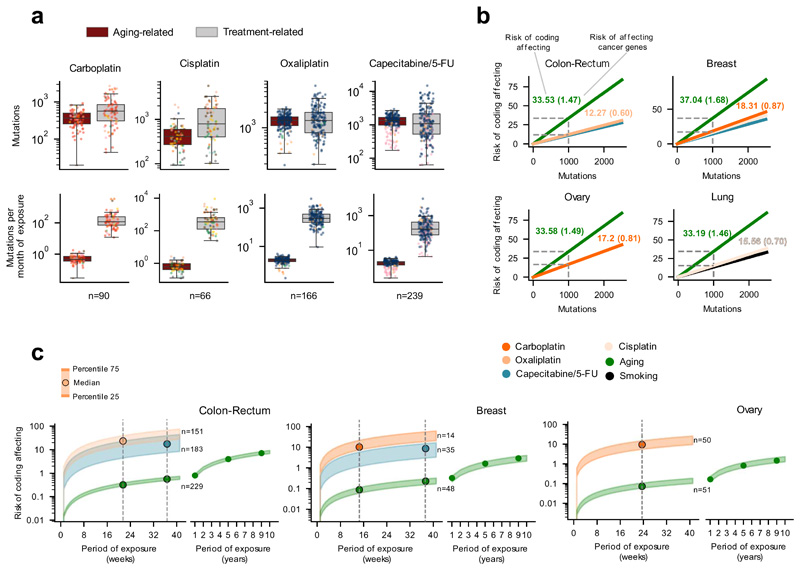
Some cancer therapies damage DNA and cause mutations in both cancerous and healthy cells. Therapy-induced mutations may underlie some of the long-term and late side effects of treatments, such as mental disabilities, organ toxicity and secondary neoplasms. Nevertheless, the burden of mutation contributed by different chemotherapies has not been explored. Here we identify the mutational signatures or footprints of six widely used anticancer therapies across more than 3,500 metastatic tumors originating from different organs. These include previously known and new mutational signatures generated by platinum-based drugs as well as a previously unknown signature of nucleoside metabolic inhibitors. Exploiting these mutational footprints, we estimate the contribution of different treatments to the mutation burden of tumors and their risk of contributing coding and potential driver mutations in the genome. The mutational footprints identified here allow for precise assessment of the mutational risk of different cancer therapies to understand their long-term side effects.


Conflict of interest statement

Competing interests statements

The authors declare no competing interests

Figures

Extended Data Fig.1
Extended Data Fig.1. Treatments administered to patients in the metastatic adult cohort
(a) Left: distribution of time elapsed since earliest treatment administered to patients in the metastatic adult cohort. Right: Distribution of time elapsed since latest treatment administered to patients in the metastatic adult cohort. (b) Left: exposure (binary Treated/Untreated) of tumors originated in different organs (rows labeled with color code introduced in Fig. 1 of the main paper) to drugs within different FDA classes (columns). The number of tumors exposed to each drug family are shown in Figure 2a. Right: exposure (binary Treated/Untreated) of tumors originated in different organs (rows) to selected chemotherapies (columns).
Extended Data Fig.2
Extended Data Fig.2. Treatment-associated signatures
(a) Equivalent to Fig. 2c of the main paper for signatures extracted using SigProfiler. The Carboplatin/Cisplatin-associated and the Capecitabine/5-FU signatures appears very close to significance (p-value=0.002 and p-value=0.001, respectively) and has thus been “rescued” as associated with the treatment. (b) Mutational profiles of SigProfiler-extracted SBS and DBS signatures associated to treatments. We show the cosine similarities of E-SBS1, E-SBS19, E-DBS5 against signatures SBS31, SBS17b and DBS5, respectively. (c) Strand asymmetry of selected SignatureAnalyzer-extracted signatures. Each dot corresponds to a signature, with the abscissa representing its replication strand bias and the ordinate, the transcriptional strand bias. Note that strand bias is calculated taking as reference the channels in the mutational profile. Therefore, UV light-, tobacco and platinum-related drugs-induced mutations all show asymmetry with respect to transcription in the same direction, but appear positive or negative in the graph due to the specifically base that suffers each damage in the first place.
Extended Data Fig.3
Extended Data Fig.3. Comparison of treatment-associated signatures extracted with SigProfiler and SignatureAnalyzer
(a) SignatureAnalyzer extracts four signatures for platinum based drugs, while SigProfiler extracts two. A linear combination of E-SBS21 and E-SBS25 extracted by SignatureAnalyzer and associated to Carboplatin and Cisplatin, yields a profile that is very similar to the signature associated with the same treatments extracted by SigProfiler (E-SBS1, cosine similarity 0.97). Similarly, a linear combination of E-SBS14 and E-SBS37, extracted by SignatureAnalyzer and associated to Cisplatin and Oxaliplatin, yields a similar profile to E-SBS20, extracted by SigProfiler and associated to Oxaliplatin (cosine similarity 0.85). (b) A linear combination of E-DBS3 and E-DBS9, extracted by SignatureAnalyzer and associated to platinum based drugs, yields a very similar profile to E-DBS5, extracted by SigProfiler and associated to the same drugs (cosine similarity 0.99). (c) The capecitabine-associated SBS signatures reconstructed by both methods are very similar (cosine similarity 0.99). (d) Oxaliplatin-related and capecitabine-related signatures extracted from colorectal tumors using a not-NMF approach compared to homologous signatures extracted using SignatureAnalyzer. Both signatures possess virtually identical profiles to those extracted using SignatureAnalyzer.
Extended Data Fig.4
Extended Data Fig.4. Mutational signatures associated to radiation and temozolomide
(a) HR-deficiency plays a key role in the appearance of an ID signature (SignatureAnalyzer-extracted) previously associated to radiation. Tumors in the top quartile of activity of HR signature (BRCAness signature) are considered HR-deficient, while tumors in the bottom quartile are deemed HR-proficient. The distribution of the number of IDs of this signature across HR-deficient and HR-proficient tumors either exposed or not exposed to radiation have been compared using a one-tailed Mann-Whitney test. (b) MMR or MGMT-deficiency plays a key role in the generation of a TMZ-associated SBS signature. Left panel represents the load of TMZ-associated SBS in tumors exposed or unexposed to TMZ separated by their MMR status (considered defective with at least one protein-affecting mutation in an MMR-related gene). Right panel represents the load of TMZ-related exonic SBS in recurrent glioblastomas in an independent cohort exposed or not exposed to TMZ. TMZ-treated, non-MMR-deficient tumours have been split into two groups based on the methylation status of the MGMT promoter.
Extended Data Fig.5
Extended Data Fig.5. The capecitabine/5-FU mutational footprint
(a) Association between a mutational signature and the treatment with capecitabine and/or 5-FU. The numbers in the table represent the p-value and effect size of the corresponding regression models testing the effect of both drugs separate or pooling the tumors exposed to either. The association between the signature and 5-FU treatment does not reach significance (p=0.07), but exhibits a large effect size. (b) Contribution of capecitabine and 5-FU to the mutation burden of colorectal (left) or breast (right) tumors exposed to either drug. The barplots represent the proportion of 5-FU- and capecitabine-exposed tumors with activity of the SBS Capecitabine/5-FU signature among samples treated with either drug. (c) Mutational profile of 5-FU-induced mutations in five resistant strains of Leishmania infantum. The profile was built with the mutations private to the strains after treatment with 5-FU (that is, after subtraction of the mutations found in the parental strain). (d) Contribution of SBS Capecitabine/5-FU signature and the previously reported 17b signature (Sig17b) to the mutation burden of colorectal and breast tumors either not exposed or exposed to capecitabine/5-FU.
Extended Data Fig.6
Extended Data Fig.6. Treatment-associated mutations occur late in tumor development
(a) Pairs of biopsies of the same patient taken before the start and during or after treatment are represented as a dashed line. The upward trajectory of patients treated longer supports the conclusion that the signatures associated to treatments through the regression are indeed the mutational footprint of the therapies. Dots correspond to tumors of organs of origin colored as in Figure 1b. (b) Mutations of SigProfiler-extracted signatures associated to treatments are enriched for later substitutions. Dots correspond to tumors of organs of origin colored as in Figure 1b. (c) Mutations of SigProfiler-extracted signatures associated to treatments are enriched for subclonal substitutions. Dots correspond to tumors of organs of origin colored as in Figure 1b. (d) Comparison (one-tailed Mann-Whitney test) of the number of treatment-related mutations (according to SigProfiler) contributed by different drugs between short-exposure and long-exposure tumors, as in Figure 2d. Dots correspond to tumors of organs of origin colored as in Figure 1b. (e) Comparison (one-tailed Mann-Whitney test) of the number of mutations contributed by different drugs between short-exposure and long-exposure tumors, as in Figure 2d. In this figure only tumors from patients whose treatment duration is not estimated by clinicians, but rather exactly recorded in charts are included. (f, g) The mutation load contributed by the aging signature (f, SignatureAnalyzer; g, SigProfiler) does not correlate with the time of exposure to treatments.
Extended Data Fig.7
Extended Data Fig.7. Selection of coherent tumors according to the activity of signatures attributed by both extraction methods
Left panels show the agreement of both methods in the attribution of the activity of treatment-associated signatures across tumors. Each pair of circles connected by a line represents the exposure attributed by both methods to a tumor. Red circles represent the exposure attributed by SigProfiler, while blue circles represent the exposure attributed by SignatureAnalyzer. Middle panels show the correlation (with Pearson’s r) between the exposure attributed by both methods to all tumors, while right panels present the correlation (with Pearson’s r) of the exposure attributed by both methods to coherent tumors (difference between relative exposures lower than 0.15).
Extended Data Fig.8
Extended Data Fig.8. The contribution of anti-cancer treatments to the mutation burden of tumors (according to SignatureAnalyzer)
(a) Comparison of the contribution of different treatments and the aging signature to the mutation burden of tumors originated in different organs. (b, c) Contribution in total number (upper) and proportion (lower) of all treatment-associated SBS (b) and DBS (c) to the mutation burden of metastatic tumors originated in different organs. (d) First column: distribution of the contribution of treatments (and the aging signature) to the mutation burden of tumors exposed to them. Second column: distribution of the contribution of treatments (and the aging signature) to the mutation burden of tumors during one month of exposure.
Extended Data Fig.9
Extended Data Fig.9. The contribution of anti-cancer treatments to the mutation burden of tumors (according to SigProfiler)
(a) Analogous to Extended Data Fig. 8a. (b, c) Analogous to Extended Data Fig. 8b,c. (d) Analogous to Extended Data Fig. 8d.
Extended Data Fig.10
Extended Data Fig.10. Risk of coding affecting mutations in cancer genes
(a) Contribution of treatment-associated signatures and aging signature to the mutational burden of metastatic tumors. The duration of the period of exposure is taken from the average duration of courses of treatment indicated in clinical guidelines (Supplementary Table 2). (b) Contribution of treatment-associated signatures and aging signature to the mutational burden of metastatic tumors. Only tumors from patients whose treatment duration is not estimated by clinicians, but rather exactly recorded in charts are included. (c) Risk of mutations affecting cancer genes (CGC) across tumors contributed by different signatures according to the duration of the exposure of tumors. (d) Risk of coding-affecting mutations contributed by treatment-associated and aging signatures. Vertical lines intersecting the risk value ranges are placed at the average duration of courses of treatment indicated in clinical guidelines (Supplementary Table 2). (e, f) Risk of coding-affecting mutations (e) and mutations affecting cancer genes (f) by treatment-associated and aging signatures. Vertical lines intersect the risk value ranges are placed at the average duration of courses of treatment of the subset of patients that were not estimated by clinicians, but rather exactly recorded in charts.
Figure 1
Figure 1. Mutational signatures active in metastatic tumors
(a) Tumor cells bear mutations at the time of treatment contributed by different mutational processes. Some treatments directly damage the DNA, while others alter the pool of nucleotides, potentially causing the death of a large number of cells. Surviving cells harbor treatment-induced mutations caused by unrepaired DNA damage, the consequences of misincorporated nucleotide analogs or introduced by error-prone polymerases during repair. These treatment mutations are private to each surviving cell after the first round of replication, have low variant allele frequencies (VAF), and are undetectable through bulk sequencing. Pre-treatment mutations are present at higher VAF. Some surviving cells may grow faster than their neighbors to occupy the space opened by massive death of tumor cells. Over time, these faster-growing cells will undergo clonal expansion and their progeny will represent a larger fraction of the population, effectively amplifying their genetic material within the tumor pool. At the time of biopsy of the metastasis, the VAF of treatment mutations present in the original surviving cells may rise above the threshold of detection of bulk sequencing. (b) Composition of the metastatic cohort in terms of organ of origin of the primary. The color code of organs of origin is used in subsequent figures. NET: Neuroendocrine tumors. (c) Example SBS, DBS and ID signatures extracted from the metastatic cohort using SignatureAnalyzer. The profiles of all signatures identified using both methods appear in the Supplementary Note and Supplementary Datasets.
Figure 2
Figure 2. Mutational signatures associated with anti-cancer treatments
(a) Distribution of treatments administered to donors in the metastatic cohort, grouped by organ of origin of the primary and FDA family. Stacked barplots at the right: number of metastatic tumors exposed to two example drugs. Due to complex regimens, donor-therapy pairs counted add up to more than the total number of tumors in panel b. (b) Schematic representation of the ensemble regression model (Methods). Tumors from different organs (colors immediately above the heatmap) may be exposed or not to a treatment (X). One thousand balanced subsets of tumors exposed and not exposed to X are randomly sampled from this matrix stratified by organ of origin and then classified using a logistic regression. The effect size of the regression model for each signature is computed as the fold change between the mean exposure of treated and untreated tumors. The results are filtered to discard spurious associations explained by co-treatment regimens. (c) Treatment-associated mutational signatures (extracted with SignatureAnalyzer). Each dot represents one of the 7,465 signature-treatment pairs tested. Associations deemed significant (effect size > 2 and p-value < 0.001) not explained by co-treatments are highlighted. Associations are detected in organ-specific regressions or through the analysis of the entire metastatic adult cohort. The carboplatin-associated signature in ovary and the capecitabine- associated signature in colorectal are “rescued”, as they appear very close to significance (p-value = 0.001). Full results are in Supplementary Table 1 and Supplementary Datasets.
Figure 3
Figure 3. Treatment-associated mutational signatures
(a) Mutational profiles (frequency of each tri-nucleotide change) of the six SBS and DBS signatures (in the SignatureAnalyzer extraction) associated with platinum-based treatments through the regression model. Ad hoc names following their associated therapies are given to each signature. In parentheses are the names of the corresponding previously known signatures (with cosine similarity of at least 0.8). (b) Mutational profiles of the signature associate with Capecitabine/5-FU (c) Mutational profile (frequency of each tri-nucleotide change) of the private mutations (not present in the parental cell) of five mutant Leishmania infantum strains treated with 5-FU; there is high similarity to the SBS capecitabine signature shown in panel (b). The empirical p-value has been derived from 1,000 randomly generated signatures (see Methods). SBS, single base substitutions; DBS, double base substitutions; 5-FU, 5-fluorouracil.
Figure 4
Figure 4. Characteristics of treatment-associated mutations
(a) Mutations contributed by signatures associated with treatments are enriched for later clonal substitutions (higher late-to-early clonal mutations fold change), in comparison to signatures that are active earlier or throughout the lifetime of patients (e.g., aging and smoking-related signatures). Each tumor is represented as a dot colored following the code of organ-of-origin presented in Figure 1a. In these and all other boxplots in subsequent figures, the box delimits the second and third quartiles (separated by the line representing the median) and the whiskers show the rest of the distribution, except outliers. (b) Mutations contributed by signatures associated to treatments are also enriched for subclonal substitutions in comparison to signatures active earlier or throughout the lifetime of patients. (c) Higher mutation load contributed by treatment-associated signatures (extraction with SignatureAnalyzer) in patients with longer periods of treatment. Comparison of the distribution of the number of SBS (upper row) and DBS (lower row) of signatures associated with each drug in tumors from patients with shorter period of treatment (ST - low quartile) and patients with longer period of treatment (LT - high quartile). Tumors of organ of origin with sufficient mutations to carry out the comparison are shown. In every case, LT tumors possess significantly more mutations than ST tumors (one-tailed Mann-Whitney test).
Figure 5
Figure 5. The contribution of anti-cancer treatments to the mutation burden of tumors
(a) Comparison of the contribution of different treatments and the aging signature to the mutation burden of tumors. Only tumors in which the activity of signatures according to SignatureAnalyzer and SigProfiler is coherent (difference of relative exposures under 0.15) are included in the contribution plots (Supplementary Note, Extended Data Fig. 7). Numbers in the x-axis represent the tumors that have coherent activity across methods included in each plot. The plots represent the median contribution of signatures to the burden of coherent tumors (filled circle), and the interquartile range of the distribution (whiskers). In the stacked bar plots below each graph, the fraction of all tumors exposed to the treatment that are coherent are colored, while the fraction of tumors with activity according to only one method or with incoherent activity is filled with diagonal lines. For example, the 318 colorectal tumors treated with the drug show activity of the Capecitabine/5-FU signature according to either method. The exposure computed by both is coherent in 64% of them (204). (b) Contribution in total number (upper) and proportion (lower) of all treatment-associated SBS (left) and DBS (right) to the mutation burden of metastatic tumors. Only coherent tumors are included in these plots (numbers in parentheses). A separate column in the left graph presents the activity of cisplatin-associated signatures in 10 metastatic samples of four pediatric patients (Methods).
Figure 6
Figure 6. The mutational risk of anti-cancer treatments
(a) Contribution (in total or averaging per month of exposure) of treatment-associated signatures and the aging signature to the mutation burden of metastatic tumors. Each tumor is represented as a dot colored following the code of organ-of-origin presented in Figure 1b. (b) Risk (number of mutations) of several signatures of producing coding-affecting mutations estimated from their contribution to the mutation burden of tumors (Methods). Lines corresponding to tumors originated in different organs represent the linear relationship between the total contribution of signatures and their coding-affecting risk. Dashed lines mark the coding-affecting risk (spelled-out by numbers above the lines) for a contribution of 1,000 mutations. In parentheses, risk of signatures of causing mutations affecting known cancer genes (Methods). (c) Risk of coding affecting mutations contributed by different signatures according to the duration of the exposure to the associated drugs. Risk values are represented as a range spanning between the 25th and the 75th percentile of the distribution of contribution of signatures to the burden of tumors in four weeks of exposure (panel a). Vertical lines intersecting these risk value ranges are placed at the median of the distribution of times of exposure of all tumors of the given organ or origin to a given drug. The range of values of risk for the mutations contributed by the aging signature is extended several years to the right of the graph.

References

    1. Martincorena I, Campbell PJ. Somatic mutation in cancer and normal cells. Science. 2015;349:1483–1489. - PubMed
    1. Alexandrov LB, et al. Signatures of mutational processes in human cancer. Nature. 2013;500:415–21. - PMC - PubMed
    1. Alexandrov L, et al. The Repertoire of Mutational Signatures in Human Cancer. bioRxiv. 2018 doi: 10.1101/322859. 322859. - DOI
    1. Nik-Zainal S, et al. The genome as a record of environmental exposure. Mutagenesis. 2015;30:763–770. - PMC - PubMed
    1. Helleday T, Eshtad S, Nik-Zainal S. Mechanisms underlying mutational signatures in human cancers. Nat Rev Genet. 2014;15:585–598. - PMC - PubMed

Publication types

Substances