. 2019 Dec;51(12):1691-1701.
doi: 10.1038/s41588-019-0526-4. Epub 2019 Nov 18.

Chromatin establishes an immature version of neuronal protocadherin selection during the naive-to-primed conversion of pluripotent stem cells

Affiliations

Chromatin establishes an immature version of neuronal protocadherin selection during the naive-to-primed conversion of pluripotent stem cells

Angels Almenar-Queralt et al. Nat Genet. 2019 Dec.

Abstract

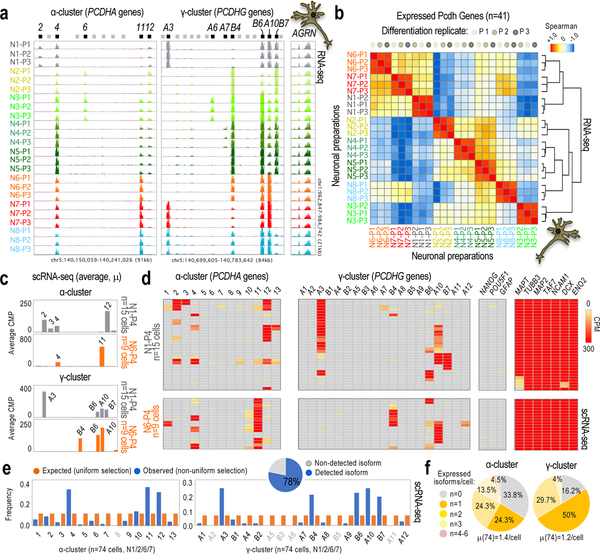
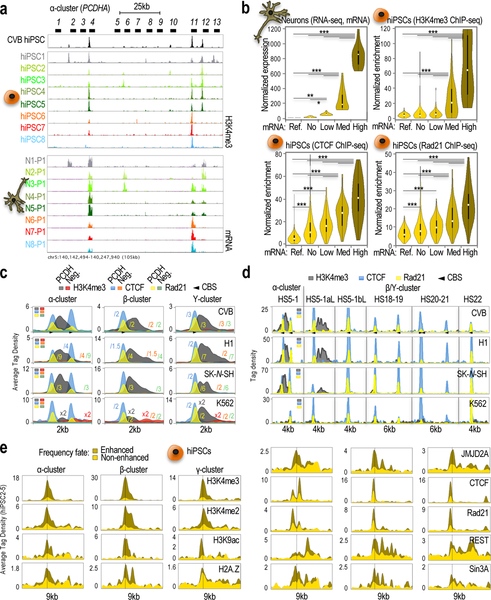
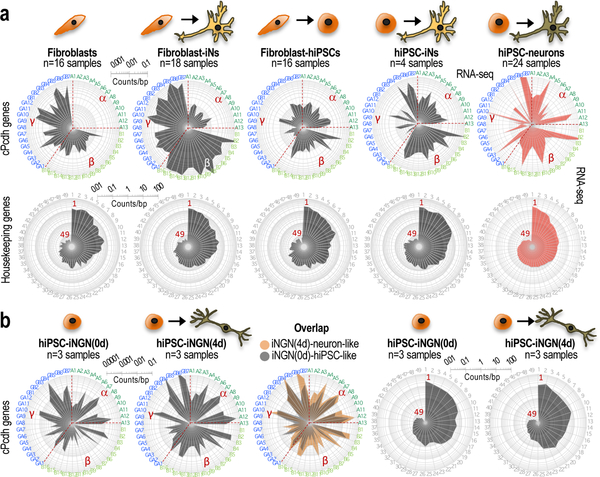
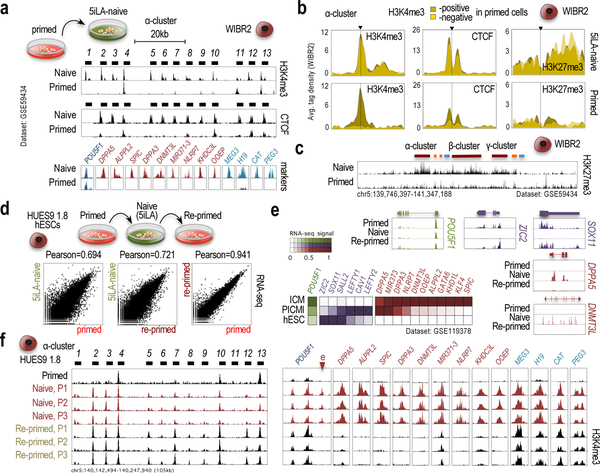
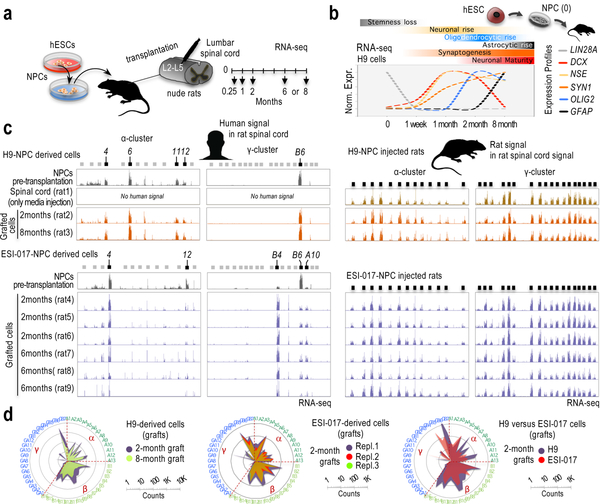
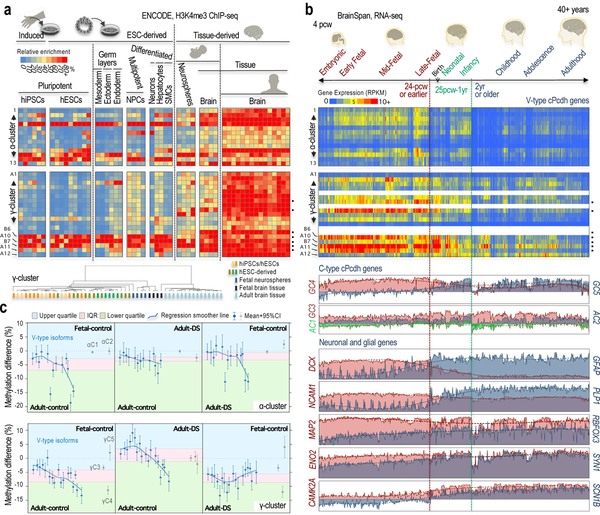
In the mammalian genome, the clustered protocadherin (cPCDH) locus provides a paradigm for stochastic gene expression with the potential to generate a unique cPCDH combination in every neuron. Here we report a chromatin-based mechanism that emerges during the transition from the naive to the primed states of cell pluripotency and reduces, by orders of magnitude, the combinatorial potential in the human cPCDH locus. This mechanism selectively increases the frequency of stochastic selection of a small subset of cPCDH genes after neuronal differentiation in monolayers, 10-month-old cortical organoids and engrafted cells in the spinal cords of rats. Signs of these frequent selections can be observed in the brain throughout fetal development and disappear after birth, except in conditions of delayed maturation such as Down's syndrome. We therefore propose that a pattern of limited cPCDH-gene expression diversity is maintained while human neurons still retain fetal-like levels of maturation.


Conflict of interest statement

COMPETING INTERESTS STATEMENT

Martin Marsala is the scientific founder of Neurgain Technologies, Inc. and has an equity interest in the company. In addition, Martin Marsala serves as a consultant to Neurgain Technologies, Inc., and receives compensation for these services. The terms of this arrangement have been reviewed and approved by the University of California, San Diego in accordance with its conflict of interest policies.

Figures

Fig. 1:
Fig. 1:. Non-uniform probability of cPcdh selection in hiPSC-derived neurons.
a, RNA-seq data showing α/γ-cPcdh expression in three independent differentiation replicates (n=3, P1–P3) of neurons generated from NPCs derived from n=8 different single-cell-derived hiPSC subpopulations (hiPSC1–8). AGRN expression shown as reference. Expressed/non-expressed 5’ α/γ-cPcdh exons indicated (black and grey bars, respectively). Genomic coordinates: hg18. Scale: identical in all tracks. See some quantifications in Supplementary Fig. 1c. b, Hierarchical clustering (Spearman-rank correlation) and correlation matrix analyses based on expressed cPcdh genes in at least one neuronal preparation (n=41 out of 48) based on a (5’-exon-only signal). Analysis shows co-segregation of differentiation replicates in cPcdh expression. Color code: maximum (+1) to minimum similarity (−1). c,d, Expressed α/γ-cPcdh genes in n=15 single N1 cells and n=9 single N6 cells from a fourth differentiation replicate (P4). Data based on scRNA-seq (counts per million, or CPM). Data shown as an average of single cells (in c) or as individual cells (in d). Comprehensive heatmap shown in Supplementary Fig. 3a. Markers: pluripotency (NANOG and POU5F1), glial (GFAP), and neuronal (MAPT, TUBB3, NCAM1, DCX, and ENO2) genes. e, Observed (non-uniform) versus expected (uniform) distribution of random cPcdh selections in single hiPSC-derived neurons (combining n=15 N1, n=38 N2, n=9 N6, and n=12 N7 cells; scRNA-seq in Supplementary Fig. 3a). X2-test, P-value=2.2e-16. The pie graph represents the fraction of α/γ-cPcdh isoforms (out of n=48) detected in at least one single neuron (n=74 cells). f, Number and average (μ) of expressed α/γ-cPcdh isoforms by neuron (scRNA-seq, n=74 cells).
Fig. 2:
Fig. 2:. Chromatin in hiPSCs mirrors expression in hiPSC-derived neurons.
a, ChIP-seq data showing H3K4me3 accumulation along the α-cPcdh cluster in the parent CVB hiPSC line and the n=8 different single cell-derived sublines (hiPSC1–8) matched with RNA-seq data showing α-cPcdh expression in n=8 hiPSC1–8-derived neurons (N1–8 P1; data from Fig. 1a). Scales=set to maximum (ChIP-seq) or identical (RNA-seq); 5’ α-cPcdh exons and genomic coordinates (hg18) indicated. b, Violin plots of matching RNA-seq signal (top-left; n=3 differentiation replicates for N1–8, n=24), H3K4me3 ChIP-seq signal (top-right, one culture from each subline; hiPSC1–8, n=8), CTCF ChIP-seq signal (bottom-left; two independent cultures from each subline; hiPSC1–8, n=16), and Rad21 ChIP-seq signal (bottom-right; two independent cultures from each subline; hiPSC1–8, n=16) stratified by groups based on neuronal expression levels (top-left). Groups: non-neuronal genes (n=11; “Ref”); “non”-expressed cPcdhs (n=193 out of 384, or 48×8); “low”-expressed cPcdhs (n=72); “medium”-expressed cPcdhs (n=57); and, “high”-expressed cPcdhs (n=26). One-way ANOVA, multiple comparison test, P-value<0.01 (*), <0.001 (**), or <0.0001 (***). Shown median, interquartile range (25th and 75th). Error bars represent 95% confidence intervals. c,d, 2/4/6kb-wide meta-profiles of H3K4me3/CTCF/Rad21 ChIP-seq averaged tag density along cPcdh promoters by cluster (in c), or at distal regulatory sites (in d) in the indicated cultures (experiments as in b). “Neg” represents random coordinates. Scale adjustments indicated (e.g. x2 and /2 refer to signal multiplied/divided by 2, respectively). CTCF sites/orientation indicated. e, 9-kb-wide meta-profiles of ChIP-seq data for activating and repressive components (n=4 ChIP experiments [hiPSC2–5] for component). Promoters segregated by H3K4me3 enrichment/non-enrichment (enhanced/non-enhanced, respectively).
Fig. 3:
Fig. 3:. In vitro-generated neurons inherit cPcdh-locus features from non-neuronal cells.
a, Log10-scale radar plots showing averaged RNA-seq data for the n=48 stochastically selected cPcdh genes (top) and n=49 housekeeping genes (bottom) in the indicated neuronal preparations (iNs or hiPSC-derived neurons) and progenitor somatic or pluripotent cells (skin fibroblasts or hiPSCs, respectively). Number of independent cultures indicated on top of each plot. See a detailed description in Supplementary Note. Data source: this study (right plots) and E-MTAB-3037 (the rest). Clockwise, cPcdh genes are shown in numerical and alphabetical order by clusters (color-coded in the periphery). b, Log10-scale radar plots showing averaged RNA-seq data for the n=48 stochastically selected cPcdh genes (the three left plots) and n=49 housekeeping genes (the two right plots), as in a. iNGN refers to iNs generated by neurogenin overexpression in hiPSCs, which is an alternative protocol of direct neuronal reprogramming to the protocol applied to derive iNs in a (data source: GSE60548). The middle plot is an overlap of the two radar plots shown on the left side. The number of independent cell cultures is indicated on top of each panel. See a more detailed description of these experiments in Supplementary Note.
Fig. 4:
Fig. 4:. Differences in cPcdh-locus chromatin organization between naive and primed cells.
a, ChIP-seq data showing H3K4me3 and CTCF accumulation along the α-cluster (top/center panels; 5’-cPcdh exons indicated) and ChIP-seq data showing H3K4me3 accumulation on promoters regulating pluripotency (in blue), preimplantation (in red), and imprinted (in green) genes in 6iLA-naive and primed WIBR2 hESCs. Data source: GSE59434 and GSE69646. b, 9kb-wide meta-profiles of H3K4me3, CTCF, and H3K27me3 ChIP-seq signal on the n=13 α-cPcdh promoters in naive and primed WIBR2 hESCs. Promoters segregated by H3K4me3 enrichment in primed cells: H3K4me3-enriched (positive) or non- H3K4me3-enriched (negative). Data source: GSE59434 and GSE69646. c, H3K27me3 ChIP-seq signal along the cPcdh locus in 6iLA-naive and primed WIBR2 hESCs. Data source: GSE59434. d, Full transcriptome-wide comparisons of expression profiles (RNA-seq) between a culture from each of the listed pluripotency states (primed, 5iLA-naive, and re-primed) in HUES9 1.8 cells. Pearson correlation of the comparison (Refseq genes) indicated on top. e, RNA-seq tracks of relevant genes in the data shown in d. Pluripotency (in green), preimplantation (in red), and postimplantation (in blue) genes. Heatmap of RNA-seq signal of three independent cultures (each) of human ICM embryos, PICMI, and hESCs (data source: GSE119378). f, H3K4me3 ChIP-seq signal along the α-cluster and on preimplantation and imprinted promoters in primed (n=1), naive (n=3), and re-primed (n=3) single-cell-derived HUES9 1.8 hESCs. 5’ cPcdh exons indicated on top. Markers: pluripotency (in black, POU5F1 promoter), preimplantation (in red, including an enhancer [e] in the POU5F1 locus); and imprinted promoters (in green). Genomic coordinates (hg18).
Fig. 5:
Fig. 5:. Signs of hESC-guided cPcdh signatures are remarkably stable in vitro and in vivo.
a, Experimental scheme. b, Relative and normalized RNA-seq signal in H9-derived NPCs prior transplantation (“0”, n=2 samples) and in grafted cells after transplantation, 1 week or 1/2/8 months, as indicated (one rat at each time point). Profiles normalized to 1 (maximum expression for each gene). RNA-seq values and additional genes are shown in Supplementary Fig. 18a. Markers: LIN28A (NPC identity); ENO2 (neuronal identity); DCX (early postmitotic neurons); SYN1 (synaptogenesis); GFAP (astrocytic identity); and, OLIG2 (oligodendrocytic identity). c, RNA-seq signal along the human α-cluster (first column) and γ-cluster (second column), and along the rat α-cluster (third column) and γ-cluster (fourth column) in H9-NPC engrafted cells and surrounding rat cells in the spinal cord, respectively (top) and ESI-017-NPC engrafted cells and surrounding rat cells in the spinal cord, respectively (bottom). Rat and human reads were computationally separated and independently aligned to the rat and human genomes, respectively. Samples: hESC-derived NPCs prior transplantation (n=2), media-only-injected spinal cord (n=1), and 2, 6 or 8-month engrafted cells, as indicated (a rat at each time point in H9-NPC injected cases and n=3 rats at each time point in ESI-017-NPC injected cases). 5’ cPcdh exons indicated on top; expressed exons highlighted in black. Y-axis is adjusted to max in each track. d, Log10-scale radar plots of averaged RNA-seq signal for the n=48 stochastically selected cPcdh genes in the indicated conditions. (clockwise, in numerical/alphabetical order by clusters, color-coded in the periphery).
Fig. 6:
Fig. 6:. Two distinct types of cPcdh diversity distinguish fetal and adult brain tissues.
a, Heatmap, H3K4me3 ChIP-seq signal on α/γ-cPcdh promoters relative to the highest enrichment observed in each sample (as a percentage over max, or 100%). Sample scheme on top, samples listed in Supplementary Fig. 19a. Postmortem human brains: fetal, n=2 donors, gestational stage=17-pcw, or post-conception weeks; fetal, germinal matrix, n=2 donors, 20-pcw; and, adult brain, n=3 donors, range=73–81 year-old, n=7 independent samples. Neurospheres from postmortem fetal brain, n=4 donors, range=15–17-pcw. The most H3K4me3-enriched γ-promoters in human fetal brains are indicated (black dots). Dendrogram, hierarchical clustering analysis of the same samples shown in the heatmaps; one minus Spearman-rank correlation. Samples color-coded by source. b, Heatmap, RNA-seq signal (RPKM, exonic, BrainSpan cohort) of α/γ-cPcdh genes in the n=524 postmortem samples of the human developing and adult brain (ranging from 4-pcw to 40+ years of age and a variety of different brain regions42). Data not available for four γ-isoforms (in blank). Profiles, RNA-seq signal (RPKM, BrainSpan) for non-stochastically selected cPcdhs and neuronal and glial markers. The most H3K4me3-enriched γ-promoters in fetal brains are highlighted (black dots). c, Mean differential methylation with 95% confidence intervals (CI) on stochastically selected (blue circles) and non-stochastically selected (grey circles) α/γ-promoters (top/bottom panels) in postmortem brain samples of control and Down syndrome subjects, as indicated in the upper/lower side of each panel (sample numbers and additional labeling provided in Supplementary Fig. 21; Supplemental Note). Background colored based on interquartile range (IQR, pink) and upper/lower quartiles (blue/green) of stochastically selected promoters.

References

    1. Gul IS, Hulpiau P, Saeys Y & van Roy F Evolution and diversity of cadherins and catenins. Exp. Cell Res. 358, 3–9 (2017). - PubMed
    1. Hirayama T & Yagi T Regulation of clustered protocadherin genes in individual neurons. Semin. Cell Dev. Biol 69, 122–130 (2017). - PubMed
    1. Peek SL, Mah KM & Weiner JA Regulation of neural circuit formation by protocadherins. Cell. Mol. Life Sci 74, 4133–4157 (2017). - PMC - PubMed
    1. Mountoufaris G, Canzio D, Nwakeze CL, Chen WV & Maniatis T Writing, Reading, and Translating the Clustered Protocadherin Cell Surface Recognition Code for Neural Circuit Assembly. Annu. Rev. Cell Dev. Biol 34, 471–493 (2018). - PubMed
    1. Rubinstein R, Goodman KM, Maniatis T, Shapiro L & Honig B Structural origins of clustered protocadherin-mediated neuronal barcoding. Semin. Cell Dev. Biol 69, 140–150 (2017). - PMC - PubMed

Publication types

MeSH terms