. 2020 Jan;38(1):66-75.
doi: 10.1038/s41587-019-0299-4. Epub 2019 Nov 18.

In situ readout of DNA barcodes and single base edits facilitated by in vitro transcription

Affiliations

In situ readout of DNA barcodes and single base edits facilitated by in vitro transcription

Amjad Askary et al. Nat Biotechnol. 2020 Jan.

Erratum in

Abstract

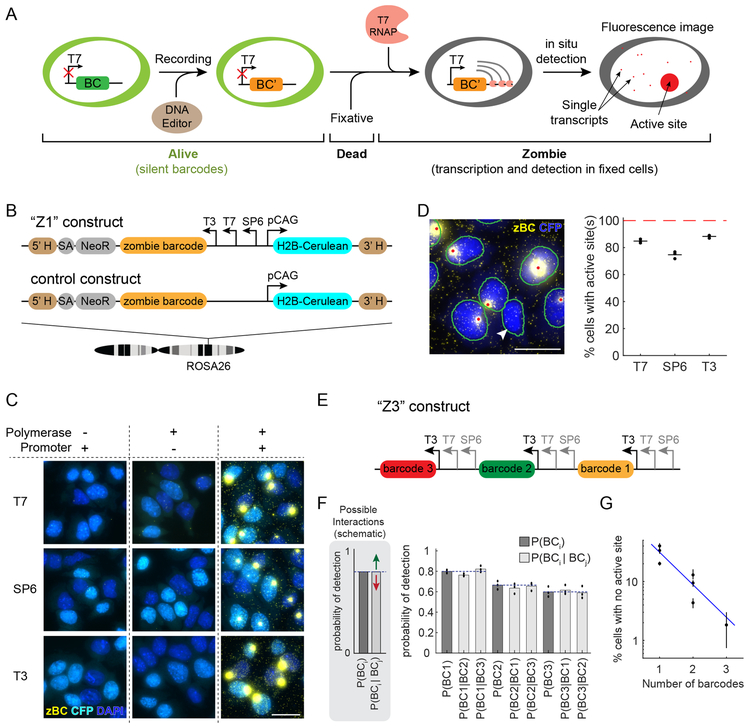
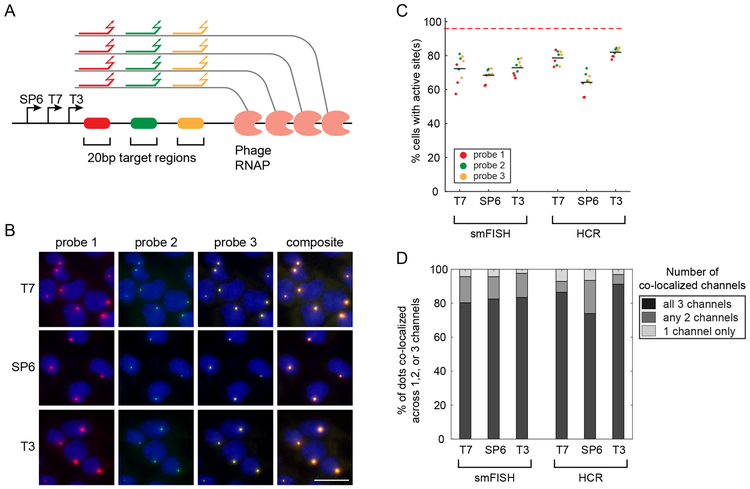
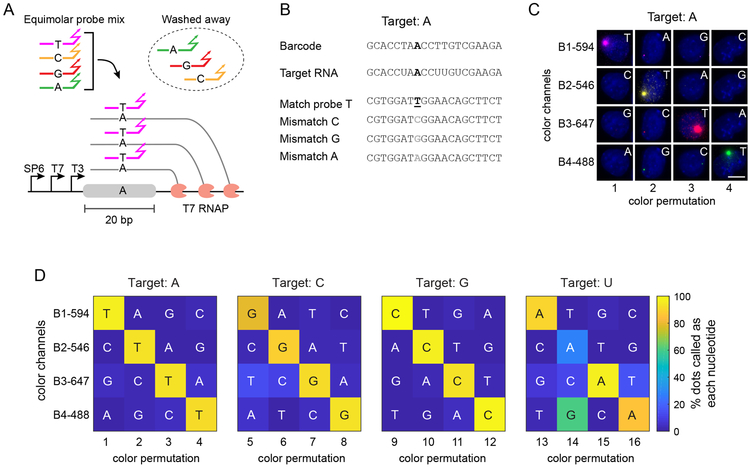
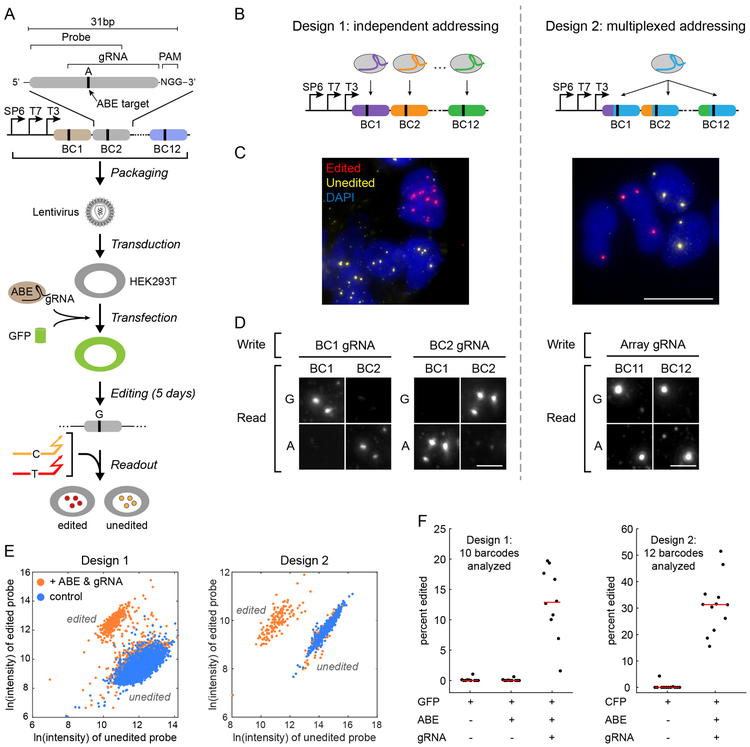
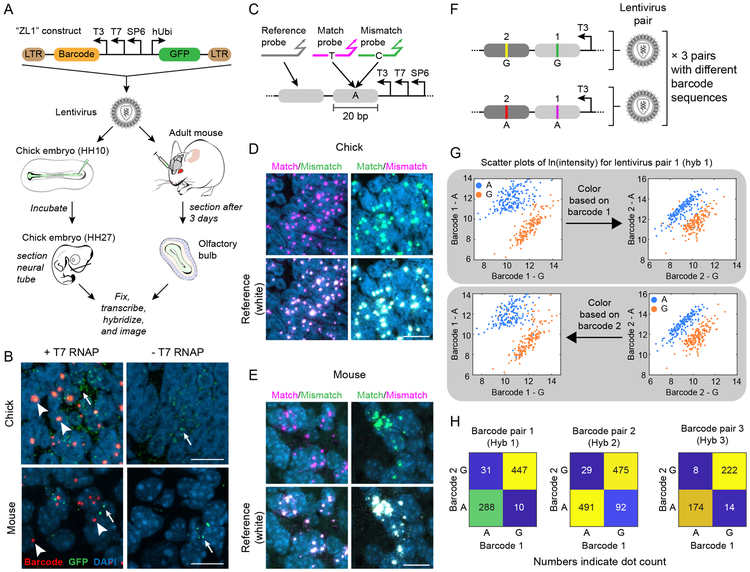
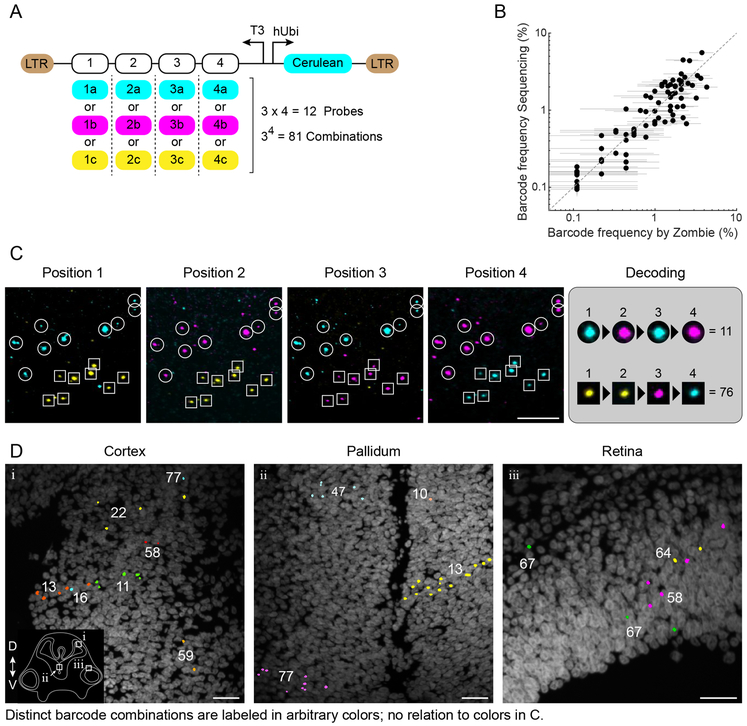
Molecular barcoding technologies that uniquely identify single cells are hampered by limitations in barcode measurement. Readout by sequencing does not preserve the spatial organization of cells in tissues, whereas imaging methods preserve spatial structure but are less sensitive to barcode sequence. Here we introduce a system for image-based readout of short (20-base-pair) DNA barcodes. In this system, called Zombie, phage RNA polymerases transcribe engineered barcodes in fixed cells. The resulting RNA is subsequently detected by fluorescent in situ hybridization. Using competing match and mismatch probes, Zombie can accurately discriminate single-nucleotide differences in the barcodes. This method allows in situ readout of dense combinatorial barcode libraries and single-base mutations produced by CRISPR base editors without requiring barcode expression in live cells. Zombie functions across diverse contexts, including cell culture, chick embryos and adult mouse brain tissue. The ability to sensitively read out compact and diverse DNA barcodes by imaging will facilitate a broad range of barcoding and genomic recording strategies.


Figures

Figure 1.
Figure 1.. Phage RNA polymerases enable in situ readout of DNA barcodes without in vivo expression.
(A) Workflow for analysis of Zombie barcodes (left to right). First, barcode constructs containing a phage promoter, such as T7, that is inactive in live cells, are integrated in the genome. Second, and optionally, base editors or other DNA modifying enzymes (brown) can alter barcode sequence to increase barcode diversity. Third, cells are fixed and phage RNA polymerase (pink) is added. This enables transcription of the barcode to RNA (gray lines). RNA transcripts accumulate at the active site (large red dot), and also diffuse away from it (small red dots represent individual transcripts). (B) The Z1 construct was engineered to contain a barcode downstream of T3, T7, and SP6 phage promoters, and to express H2B-Cerulean fluorescent protein (CFP) in living cells from a divergently oriented mammalian promoter. Z1 was stably integrated in mouse ES cells at the ROSA26 locus (single integration per genome). This line was compared to a similar cell line containing the control construct lacking phage promoters. (C) Polyclonal control cells and Z1 cells (columns) were imaged with or without the indicated phage polymerases (rows). HCR was used to detect barcode RNA (zBC). Nuclei are visualized by native fluorescence of H2B-CFP (cyan) as well as DAPI staining (blue). Barcode transcripts appear only in Z1 cells with phage polymerase (yellow dots, right column). The experiment was independently repeated twice with similar results. Scale bar is 25 μm. (D) In monoclonal cultures, active sites can be detected in most cells (image). Nuclei (blue) and active sites (yellow) are segmented automatically (green outlines and red dots, respectively). One cell in this field of view does not show any active site (arrowhead). Scale bar is 25 μm. Percentages of cells with detectable active sites for each polymerase are shown on the right. Horizontal lines indicate the mean of replicates (n=3 biologically independent samples). Total of 3916 cells were analyzed, with at least 420 cells for each replicate. (E) The Z3 construct encodes three 900bp barcodes, each expressed from a distinct set of phage promoters. This construct was integrated at ROSA26, transcribed using T3 RNA polymerase, and imaged in all three color channels. T7 and SP6 promoters are shaded gray because they are not used in (F) and (G). Sizes of elements are not drawn to scale. (F) Schematic: Assuming independence, the conditional probability of detecting barcode i in a cell, given detection of another barcode (j), should equal the overall probability of barcode i detection, with deviations signifying either synergy (green arrow) or interference (red arrow) between barcodes. Bar plot: for Z3, the conditional probability analysis shows independent detection events for all three barcodes. Bars indicate mean of 3 replicates (points). (G) Fraction of Z3 cells with no detectable active sites declines with the number of barcodes analyzed, consistent with independent expression of different phage promoters in the same cell. Thus, detection efficiency can be increased with additional barcode copies. Dots represent the mean for different barcodes or barcode combinations and black vertical lines show the range over three replicates. Blue line indicates the exponential fit. Total of 564 cells were analyzed for plots in F and G.
Figure 2.
Figure 2.. Reliable detection of short barcodes.
(A) Short probes (colored lines) target 20bp regions of the larger Z1 barcode sequence and can be detected in distinct fluorescence channels. Local accumulation of transcripts at the active site effectively amplifies signal and enables detection, even with a single probe per target site. (B) Z1 cells were treated with each polymerase (rows) and imaged in three channels (columns) after detection with individual fluorescently labeled probes (colors matching those in A). Final column shows composite images. The barcode in Z1 cells is integrated site-specifically at the ROSA26 locus. The experiment was independently repeated three times with similar results. Scale bar is 25 μm. (C) Signal from each individual probe can be detected in the majority of the cells by smFISH or HCR. Plot shows the percentage of Z1 cells with active sites detected using a single 20bp probe. Dots are color-coded based on probe identity. n=3 biologically independent samples. Lines show the average efficiency over three probes and three replicates. (D) Colocalization analysis shows that the majority of dots colocalize in multiple channels, indicating the reliability of single probe detection. For each condition, gray shades indicate fractions of dots that are detected in only 1 channel or co-detected in 2 or 3 channels. Data from three biologically independent samples are combined in each condition. For plots in C and D, total of 5097 cells were analyzed, with at least 669 cells for each condition.
Figure 3.
Figure 3.. Probe competition accurately discriminates single nucleotide variants.
(A) Perfect match probes outcompete those with a single mismatch when an equimolar mixture of all 4 probe variants is used. This feature can be used to detect SNVs in situ. (B) Sequences of barcode, target RNA, and probes with SNV position indicated in bold underline (match) and brown (mismatch). (C) Representative images of Z1 cells showing detection of the correct target nucleotide in the barcode (see panel D for quantification of the results and Fig. S6 for representative images of other target nucleotides). All images were acquired under the same conditions and displayed with identical processing parameters for each channel (row). Each column represents one experiment in which four probes with a SNV and orthogonal HCR initiators (B1-4) were mixed and hybridized to the sample with the indicated color permutation. Letters indicate the probe variant in each image. HCR initiator and the fluorescence channel used for each probe are shown next to the rows. The barcode in Z1 cells is integrated site specifically in ROSA26 locus. Scale bar is 10 μm. (D) Probe competition can detect all four target nucleotides. Each matrix represents SNV analysis with four distinct color permutations, as in (C), with the indicated target nucleotide at distinct positions. For targeting U (right-most matrix), one permutation (14) is ambiguous due to wobble base pairing, but others (e.g. 15) provide accurate discrimination. Color scale represents the percentage of dots in which the indicated color channel has the highest rank of normalized brightness (see Methods). Total of 4009 cells were analyzed, with at least 135 cells for each color permutation.
Figure 4.
Figure 4.. CRISPR base edits can be read out in situ.
(A) Arrays of 12 barcodes were designed so that, in each barcode, a single base pair (black vertical line) can be targeted by the adenine base editor (ABE) and a gRNA. The barcode arrays were packaged in lentivirus and transduced into HEK293T cells. ABE7.10, gRNA, and a fluorescent co-transfection marker (e.g. GFP), were transiently delivered as DNA into the cells, and editing was allowed to occur for 5 days. Finally, cells were fixed, treated with T3 RNA polymerase and read out by competing probes for original (orange) and edited (red) base variants. (B) Two designs of the memory array. Design 1 allows each barcode to be edited independently by a distinct gRNA, whereas all barcodes in design 2 are targeted by the same gRNA, providing more memory states for an individual gRNA. In both designs, the state of each individual barcode can be readout in situ, using Zombie. (C) Representative images, for design 1 (left) and design 2 (right), showing a mixture of edited (red) and unedited (yellow) active sites. Since barcodes are delivered by lentiviral transduction, cells can carry multiple copies of the barcode in their genome. The experiment was independently repeated twice with similar results. Scale bar is 10 μm. (D) Each barcode in design 1 (left) can be addressed independently using its corresponding gRNA. 2×2 matrices show results of targeting distinct barcodes. Edits are seen at the targeted barcode but not the adjacent non-targeted barcode. In contrast, design 2 gRNA (right) can edit all barcodes. The experiment was independently repeated twice with similar results. Scale bar is 3 μm. (E) Analysis of Barcode 1, Design 1 (left) and Barcode 10, Design 2 (right). Dots can be classified into distinct edited and unedited groups based on the signal intensity in edited and unedited channels. Scatter plots show the natural log of the intensity in edited versus unedited channels. Data from negative control samples (blue) are plotted on top of points from samples which received both ABE7.10 and gRNA plasmids. See Figures S9-10 for all barcodes in both designs. (F) Edits are detected when both ABE and gRNA are present. Each point represents one barcode, red lines show the median. Without ABE and barcode-specific gRNA, only a very small fraction of active sites are mis-identified as edited, indicating low false positive rates across barcodes. Note that editing rates differ among barcodes (vertical scatter). On average 1357 and 383 active sites were analyzed for each barcode at each condition, for design 1 and 2, respectively.
Figure 5.
Figure 5.. Zombie can detect barcodes and discriminate single nucleotide variants in chick embryo and adult mouse brain.
(A) The ZL1 construct includes a barcode downstream of phage promoters and a human Ubiquitin C promoter (hUbi) controlling GFP expression to allow identification of transduced cells. ZL1 was packaged in lentivirus and injected into the olfactory bulb of a 3 month old mouse or chick neural tube at embryonic stage HH10. Chick embryos were incubated for 3 days post-transduction, until stage HH27, and then frozen and sectioned for analysis of the neural tube. Mouse brains were frozen and sectioned 3 days post-transduction to analyze olfactory bulb. Both samples were then fixed, treated with T7 RNA polymerase, probed, and imaged. (B) In coronal sections through the diencephalon of chick embryos, we observed distinct active sites (arrowheads) with, but not without, transcription by T7 RNA polymerase. Similarly, Zombie active sites could also be detected, in a T7 dependent manner, in the granular cell layer of the olfactory bulb (arrowheads). Although the expression of GFP, detected by HCR, was sparse (arrows), the injection site could still be identified. All experiments were repeated on at least 3 sections with similar results. (C) To test for detection of single base pair mismatches in mouse and chicken tissue sections, samples were hybridized with match and mismatch probes (pink and green, respectively). A reference probe independently identified the active sites. (D, E) In both chicken and mouse samples, fluorescent signal at active sites was dominated by the match probe, regardless of channel assignments (columns). Match probes also co-localized with reference channels (bottom rows), indicating competition between match and mismatch probes does not reduce overall detection efficiency. All experiments were repeated on at least 3 sections with similar results. Since barcodes are delivered by lentiviral injection, cells can carry multiple copies of the barcode in their genome. Scale bars are 10 μm. (F) Pairs of barcoded lentiviral vectors were used to further assess the SNV detection capability in vivo. Each virus contains two distinct 20bp barcodes, denoted by 1 and 2. Within a pair, viruses have variants of these barcodes that differ with each other at only one base pair (A or G). A mix of three viral pairs, with different barcode sequences but the same SNV arrangement, was co-injected in the mouse olfactory bulb and read out in three rounds of hybridization and imaging, 12 days post-transduction. (G) Scatter plots showing natural log of signal intensity for two variants (A and G) of two barcodes (1 and 2) for lentivirus pair 1 (See Fig. S12 for the other pairs). Each point represents one active site. The points are color coded based on their barcode 1 state (top) or barcode 2 state (bottom) to show the concordance between the detected state of two barcodes. (H) In all pairs, the majority of active sites are classified as either A or G for both barcodes. Data are combined from two biological replicates.
Figure 6.
Figure 6.. In situ readout of a combinatorial barcode library.
(A) A combinatorial lentiviral library in which each of 4 positions can take one of three distinct position-specific 20bp barcodes to generate 81 possible barcode combinations. The viruses also encode Cerulean downstream of hUbi promoter. (B) The frequency at which barcode combinations are detected in situ, in transduced HEK293T cells, is consistent with the frequency measured by next generation sequencing. Each point represents one barcode combination. 906 active sites were analyzed by Zombie. Error bars are 95% binomial confidence intervals, calculated using Clopper-Pearson method. Since the number of observations by imaging (906 active sites) is lower than the sequencing read count (102056 aligned reads), the horizontal error bars are wider than the vertical ones. (C) Detection of two clones of cells, labeled by two barcode combinations, in a coronal section of chick neural tube. Maximum intensity projected images corresponding to variants in each barcode position are merged in 3 color channels (cyan, magenta, and yellow, corresponding to A). Dots that do not appear consistently in all rounds are excluded from the analysis. (D) Examples of cells in developing chick cortex (i), pallidum (ii), and retina (iii) labeled with various barcode combinations (arbitrary colors). The inset shows the approximate location of the panels on a drawing of a coronal section through chick neural tube and indicates dorsal (D) and ventral (V) directions. For panels C and D, two embryos were analyzed. 39 out of 81 barcode combinations were identified in one embryo by analyzing 44 images acquired from 10 sections. In the other embryo, we identified 20 distinct barcode combinations in 11 images acquired from 6 consecutive sections. Scale bars are 25μm.

References

    1. Farzadfard F & Lu TK Emerging applications for DNA writers and molecular recorders. Science 361, 870–875 (2018). - PMC - PubMed
    1. Frieda KL et al. Synthetic recording and in situ readout of lineage information in single cells. Nature 541, 107–111 (2017). - PMC - PubMed
    1. McKenna A et al. Whole-organism lineage tracing by combinatorial and cumulative genome editing. Science 353, aaf7907 (2016). - PMC - PubMed
    1. Alemany A, Florescu M, Baron CS, Peterson-Maduro J & van Oudenaarden A Whole-organism clone tracing using single-cell sequencing. Nature 556, 108–112 (2018). - PubMed
    1. Kalhor R et al. Developmental barcoding of whole mouse via homing CRISPR. Science 361, (2018). - PMC - PubMed

Methods-only References

    1. Cong L et al. Multiplex genome engineering using CRISPR/Cas systems. Science 339, 819–823 (2013). - PMC - PubMed
    1. Doench JG et al. Optimized sgRNA design to maximize activity and minimize off-target effects of CRISPR-Cas9. Nat. Biotechnol 34, 184–191 (2016). - PMC - PubMed
    1. Listgarten J et al. Prediction of off-target activities for the end-to-end design of CRISPR guide RNAs. Nat Biomed Eng 2, 38–47 (2018). - PMC - PubMed
    1. SantaLucia J Jr. A unified view of polymer, dumbbell, and oligonucleotide DNA nearest-neighbor thermodynamics. Proc. Natl. Acad. Sci. U. S. A 95, 1460–1465 (1998). - PMC - PubMed
    1. Lois C, Hong EJ, Pease S, Brown EJ & Baltimore D Germline transmission and tissue-specific expression of transgenes delivered by lentiviral vectors. Science 295, 868–872 (2002). - PubMed

Publication types