. 2019 Dec;26(12):1094-1105.
doi: 10.1038/s41594-019-0326-7. Epub 2019 Nov 18.

Structural basis of amino acid surveillance by higher-order tRNA-mRNA interactions

Affiliations

Structural basis of amino acid surveillance by higher-order tRNA-mRNA interactions

Shuang Li et al. Nat Struct Mol Biol. 2019 Dec.

Abstract

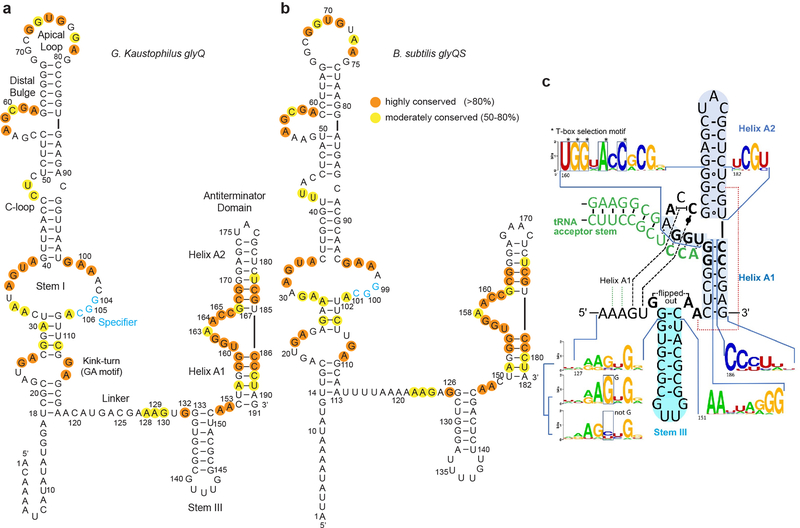
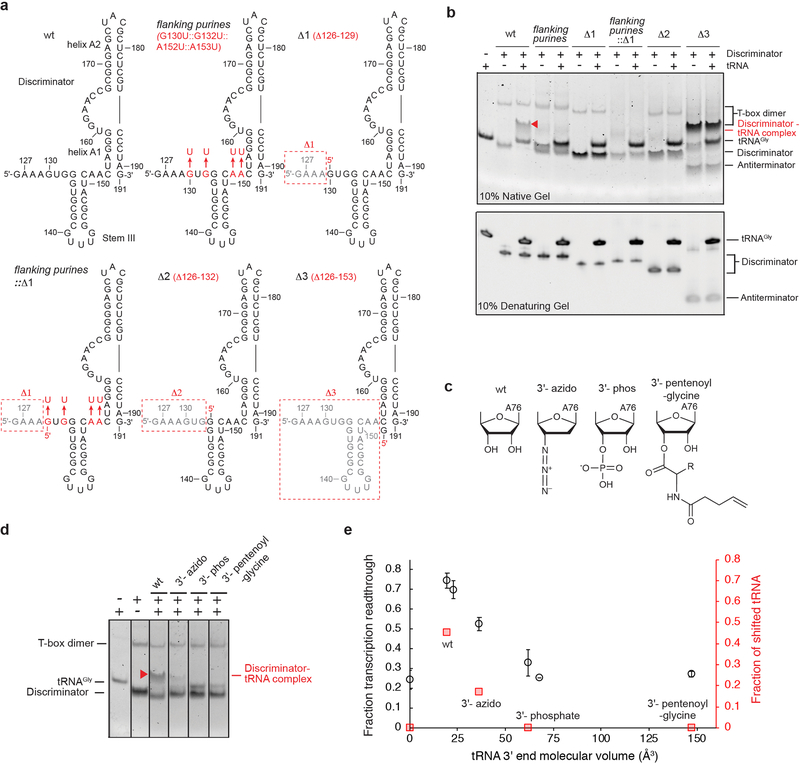
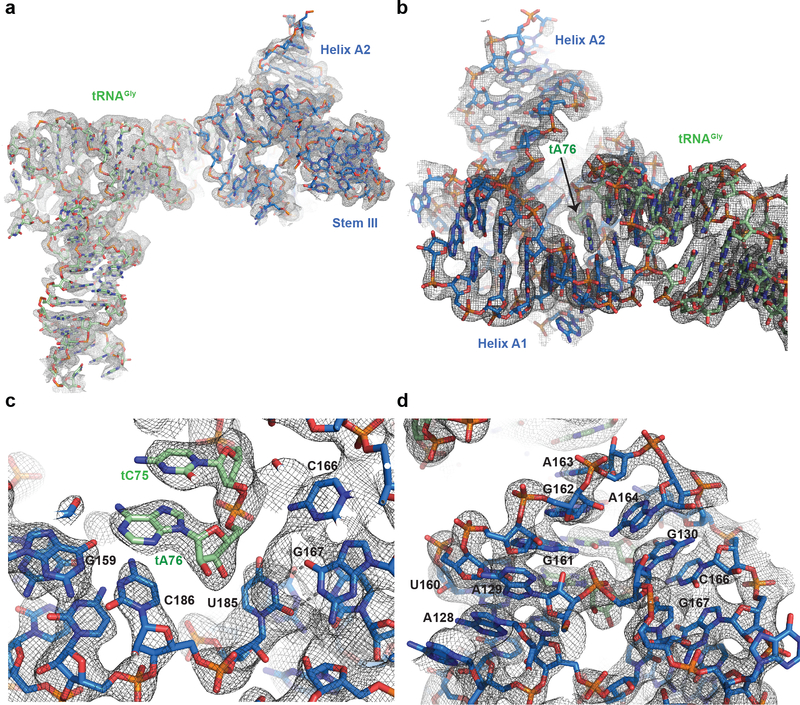
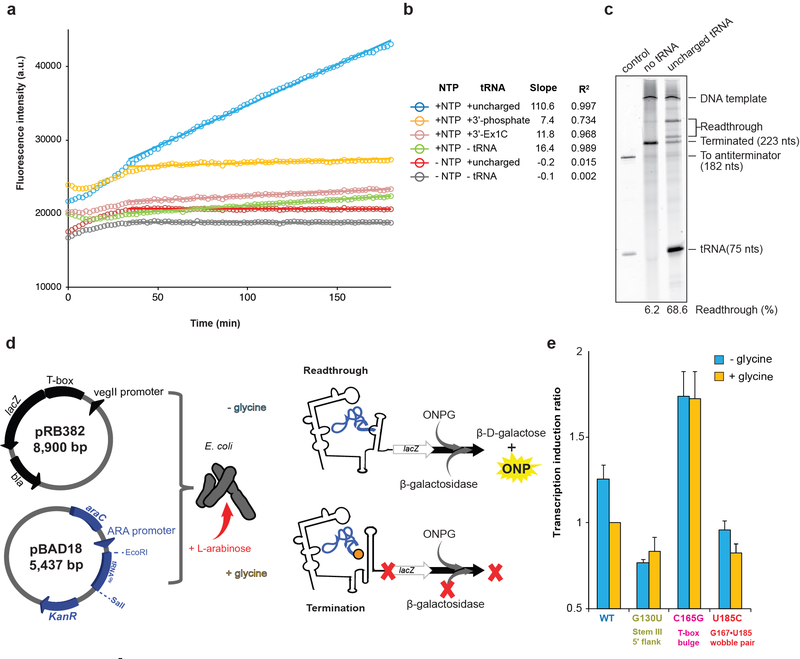
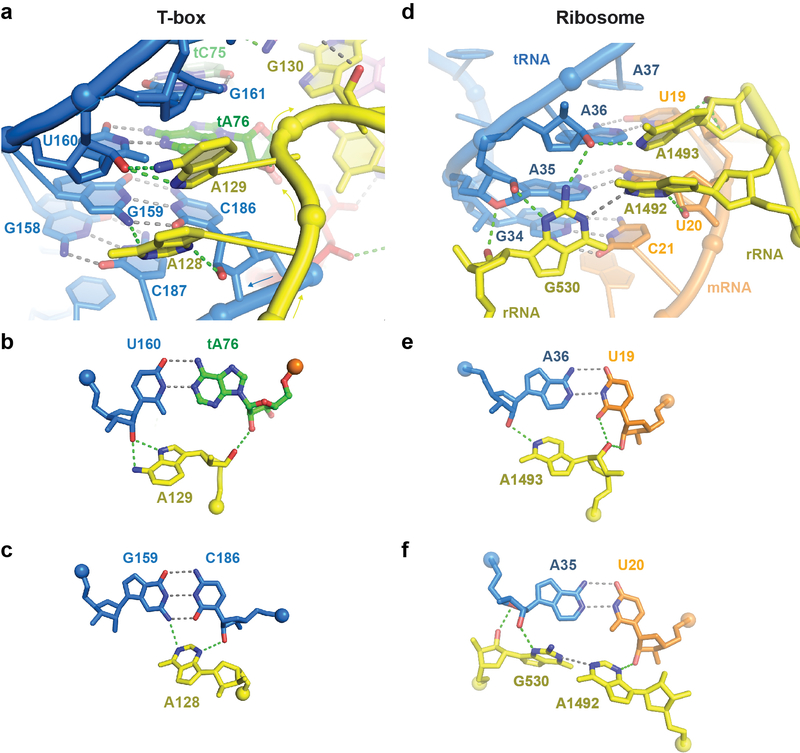
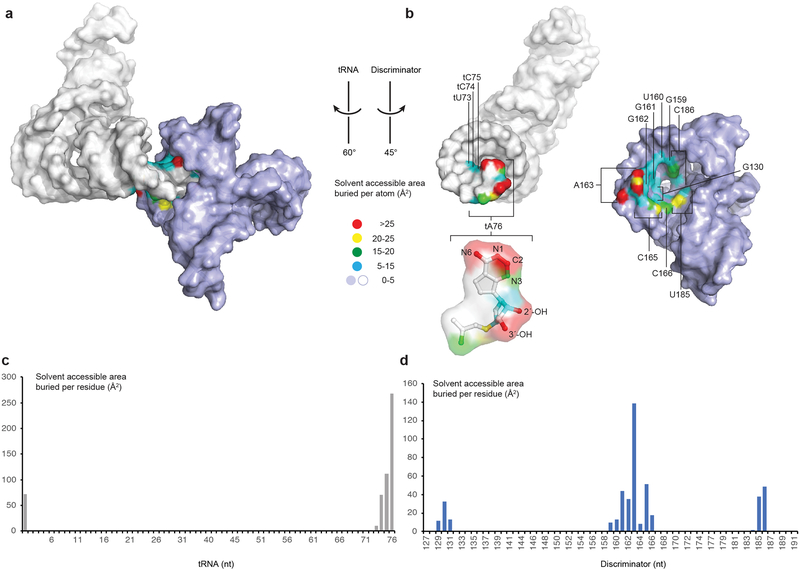
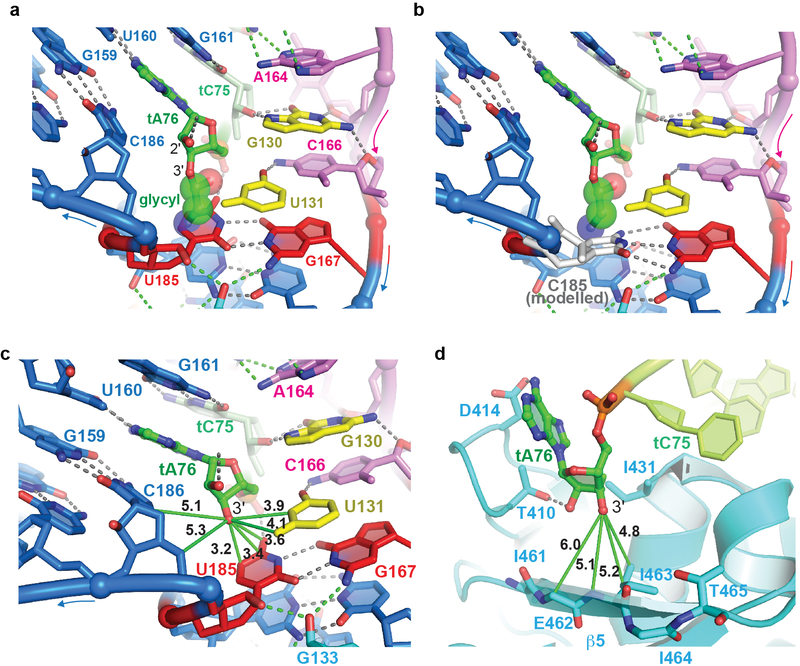
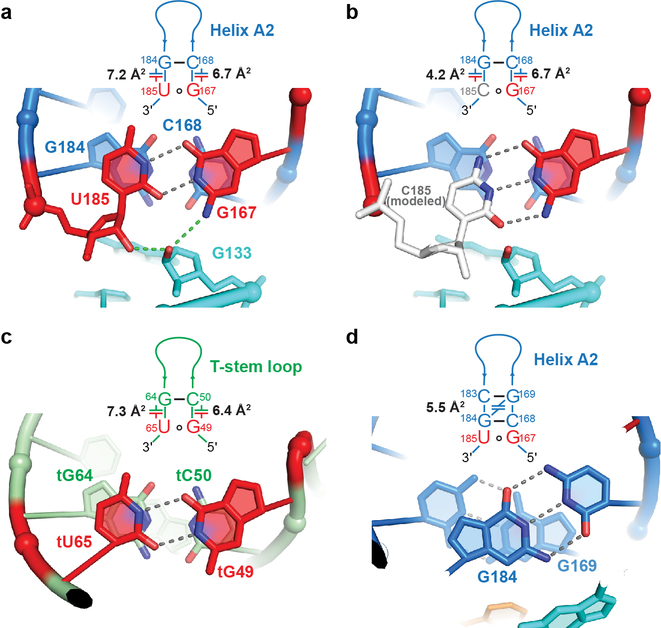
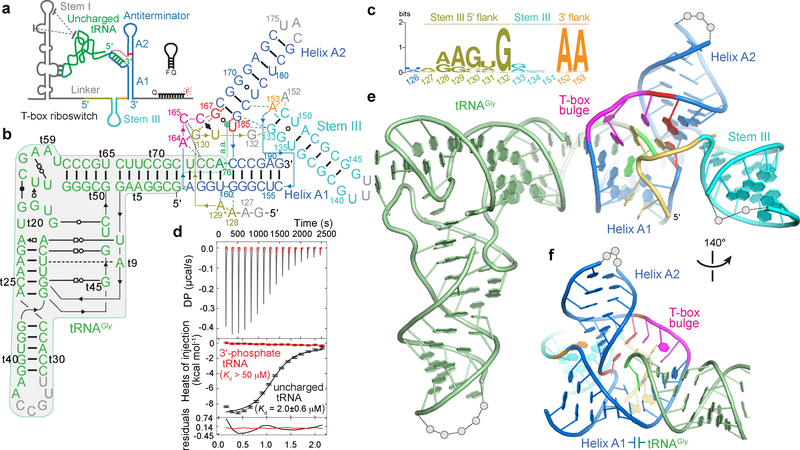
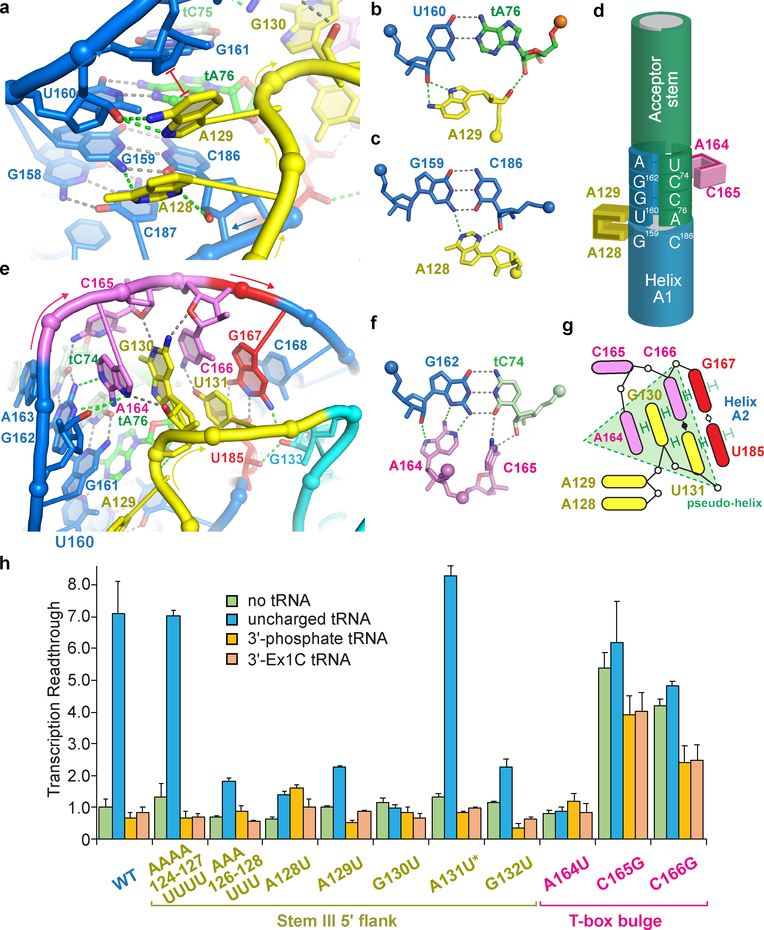
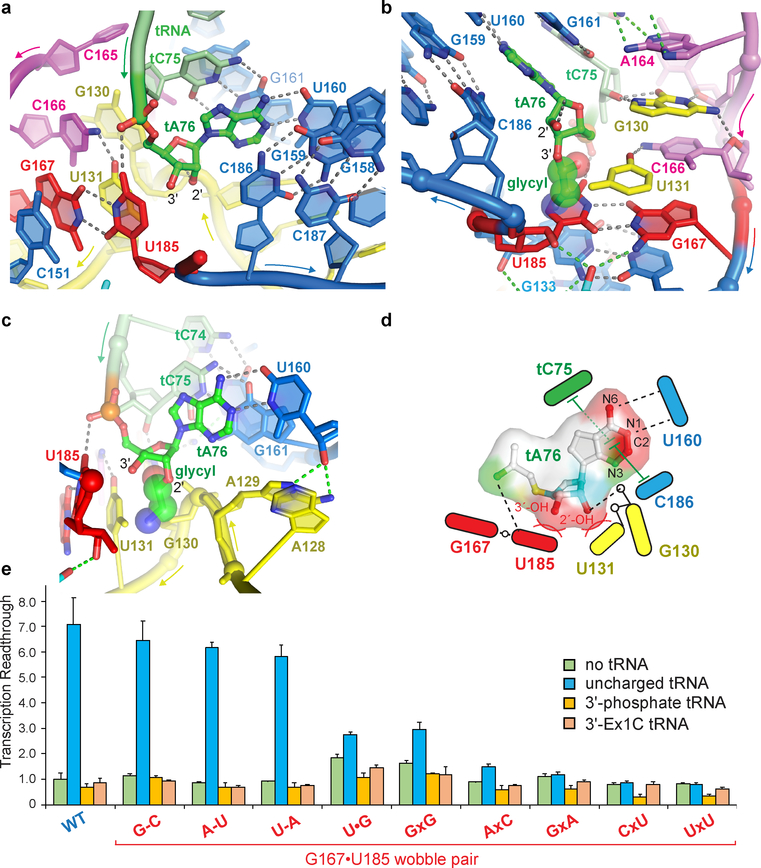
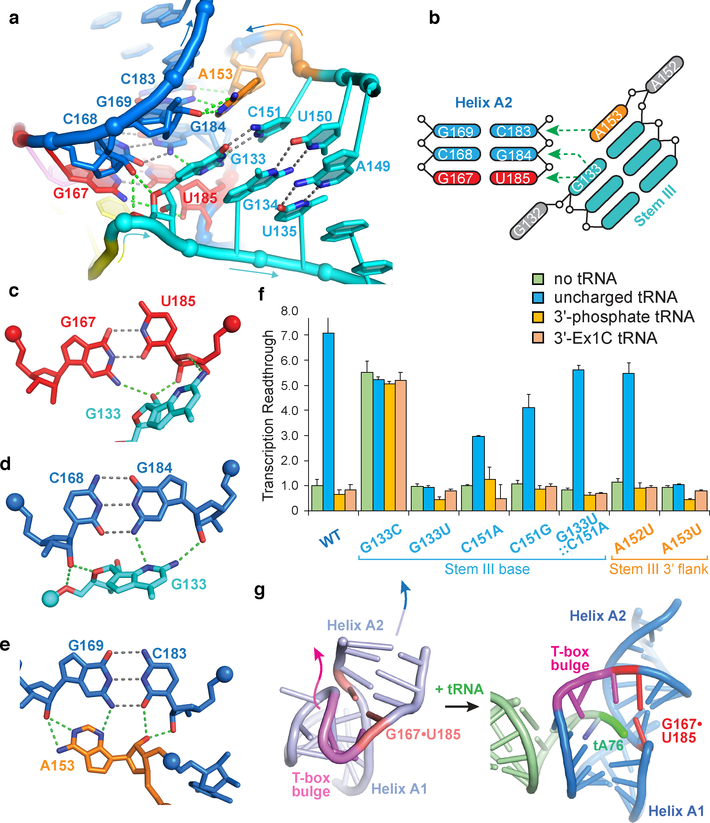
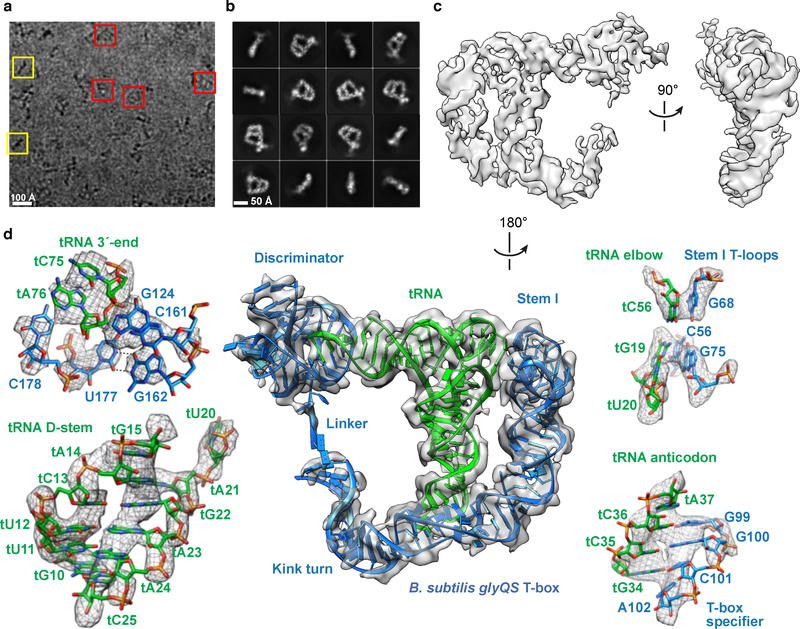
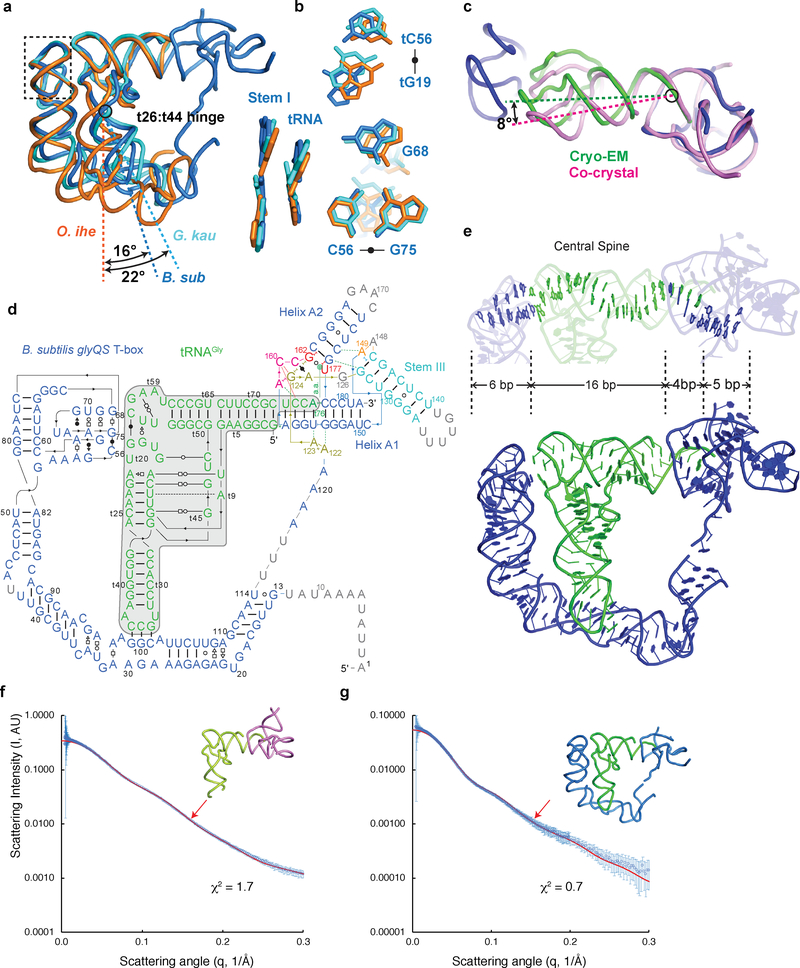
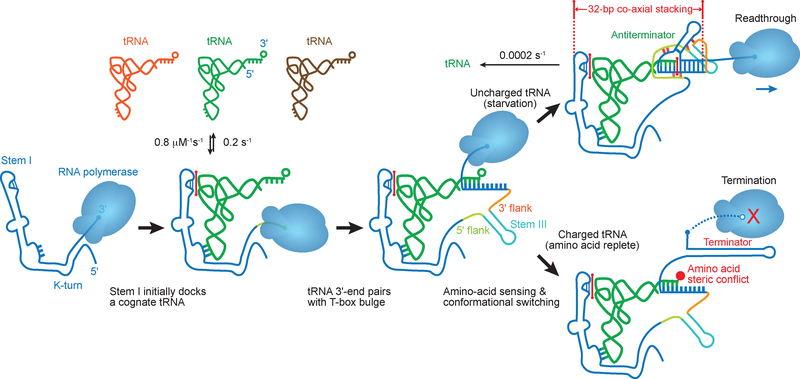
Amino acid availability in Gram-positive bacteria is monitored by T-box riboswitches. T-boxes directly bind tRNAs, assess their aminoacylation state, and regulate the transcription or translation of downstream genes to maintain nutritional homeostasis. Here, we report cocrystal and cryo-EM structures of Geobacillus kaustophilus and Bacillus subtilis T-box-tRNA complexes, detailing their multivalent, exquisitely selective interactions. The T-box forms a U-shaped molecular vise that clamps the tRNA, captures its 3' end using an elaborate 'discriminator' structure, and interrogates its aminoacylation state using a steric filter fashioned from a wobble base pair. In the absence of aminoacylation, T-boxes clutch tRNAs and form a continuously stacked central spine, permitting transcriptional readthrough or translation initiation. A modeled aminoacyl disrupts tRNA-T-box stacking, severing the central spine and blocking gene expression. Our data establish a universal mechanism of amino acid sensing on tRNAs and gene regulation by T-box riboswitches and exemplify how higher-order RNA-RNA interactions achieve multivalency and specificity.


Conflict of interest statement

Competing interests: Authors declare no competing interests.

Figures

Extended Data 1
Extended Data 1. Secondary structures and conservation analyses of glycyl T-box riboswitches.
a, b, Secondary structures of G. Kaustophilus glyQ and B. subtilis glyQS T-box riboswitch. Glycine-specific T-boxes lack the Stem II and Stem IIA/B pseudoknot structures. Conserved nucleotides are highlighted, based on previous reports supplemented by new phylogenetic analysis (Fig. 1; Online Methods). Previous sequence annotations of the G. Kaustophilus glyQ T-box had omitted a 5’ ssRNA leader that precedes Stem I in all validated T-boxes, which is now restored. The probable transcription start site, 17 nts upstream of Stem I, was identified using prokaryotic promoter prediction algorithms. Nucleotide numbering is thus offset by +17 relative to previous reports. c, Sequence conservation of the T-box discriminator region based on G. Kaustophilus glyQ T-box. The split patterns show that the intercalating G130 is at the center of a 5’-AR(U/A)-3’ motif (middle). This motif is shifted 1 nt to the left when there is no G in position 130 (bottom). In this case, a moderately conserved G is predominant in position 129, while two pyrimidines are present in positions 130 and 131. Assuming that G129 is the intercalating nucleotide equivalent to G130 in the middle panel, one of these pyrimidines (nt 130 or 131) may adopt an extrahelical conformation to account for the motif shift.
Extended Data 2
Extended Data 2. Mutational analysis of T-box discriminator-tRNA interactions.
a, Secondary structures of wild-type, mutant, and truncated T-box discriminators. Deletions are indicated by red boxes. b, EMSA analysis of the constructs shown in (a), showing the requirement of stem III and flanking purines for tRNA binding. The antiterminator (discriminator without Stem III and its flanking purines; Δ3 mutant) is prone to dimerization. c, tRNA variants used that carry various 3’ chemical modifications. Only the terminal tA76 is shown. d, EMSA analysis of constructs in (c), showing that binding is selective for uncharged tRNA. e, Quantitation of (d) and comparison with previously reported in vitro transcription readthrough data of the same tRNA variants. The values and error bars represent mean and s.d., n = 3 biologically independent samples.
Extended Data 3
Extended Data 3. Representative X-ray crystallographic electron density maps.
a, Composite simulated anneal-omit 2|Fo|-|Fc| electron density calculated using the final model (1.0 s.d.) superimposed with the final refined model. b-d, Portions of the map showing tRNA-T-box discriminator coaxial stacking (b), encapsulation of tRNA 3’-end by the discriminator (c), and long-range interactions between Stem III 5’ purines and the T-box bulge (d). Note the density fusion as a result of nucleobase-ribose packing interactions between A129 and G161.
Extended Data 4
Extended Data 4. In vitro transcription termination/readthrough assay and in vivo β-gal assay.
a, Representative raw data of in vitro transcription termination-readthrough assay using wild-type B. subtilis T-box riboswitch. The rates of fluorescence increase between 34 and 180 min (segments with trendlines) report the production of readthrough transcripts. b, Quantitation of data in (a). Rates of fluorescence increase (slopes) were subsequently normalized to that of the reference in the presence of NTP but absence of tRNA (green data points) and reported in Fig. 2h and 3e. c, Validation of fluorescence-based readthrough assay in (a) and (b) with subsequent, conventional gel-based analysis of the same samples. Addition of the uncharged tRNA led to significantly increased transcription readthrough. d, Scheme of in vivo gene expression assay using the G. kaustophilus glyQ T-box riboswitch transcriptionally fused with lacZ. e, Relative β-gal activity of wild-type and mutant T-boxes under glycine-replete and glycine-starvation conditions, normalized to wild-type T-box-containing strain grown in minimal media supplemented with glycine. The values and error bars represent mean and s.d., n = 3 biologically independent samples.
Extended Data 5
Extended Data 5. Comparison of the T-box tandem A-minor latch with the A1492-A1493-G530 latch in the ribosome A site.
a, The A128-A129 latch reinforces the functionally important tRNA (green) - helix A1 (marine) stacking interface. A127, A128 and A129 form a continuous adenosine stack. b and c, The stacked A128 and A129 engage extensive hydrogen bonds with the minor groove, reinforce tRNA-T-box base-pairing and stacking, and “staple” the two RNAs together. d, In the ribosome A site, A1492 and A1493 similarly reinforce the intermolecular codon-anticodon duplex via tandem, stacked A-minor interactions in conjunction with G530. e and f, Hydrogen-bond patterns in the ribosome A site resemble those in the T-box (b and c).
Extended Data 6
Extended Data 6. Intermolecular interface of the T-box discriminator-tRNA complex.
a, Solvent-accessible surface colored according to area buried from light blue or white (no burial) to red (>25 Å2 per atom). b, Open-book view of the binding interface. The inset shows the extensive burial of tRNA tA76, particularly its Watson-Crick edge (N6-N1-C2) and both 2’-OH and 3’-OH. c and d, Solvent-accessible surface area buried per residue for tRNA (c) and discriminator (d).
Extended Data 7
Extended Data 7. Purine-minor groove interactions and comparisons of steric sieves in the T-box and ribosome-RelA complex.
Comparison of the G-U wobble pair and a modelled G-C pair at the base of helix A2. a, A modelled tRNA 3’-glycyl moiety strongly clashes with the U185 nucleobase of the G•U wobble pair. b, Modelled Watson-crick pair (C185, white) still clashes with the tRNA 3’-glycyl moiety, albeit to a lesser extent than the G•U wobble pair (a). c and d, Comparison of the steric sieves in the T-box (c) and RelA-ribosome complex (d). Solid green lines indicate inter-atomic distances in Å. The RelA-ribosome complex structure is based on PDB 5IQR.
Extended Data 8
Extended Data 8. A conserved G•U wobble pair enhances stacking with its neighboring base pair both in the T-box discriminator and in the tRNA T-loop.
a, Through local helix underwinding, helix A2 terminal G•U wobble pair produces exceptionally large nucleobase overlap areas and enhances stacking with the penultimate C-G pair. b, Reduced nucleobase overlap areas between modelled G-C pair and the penultimate C-G pair. c, The G•U wobble pair is reminiscent of the conserved G49•U65 wobble pair found in the tRNAGly T-loop in the same complex. d, For comparison, the penultimate C-G pair stacks with its neighboring G-C pair with less than half of the total overlap area. Overlap areas (in Å2) between stacked nucleobases were calculated with 3DNA.
Extended Data 9
Extended Data 9. Cryo-EM single particle analysis (SPA) workflow of full-length B. subtilis T-box-tRNA complex.
a, 3D classification yielded two major classes (black boxes) that were combined for auto refinement. b, Final reconstruction. c, FSC curve showed 4.9 Å resolution at 0.143 cutoff. d, Euler angle distribution of the final reconstruction.
Extended Data 10
Extended Data 10. Relion 3D classification and local resolution of the full-length B. subtilis T-box-tRNA complex.
3D classification on the complex converged to three maps. Superposition of the tRNA density in three maps revealed motions of the T-box relative to tRNA as indicated by the arrows. This flexibility of the T-box RNA is the major limitation that prevented cryo-EM reconstruction from achieving higher resolutions. Resmap analysis shows that the tRNA was better resolved at ~4 Å resolution (upper right).
Fig. 1.
Fig. 1.. Overall structure of the T-box discriminator-tRNA complex.
(a) glyQ T-box riboswitch-tRNAGly complex. Dotted lines denote stacking interactions between the tRNA elbow and the distal T-loops of stem I. The molecular beacon harboring a 5’-Cy5 fluorophore (F) and 3’-Dabcyl quencher (Q) to measure transcription readthrough is rendered in black. (b) Sequence and secondary structure of the cocrystallized G. kaustophilus glyQ T-box discriminator and tRNAGly. Non-canonical base pairs are denoted by Leontis-Westhof symbols. Lines with embedded arrowheads denote chain connectivity. Green and gray dotted lines denote purine-minor groove and other hydrogen-bonding interactions, respectively. The tRNA (shaded) is conventionally numbered, where a ‘t’ precedes tRNA residue numbering. (c) Sequence logo of Stem III and its flanking regions. (d) Representative ITC analysis of discriminator binding by uncharged (black) and 3’-phosphate (red) tRNAs. The error bars were statistical estimates of the uncertainties of individual injection heats calculated using NITPIC (Online Methods). The Kd value was mean and s.d., n = 3 biologically independent samples. (e and f) Front and rear views of the overall cocrystal structure. tA76 is highlighted in bright green. Residues that are not modelled are indicated as gray spheres.
Fig. 2.
Fig. 2.. The A-minor latch and pseudohelix stabilize tRNA-T-box interactions.
(a) The A128-A129 latch (yellow) reinforces tRNA (green) - helix A1 (marine) stacking interface. (b,c) Hydrogen-bonding patterns in (a). (d) Cartoon illustrating how the A128-A129 axial latch and A164-C165 lateral latch reinforce the tRNA-T-box duplex. (e) A pseudo-helix stacks with and modulates helix A2 stability. (f) A164 and C165 interact across the minor groove of the T-box-tRNA duplex. (g) Cartoon diagram of the pseudo-helix structure (green shaded triangle). Stacking interactions are indicated by green connectors. (h) In vitro transcription readthrough analysis of wild-type and mutant T-boxes (mean and s.d., n= 3 biologically independent samples). *A131U is where B. subtilis (A) and G. kaustophilus (U) sequences naturally diverge.
Fig. 3.
Fig. 3.. Structural basis of tRNA aminoacylation sensing by the T-box discriminator.
(a) Environment and interactions of tA76 at the tRNA 3’-end. (b) Location of a modelled 3’-glycyl moiety (spheres) and overlap with the U185 nucleobase. (c) Location of a modelled 2’-glycyl moiety (spheres) and overlap with the A-minor latch or pseudo-helix. (d) Cartoon diagram of the environment of tA76 buried inside the T-box discriminator. 2’- and 3’-aminoacyl moieties are rejected by the G130, U131 dinucleotide (part of pseudo-helix; see Fig. 2e & 2g) and G167•U185 wobble pair, respectively. (e) In vitro transcription readthrough analysis of wild-type and mutant T-boxes at the G167•U185 wobble pair (mean and s.d., n= 3 biologically independent samples).
Fig. 4.
Fig. 4.. Docking of Stem III with Helix A2 reinforces and rigidifies complex structure.
(a) Stem III uses three consecutive purine-minor groove interactions and two nucleobase-ribose packing contacts to anchor itself to helix A2. (b) Cartoon diagram illustrating the interactions in (a). (c-e) Hydrogen bonding patterns in (a) that involve G133 (c & d) or A153 (e). (f) In vitro transcription readthrough analysis of T-box Stem III mutants (mean and s.d., n= 3 biologically independent samples). (g) tRNA binding dramatically remodels the discriminator. Left: NMR structure of an isolated B. subtilis tyrS T-box antiterminator (discriminator without Stem III; PDB 1N53). Arrows denote conformational transitions up to 28 Å induced by tRNA binding. Right: cocrystal structure of T-box discriminator with bound tRNA. Stem III is omitted for clarity.
Fig. 5.
Fig. 5.. 4.9 Å Cryo-EM map and structure of a full-length B. subtilis glyQS T-box-tRNAGly complex.
(a) Raw micrograph with top view (red boxes) and side view (yellow boxes) of the T-box-tRNA complex particles. (b) 2D averages showing high-resolution RNA features. (c) Front and side views of the final cryo-EM reconstruction at 4.9 Å. (d) Cryo-EM density overlayed with final structural model (middle) with zoom-in views of the interface between the tRNA 3’-end and the discriminator (upper left), tRNA D-stem with resolved ribose and phosphate backbone (lower left), interface between the tRNA elbow and stem I distal interdigitated T-loops (upper right); interface between the tRNA anticodon and the T-box specifier (lower right).
Fig. 6.
Fig. 6.. The T-box central spine and structural comparisons.
(a) Superposition of the Stem I distal interdigitated T-loops (boxed) in the cryo-EM structure (marine) with those in the Stem I-tRNA cocrystal structures from O. ihenyensis (orange) and G. kaustophilus (cyan). (b) Comparison of the Stem I-tRNA stacking interface among the three structures. Numbering is based on the B. subtilis cryo-EM structure (marine). (c) Superposition of the discriminator structures in the cocrystal (magenta) and cryo-EM (marine and green) structures reveals an 8° rotation of the tRNA acceptor stem. (d) Secondary structure diagram of the full-length B. subtilis glyQS T-box-tRNAGly complex. Disordered residues are shown in grey. (e) Coaxial stacking at three tRNA-T-box interfaces align and assemble a ~31–32-layered central spine that stabilizes the antiterminator conformation. (f & g) Overlay of back-calculated SAXS scattering curves (red lines) computed from the co-crystal structure of T-box discriminator-tRNA complex (f) or Cryo-EM structure of full-length T-box-tRNA complex (g) with CRYSOL with experimental scattering profiles in solution (blue circles; mean and s.d. of 30 measurements of one sample; Online Methods). χ2 values of the fits are indicated.
Fig. 7.
Fig. 7.. Mechanistic model of a co-transcriptionally acting T-box riboswitch.
A transcriptional T-box initially uses its Stem I to select a cognate tRNA regardless of its 3’ aminoacylation state, based primarily on anticodon-specifier complementarity. kon and koff for the cognate tRNA are derived from single-molecule fluorescence measurements,,. The anticodon-specifier interaction engages first and is reinforced by the stacking interaction at the tRNA elbow (red stick). Subsequent elongation of the T-box transcript exposes Stem III and the 5’-half of the antiterminator, which then forms four base pairs with the 3’-NCCA end of the docked tRNA. Finally, the 3’ strand of the antiterminator, transcribed last, will attempt to anneal with its 5’ counterpart. In starvation, the annealing is successful, forming a 32-layered, stacked central spine. This spine stabilizes the antiterminator conformer and allows RNAP to traverse this region to transcribe downstream genes. In amino acids abundance, the presence of an esterified amino acid on the tRNA blocks annealing of the 3’-strand of the antiterminator due to a steric conflict with the G167•U185 wobble pair, leading to terminator formation and termination of gene expression, completing a negative feedback loop.

Similar articles

Cited by

References

    1. Chantranupong L, Wolfson RL & Sabatini DM Nutrient-sensing mechanisms across evolution. Cell 161, 67–83 (2015). - PMC - PubMed
    1. Saxton RA et al. Structural basis for leucine sensing by the Sestrin2-mTORC1 pathway. Science 351, 53–8 (2016). - PMC - PubMed
    1. Chantranupong L et al. The CASTOR Proteins Are Arginine Sensors for the mTORC1 Pathway. Cell 165, 153–164 (2016). - PMC - PubMed
    1. Antson AA et al. Structure of the trp RNA-binding attenuation protein, TRAP, bound to RNA. Nature 401, 235–42 (1999). - PubMed
    1. Serganov A & Patel DJ Amino acid recognition and gene regulation by riboswitches. Biochim Biophys Acta 1789, 592–611 (2009). - PMC - PubMed

Methods-only References

    1. Kalvari I et al. Rfam 13.0: shifting to a genome-centric resource for non-coding RNA families. Nucleic Acids Res 46, D335–D342 (2018). - PMC - PubMed
    1. Lorenz R et al. ViennaRNA Package 2.0. Algorithms Mol Biol 6, 26 (2011). - PMC - PubMed
    1. Crooks GE, Hon G, Chandonia JM & Brenner SE WebLogo: a sequence logo generator. Genome Res 14, 1188–90 (2004). - PMC - PubMed
    1. Sampson JR & Uhlenbeck OC Biochemical and physical characterization of an unmodified yeast phenylalanine transfer RNA transcribed in vitro. Proc. Natl. Acad. Sci. USA 85, 1033–1037 (1988). - PMC - PubMed
    1. Zhang J & Ferre-D’Amare AR A flexible, scalable method for preparation of homogeneous aminoacylated tRNAs. Methods Enzymol 549, 105–13 (2014). - PMC - PubMed

Publication types

Supplementary concepts

LinkOut - more resources