Structures of 1:1 and 2:1 complexes of BMVC and MYC promoter G-quadruplex reveal a mechanism of ligand conformation adjustment for G4-recognition
- PMID: 31740959
- PMCID: PMC7145684
- DOI: 10.1093/nar/gkz1015
Structures of 1:1 and 2:1 complexes of BMVC and MYC promoter G-quadruplex reveal a mechanism of ligand conformation adjustment for G4-recognition
Abstract
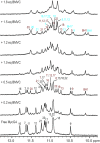
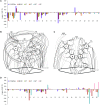
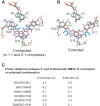
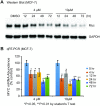
BMVC is the first fluorescent probe designed to detect G-quadruplexes (G4s) in vivo. The MYC oncogene promoter forms a G4 (MycG4) which acts as a transcription silencer. Here, we report the high-affinity and specific binding of BMVC to MycG4 with unusual slow-exchange rates on the NMR timescale. We also show that BMVC represses MYC in cancer cells. We determined the solution structures of the 1:1 and 2:1 BMVC-MycG4 complexes. BMVC first binds the 5'-end of MycG4 to form a 1:1 complex with a well-defined structure. At higher ratio, BMVC also binds the 3'-end to form a second complex. In both complexes, the crescent-shaped BMVC recruits a flanking DNA residue to form a BMVC-base plane stacking over the external G-tetrad. Remarkably, BMVC adjusts its conformation to a contracted form to match the G-tetrad for an optimal stacking interaction. This is the first structural example showing the importance of ligand conformational adjustment in G4 recognition. BMVC binds the more accessible 5'-end with higher affinity, whereas sequence specificity is present at the weaker-binding 3'-site. Our structures provide insights into specific recognition of MycG4 by BMVC and useful information for design of G4-targeted anticancer drugs and fluorescent probes.
© The Author(s) 2019. Published by Oxford University Press on behalf of Nucleic Acids Research.
Figures


Similar articles
-
Custom G4 Microarrays Reveal Selective G-Quadruplex Recognition of Small Molecule BMVC: A Large-Scale Assessment of Ligand Binding Selectivity.Molecules. 2020 Jul 30;25(15):3465. doi: 10.3390/molecules25153465. Molecules. 2020. PMID: 32751510 Free PMC article.
-
Structural recognition of the MYC promoter G-quadruplex by a quinoline derivative: insights into molecular targeting of parallel G-quadruplexes.Nucleic Acids Res. 2021 Jun 4;49(10):5905-5915. doi: 10.1093/nar/gkab330. Nucleic Acids Res. 2021. PMID: 33978746 Free PMC article.
-
Binding of Small Molecules to G-quadruplex DNA in Cells Revealed by Fluorescence Lifetime Imaging Microscopy of o-BMVC Foci.Molecules. 2018 Dec 21;24(1):35. doi: 10.3390/molecules24010035. Molecules. 2018. PMID: 30583464 Free PMC article.
-
Human MYC G-quadruplex: From discovery to a cancer therapeutic target.Biochim Biophys Acta Rev Cancer. 2020 Dec;1874(2):188410. doi: 10.1016/j.bbcan.2020.188410. Epub 2020 Aug 19. Biochim Biophys Acta Rev Cancer. 2020. PMID: 32827579 Review.
-
Structure conversion and structure separation of G-quadruplexes investigated by carbazole derivatives.Curr Pharm Des. 2012;18(14):2002-13. doi: 10.2174/138161212799958503. Curr Pharm Des. 2012. PMID: 22376106 Review.
Cited by
-
Unfolding rates of 1:1 and 2:1 complex of CX-5461 and c-MYC promoter G-quadruplexes revealed by single-molecule force spectroscopy.Biophys Rep. 2024 Jun 30;10(3):180-189. doi: 10.52601/bpr.2024.240018. Biophys Rep. 2024. PMID: 39027314 Free PMC article.
-
Berberine Molecular Recognition of the Parallel MYC G-Quadruplex in Solution.J Med Chem. 2021 Nov 11;64(21):16205-16212. doi: 10.1021/acs.jmedchem.1c01508. Epub 2021 Oct 22. J Med Chem. 2021. PMID: 34677968 Free PMC article.
-
Solution Structure of Ternary Complex of Berberine Bound to a dGMP-Fill-In Vacancy G-Quadruplex Formed in the PDGFR-β Promoter.J Am Chem Soc. 2021 Oct 13;143(40):16549-16555. doi: 10.1021/jacs.1c06200. Epub 2021 Sep 29. J Am Chem Soc. 2021. PMID: 34586799 Free PMC article.
-
The interactions of Pu22 G-quadruplex, derived from c-MYC promoter sequence, with antitumor acridine derivatives-An NMR/MD combined study.Mol Ther Nucleic Acids. 2025 Mar 13;36(2):102513. doi: 10.1016/j.omtn.2025.102513. eCollection 2025 Jun 10. Mol Ther Nucleic Acids. 2025. PMID: 40226330 Free PMC article.
-
G4LDB 2.2: a database for discovering and studying G-quadruplex and i-Motif ligands.Nucleic Acids Res. 2022 Jan 7;50(D1):D150-D160. doi: 10.1093/nar/gkab952. Nucleic Acids Res. 2022. PMID: 34718746 Free PMC article.
References
-
- Neidle S., Parkinson G.. Telomere maintenance as a target for anticancer drug discovery. Nat. Rev. Drug Discov. 2002; 1:383–393. - PubMed
Publication types
MeSH terms
Substances
Grants and funding
LinkOut - more resources
Full Text Sources

