

A Bayesian Phase I/II Trial Design for Immunotherapy
- PMID: 31741544
- PMCID: PMC6860919
- DOI: 10.1080/01621459.2017.1383260
A Bayesian Phase I/II Trial Design for Immunotherapy
Abstract
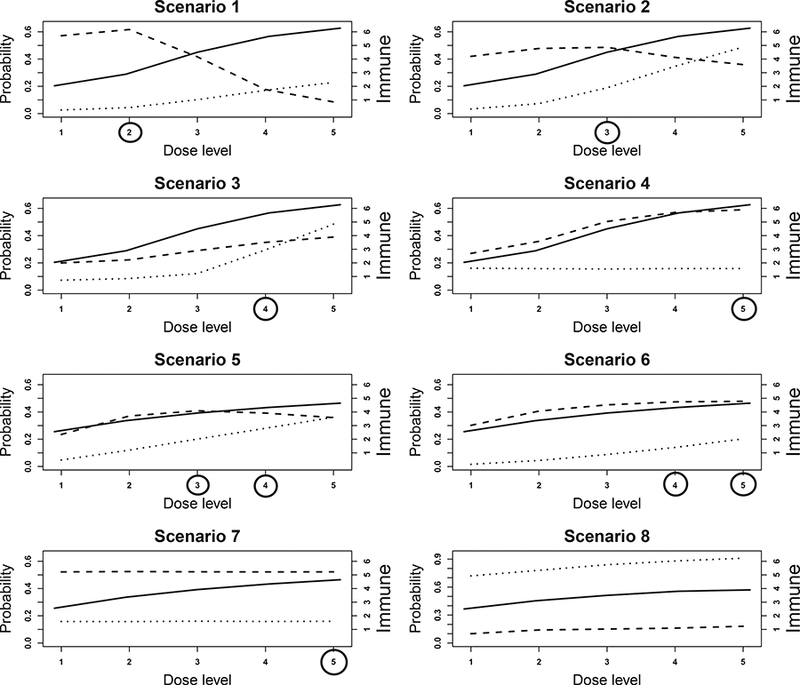
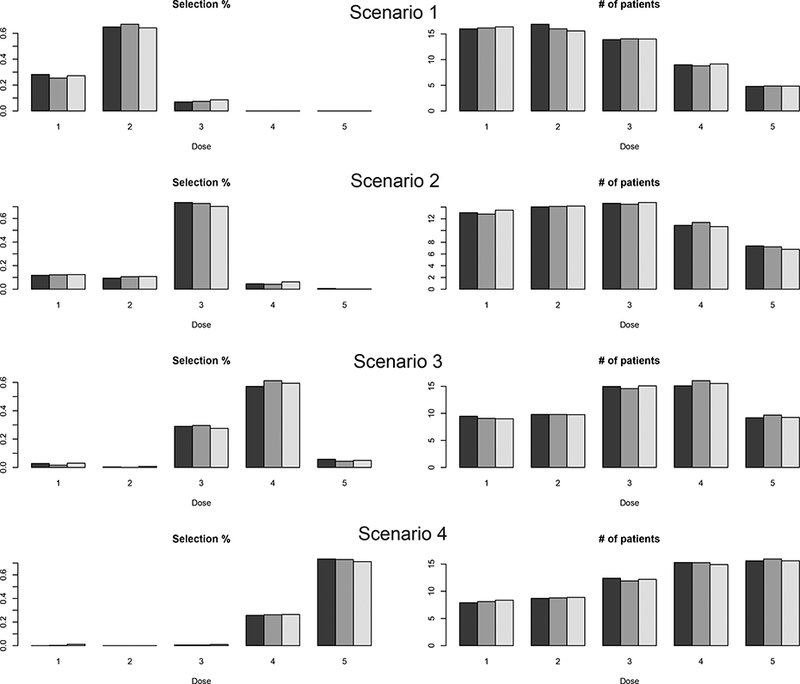
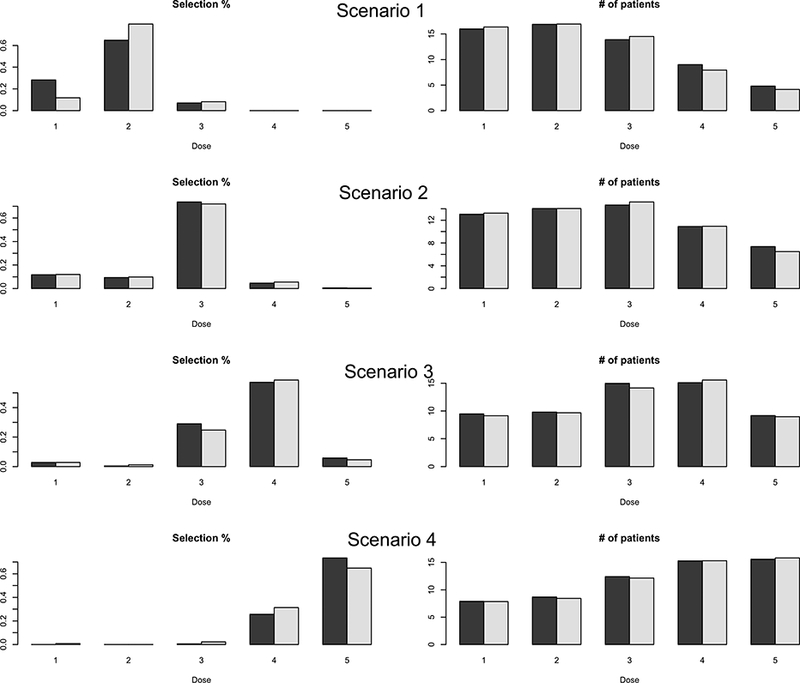
Immunotherapy is an innovative treatment approach that stimulates a patient's immune system to fight cancer. It demonstrates characteristics distinct from conventional chemotherapy and stands to revolutionize cancer treatment. We propose a Bayesian phase I/II dosefinding design that incorporates the unique features of immunotherapy by simultaneously considering three outcomes: immune response, toxicity and efficacy. The objective is to identify the biologically optimal dose, defined as the dose with the highest desirability in the risk-benefit tradeoff. An Emax model is utilized to describe the marginal distribution of the immune response. Conditional on the immune response, we jointly model toxicity and efficacy using a latent variable approach. Using the accumulating data, we adaptively randomize patients to experimental doses based on the continuously updated model estimates. A simulation study shows that our proposed design has good operating characteristics in terms of selecting the target dose and allocating patients to the target dose.
Keywords: Bayesian adaptive design; Immunotherapy; dose finding; immune response; phase I/II trial; risk-benefit tradeoff.
Figures
References
-
- Bachmayr-Heyda A, Aust S, Heinze G, Polterauer S, Grimm C, Braicu EI, Sehouli J, Lambrechts S, Vergote I, Mahner S, et al. (2013) Prognostic impact of tumor infiltrating CD8+ T cells in association with cell proliferation in ovarian cancer patients-a study of the OV- CAD consortium. BMC Cancer 13:422, doi: 10.1186/1471-2407-13-422. - DOI - PMC - PubMed
-
- Braun TM. The bivariate continual reassessment method: extending the CRM to phase I trials of two competing outcomes. Controlled clinical trials 2002; 23: 240–256. - PubMed
-
- Brody J, Kohrt H, Marabelle A and Levy R (2011), Active and passive immunotherapy for lymphoma: proving principles and improving results. Journal of Clinical Oncology, 29, 1864–1875 - PubMed
-
- Cox DR (1972) Regression models and life-tables (with discussion). Journal of the Royal Statistical Society, Series Bb 34: 187–220.
Grants and funding
LinkOut - more resources
Full Text Sources
Other Literature Sources