

Functional and effective connectivity based features of EEG signals for object recognition
- PMID: 31741692
- PMCID: PMC6825113
- DOI: 10.1007/s11571-019-09556-7
Functional and effective connectivity based features of EEG signals for object recognition
Abstract
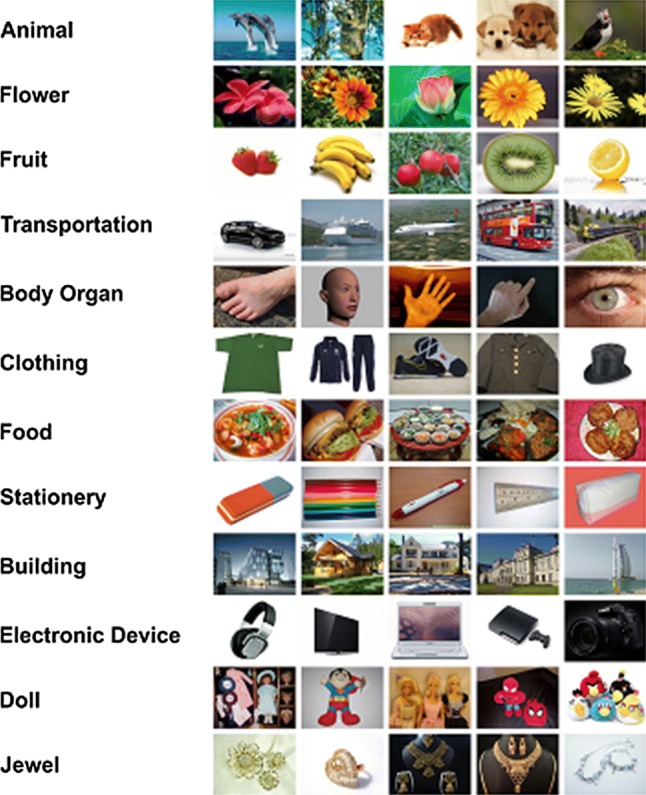
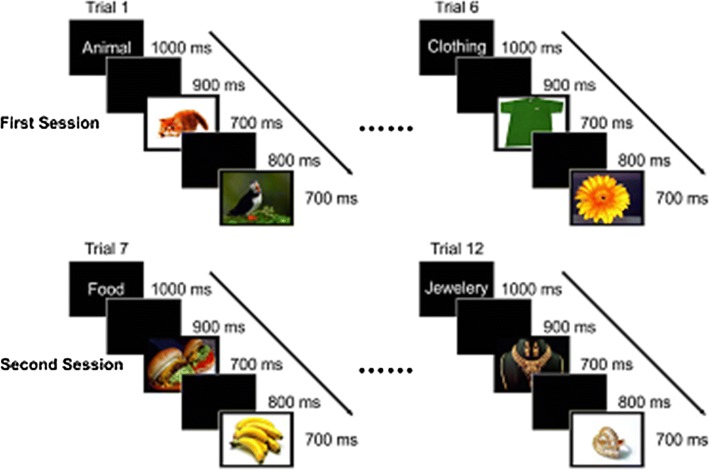
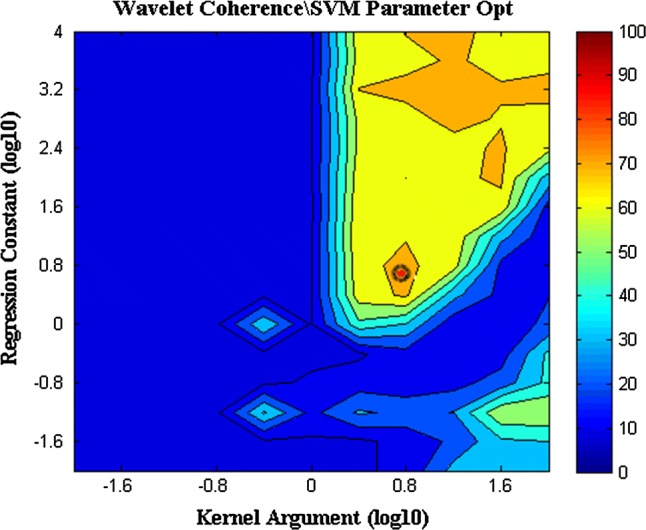
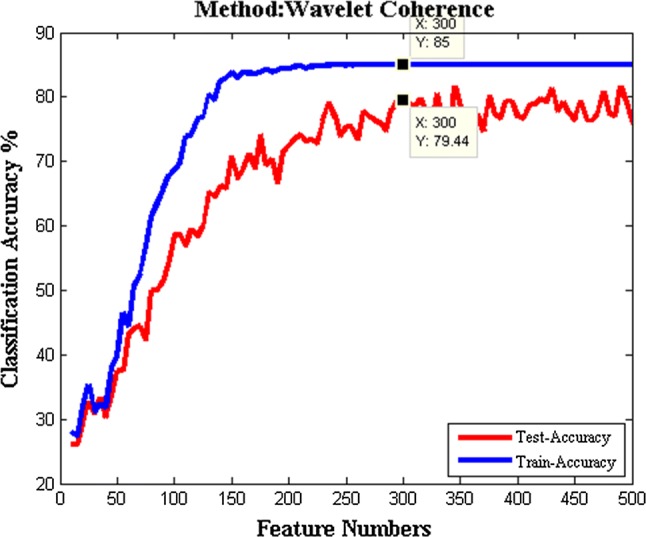
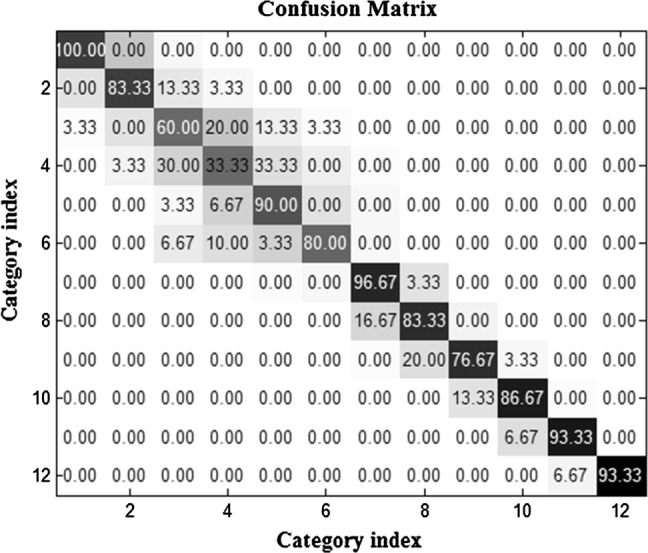
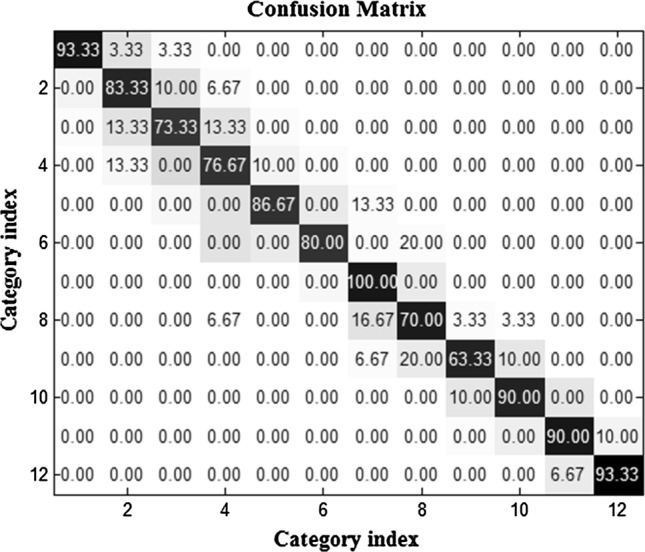
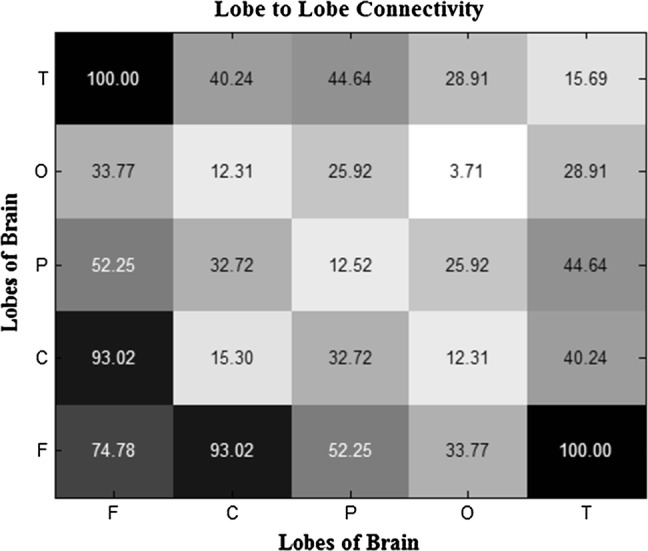
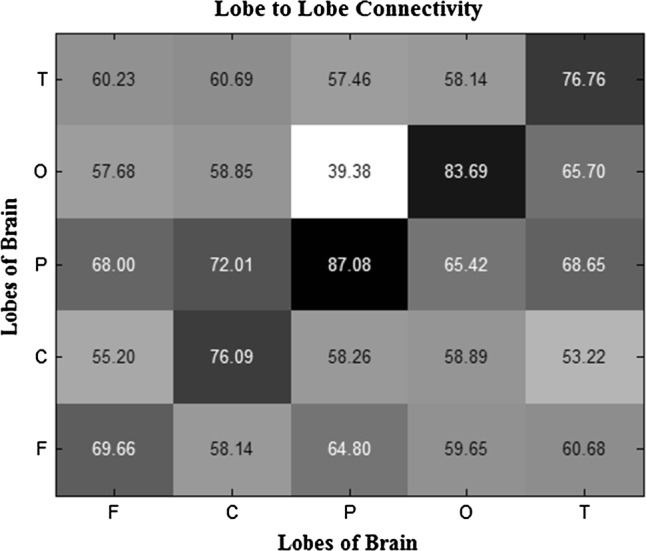
Classifying different object categories is one of the most important aims of brain-computer interface researches. Recently, interactions between brain regions were studied using different methods, such as functional and effective connectivity techniques. Functional and effective connectivity techniques are applied to estimate human brain areas connectivity. The main purpose of this study is to compare classification accuracy of the most advanced functional and effective methods in order to classify 12 basic object categories using Electroencephalography (EEG) signals. In this paper, 19 channels EEG signals were collected from 10 healthy subjects; when they were visiting color images and instructed to select the target images among others. Correlation, magnitude square coherence, wavelet coherence (WC), phase synchronization and mutual information were applied to estimate functional cortical connectivity. On the other hand, directed transfer function, partial directed coherence, generalized partial directed coherence (GPDC) were used to obtain effective cortical connectivity. After feature extraction, the scalar feature selection methods including T-test and one-sided-anova were applied to rank and select the most informative features. The selected features were classified by a one-against-one support vector machine classifier. The results indicated that the use of different techniques led to different classifying accuracy and brain lobes analysis. WC and GPDC are the most accurate methods with performances of 80.15% and 64.43%, respectively.
Keywords: Brain connectivity; Effective connectivity; Electroencephalography (EEG); Functional connectivity; Object recognition.
© Springer Nature B.V. 2019.
Figures


References
-
- Adams S, Meekins R, Beling PA (2017) An empirical evaluation of techniques for feature selection with cost. In: 2017 IEEE international conference on data mining workshops (ICDMW). IEEE, pp 834–841
-
- Babiloni F, Cincotti F, Babiloni C, Carducci F, Mattia D, Astolfi L, Basilisco A, Rossini PM, Ding L, Ni Y, Cheng J. Estimation of the cortical functional connectivity with the multimodal integration of high-resolution EEG and fMRI data by directed transfer function. Neuroimage. 2005;24(1):118–131. doi: 10.1016/j.neuroimage.2004.09.036. - DOI - PubMed
-
- Baccala LA, Takahashi DY, Sameshima K (2006) Computer intensive testing for the influence between time series. In: Schelter B, Winterhalder M, Timmer J (eds) Handbook of time series analysis-recent theoretical developments and applications. pp 411–436
LinkOut - more resources
Full Text Sources
