. 2019 Oct 13;8(12):e1674113.
doi: 10.1080/2162402X.2019.1674113. eCollection 2019.

Prognostic profiling of the immune cell microenvironment in Ewing´s Sarcoma Family of Tumors

Affiliations

Prognostic profiling of the immune cell microenvironment in Ewing´s Sarcoma Family of Tumors

David Stahl et al. Oncoimmunology. .

Abstract

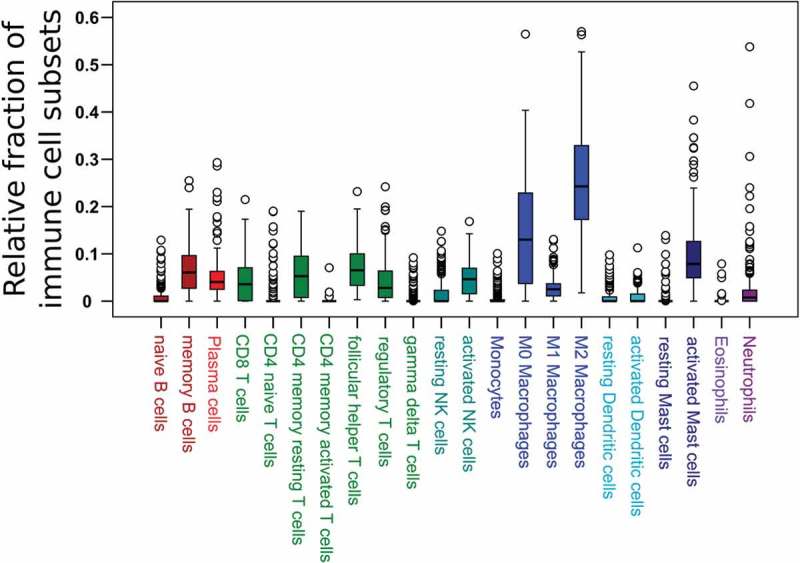
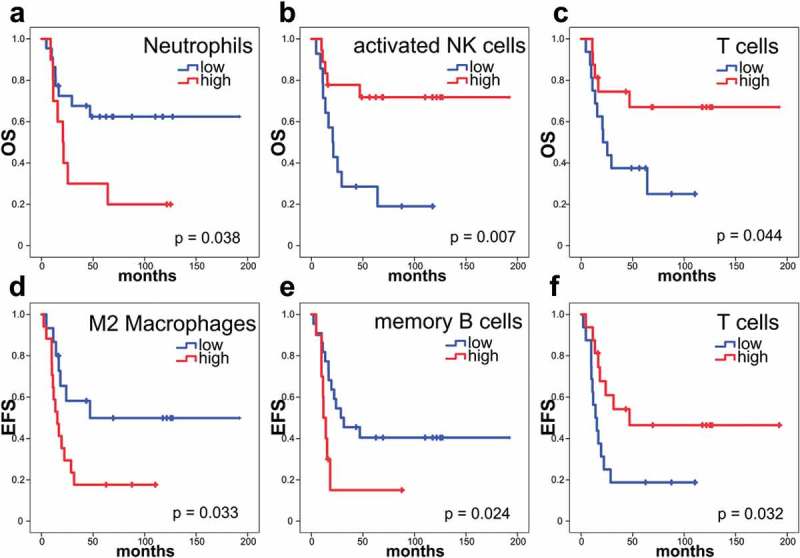
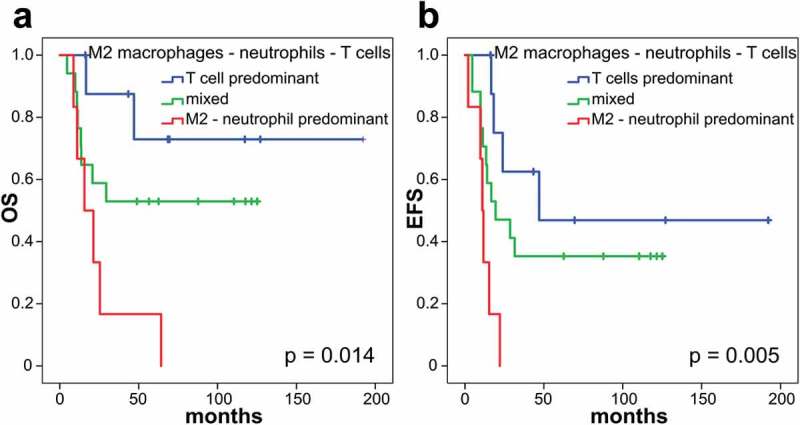
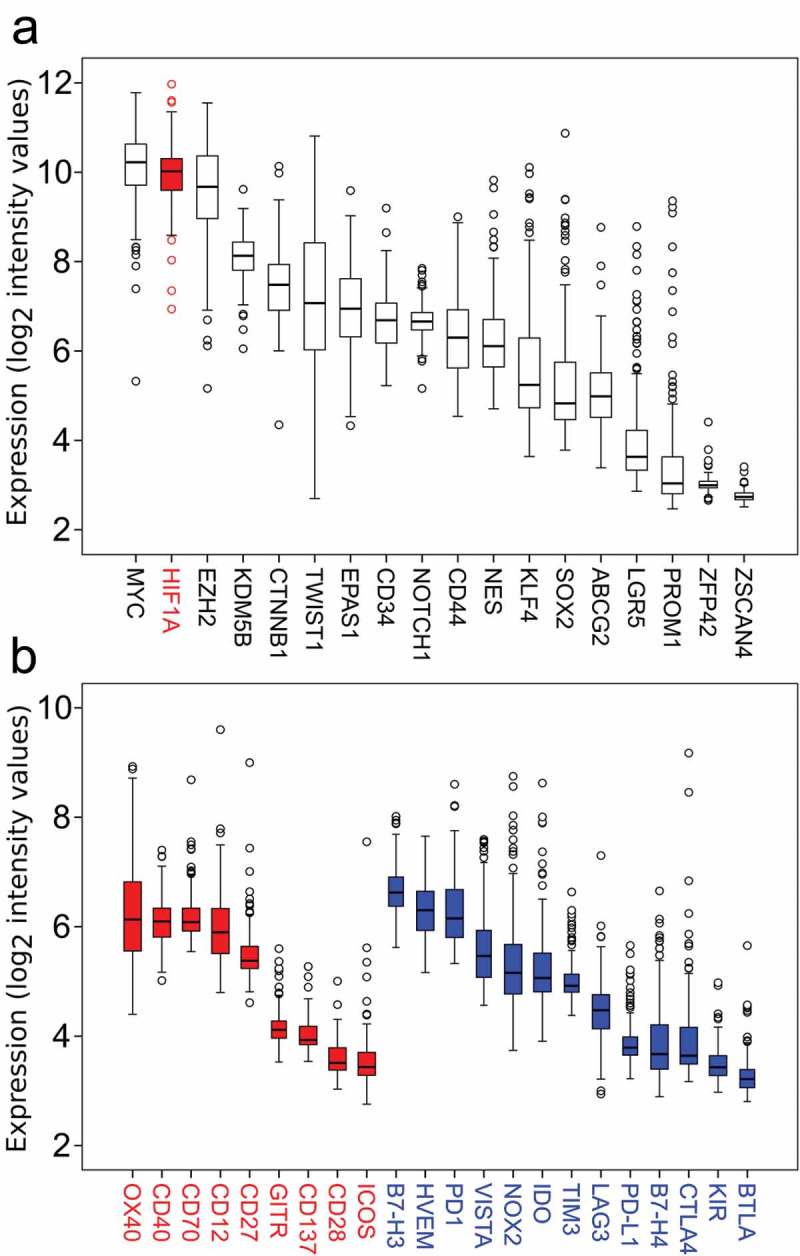
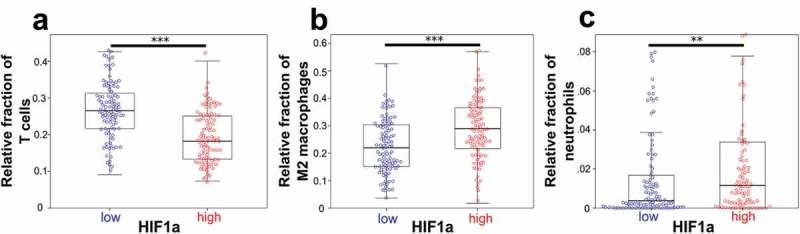
Ewing´s Sarcoma Family of Tumors (ESFT) are clinically aggressive bone and soft tissue tumors in children and young adults. Analysis of the immune tumor microenvironment (TME) provides insight into tumor evolution and novel treatment options. So far, the scarcity of immune cells in ESFT has hindered a comprehensive analysis of rare subtypes. We determined the relative fraction of 22 immune cell types using 197 microarray gene expression datasets of primary ESFT tumor samples by using CIBERSORT, a deconvolution algorithm enumerating infiltrating leucocytes in bulk tumor tissue. The most abundant cells were macrophages (mean 43% of total tumor-infiltrating leukocytes, TILs), predominantly immunosuppressive M2 type macrophages, followed by T cells (mean 23% of TILs). Increased neutrophils, albeit at low number, were associated with a poor overall survival (OS) (p = .038) and increased M2 macrophages predicted a shorter event-free survival (EFS) (p = .033). High frequency of T cells and activated NK cells correlated with prolonged OS (p = .044 and p = .007, respectively). A small patient population (9/32) with combined low infiltrating M2 macrophages, low neutrophils, and high total T cells was identified with favorable outcome. This finding was confirmed in a validation cohort of patients with follow up (11/38). When comparing the immune TME with expression of known stemness genes, hypoxia-inducible factor 1 α (HIF1α) correlated with high abundance of macrophages and neutrophils and decreased T cell levels. The immune TME in ESFTs shows a distinct composition including rare immune cell subsets that in part may be due to expression of HIF1α.

Keywords: CIBERSORT; Ewing´s Sarcoma Family of Tumors; HIF1α; tumor microenvironment; tumor-infiltrating immune cells.


Figures

Figure 1.
Figure 1.
Immune cell distribution in 197 ESFT primary tumors (CIBERSORT). Relative proportion of all tumor-infiltrating leucocytes of 22 immune cell subsets in ESFT.
Figure 2.
Figure 2.
Survival in patients with ESFT is dependent on the abundance of immune cell types. Kaplan-Meier analyses showing OS and EFS with tumors with low (blue) and high (red) frequency of specific immune cells determined by CIBERSORT, as indicated: (a, b, c) OS analysis. (d, e, f) EFS analysis. Thirty-two patients within the training cohort (GSE17679) were included in this survival analysis. (a) Low frequency of neutrophils in ESFT (<0.2546% of total immune cells) were associated with a good prognosis (median OS not reached), high frequency of neutrophils (>0.2546% of total immune cells) with an estimated median survival of only 20.7 months (95% CI 11.9–29.5 months) (p = .038). (b) High frequency of activated NK cells (>3.771% of total immune cells) were associated with a good prognosis (median OS not reached), low frequency of activated NK cells (<3.771% of total immune cells) with an estimated median survival of only 20.7 months (95% CI 12.1–29.3 months) (p = .007). (c) High frequency of total T cells (>22.43% of total immune cells) were associated with a good prognosis (median OS not reached), low frequency of total T cells (<22.43% of total immune cells) with an estimated median survival of only 21.3 months (95% CI 12.1–30.5 months) (p = .044). (d) Whereas patients ESFTs with a low frequency of M2 macrophages (<24.83% of total immune cells) had a median EFS of 47 months, high frequency of M2 macrophages (>24.83% of total immune cells) were associated with an estimated median survival of only 15.3 months (95% CI 8.6–22.0 months) (p = .033). (e) Low frequency of memory B cells (<8.655% of total immune cells) were associated with a median EFS of 28.6 months (95% CI 0.8–56.4 months), high frequency of memory B cells (>8.655% of total immune cells) with an estimated median survival of only 11.7 months (95% CI 7.5–15.9 months) (p = .024). (f) High frequency of total T cells (>22.43% of total immune cells) were associated with a median EFS of 47 months, low frequency of total T cells (>22.43% of total immune cells) with an estimated median survival of only 14 months (95% CI 6.9–21.1 months) (p = .032). Log-rank test.
Figure 3.
Figure 3.
Combining M2 macrophage, neutrophil and T cell frequency predicts prognosis in primary ESFT. Thirty-two patients within the training cohort (GSE17679) were included in this survival analysis. Blue curve (9/32 patients): low M2, low neutrophils and high T cells (“T cell predominant”) were associated with a good prognosis (median OS not reached; median EFS: 47 months, 95% CI not determined), red curve (6/32 patients): high M2, high neutrophils and low T cells (“M2-neutrophil predominant”) were associated with a dismal prognosis (median OS: 15.6 months, 95% CI 3.2–28 months; median EFS: 11 months, 95% CI 8.7–13.3 months) and green curve (17/32 patients): any other combination of M2 macrophages, neutrophils and T cells (“mixed”) with intermediate risk (median OS not reached, median EFS: 19.4 months, 95% CI 0–39 months). (a) Overall survival analysis, p = .014. (b) Event-free survival analysis, p = .005. Log-rank test.
Figure 4.
Figure 4.
Gene expression of hallmark stemness genes and checkpoint molecules in 197 human ESFT samples. (a) Myc, HIF1α, and EZH2 are highly expressed compared to other stemness genes in ESFT. (b) Co-stimulatory (red, left) and co-inhibitory checkpoint molecules (blue, right) show a low (<7 log2 intensity value) expression in ESFTs.
Figure 5.
Figure 5.
HIF1α correlates with total T cells, M2 macrophages, and neutrophils. (a) T cells were significantly reduced in the high HIF1α expression group (mean: 26.5% vs. 19.4%). (b) M2 macrophages were significantly higher in the high HIF1α expression group (mean: 22.2% vs. 28.8%). (A) Neutrophils were significantly more abundant in the high HIF1α expression group (mean: 1.9% vs. 3.6%). The entire cohort of 197 ESFT was included. Box plots. **p < .01, ***p < .001 (Mann-Whitney-U-test).

References

    1. Delattre O, Zucman J, Plougastel B, Desmaze C, Melot T, Peter M, Kovar H, Joubert I, de Jong P, Rouleau G.. Gene fusion with an ETS DNA-binding domain caused by chromosome translocation in human tumours. Nature. 1992;359:1–10. Cited in: PMID: 1522903. doi:10.1038/359162a0. - DOI - PubMed
    1. Sorensen PH, Triche TJ. Gene fusions encoding chimaeric transcription factors in solid tumours. Semin Cancer Biol. 1996;7:3–14. Cited in: PMID: 8695764. doi:10.1006/scbi.1996.0002. - DOI - PubMed
    1. Lawlor ER, Sorensen PH. Twenty years on: what do we really know about Ewing Sarcoma and what is the path forward? Crit Rev Oncog. 2015;20:155–171. doi:10.1615/CritRevOncog.2015013553. - DOI - PMC - PubMed
    1. Grünewald TGP, Cidre-Aranaz F, Surdez D, Tomazou EM, de Álava E, Kovar H, Sorensen PH, Delattre O, Dirksen U. Ewing sarcoma. Nat Rev Dis Primers. 2018;4:5 Cited in: PMID: 29977059. doi:10.1038/s41572-018-0003-x. - DOI - PubMed
    1. Whelan J, Le Deley M-C, Dirksen U, Le Teuff G, Brennan B, Gaspar N, Hawkins DS, Amler S, Bauer S, Bielack S, et al. High-dose chemotherapy and blood autologous stem-cell rescue compared with standard chemotherapy in localized high-risk Ewing Sarcoma: results of Euro-E.W.I.N.G.99 and Ewing-2008. JCO. 2018;36:3110–3119. doi:10.1200/JCO.2018.78.2516. - DOI - PMC - PubMed

Publication types

LinkOut - more resources