

An integrative approach for fine-mapping chromatin interactions
- PMID: 31742318
- PMCID: PMC7425030
- DOI: 10.1093/bioinformatics/btz843
An integrative approach for fine-mapping chromatin interactions
Abstract
Motivation: Chromatin interactions play an important role in genome architecture and gene regulation. The Hi-C assay generates such interactions maps genome-wide, but at relatively low resolutions (e.g. 5-25 kb), which is substantially coarser than the resolution of transcription factor binding sites or open chromatin sites that are potential sources of such interactions.
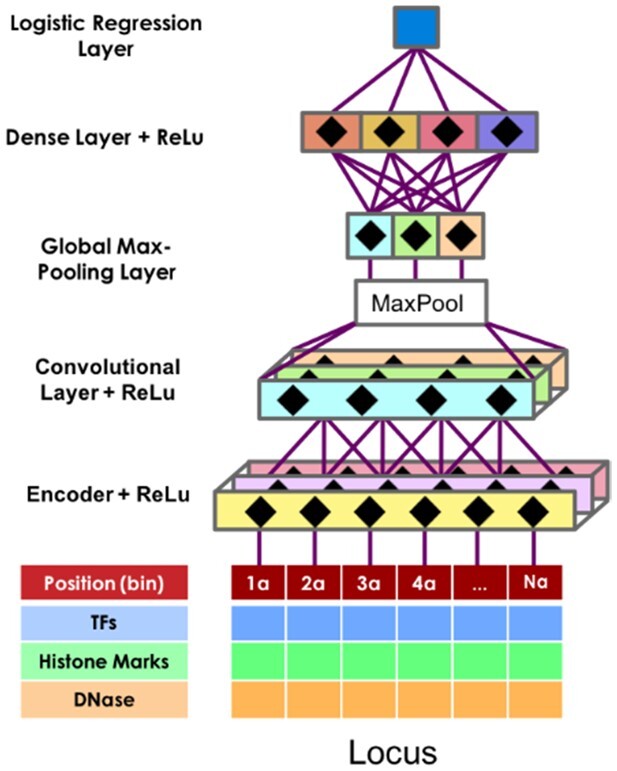
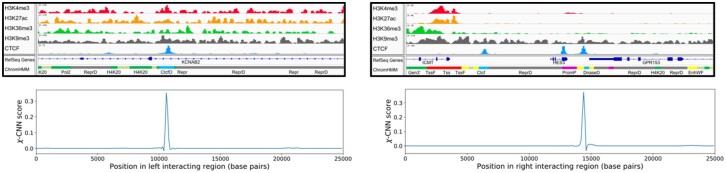
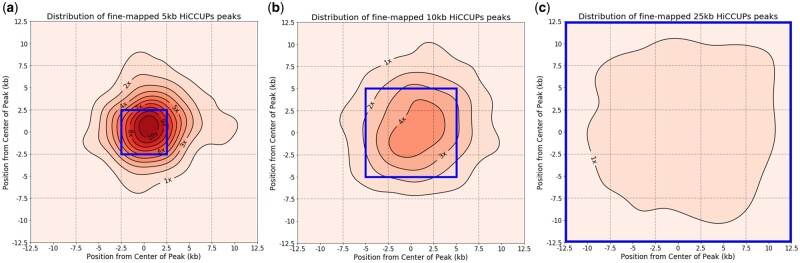
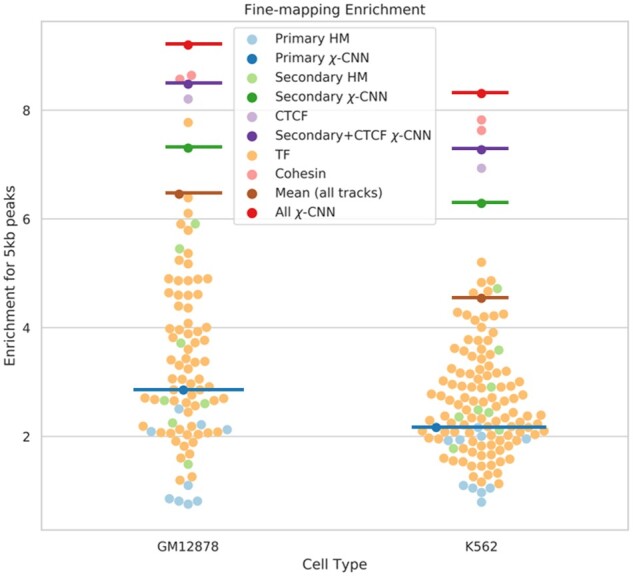
Results: To predict the sources of Hi-C-identified interactions at a high resolution (e.g. 100 bp), we developed a computational method that integrates data from DNase-seq and ChIP-seq of TFs and histone marks. Our method, χ-CNN, uses this data to first train a convolutional neural network (CNN) to discriminate between called Hi-C interactions and non-interactions. χ-CNN then predicts the high-resolution source of each Hi-C interaction using a feature attribution method. We show these predictions recover original Hi-C peaks after extending them to be coarser. We also show χ-CNN predictions enrich for evolutionarily conserved bases, eQTLs and CTCF motifs, supporting their biological significance. χ-CNN provides an approach for analyzing important aspects of genome architecture and gene regulation at a higher resolution than previously possible.
Availability and implementation: χ-CNN software is available on GitHub (https://github.com/ernstlab/X-CNN).
Supplementary information: Supplementary data are available at Bioinformatics online.
© The Author(s) 2019. Published by Oxford University Press. All rights reserved. For permissions, please e-mail: journals.permissions@oup.com.
Figures
Similar articles
-
BART3D: inferring transcriptional regulators associated with differential chromatin interactions from Hi-C data.Bioinformatics. 2021 Sep 29;37(18):3075-3078. doi: 10.1093/bioinformatics/btab173. Bioinformatics. 2021. PMID: 33720325 Free PMC article.
-
HiCNN: a very deep convolutional neural network to better enhance the resolution of Hi-C data.Bioinformatics. 2019 Nov 1;35(21):4222-4228. doi: 10.1093/bioinformatics/btz251. Bioinformatics. 2019. PMID: 31056636 Free PMC article.
-
EnHiC: learning fine-resolution Hi-C contact maps using a generative adversarial framework.Bioinformatics. 2021 Jul 12;37(Suppl_1):i272-i279. doi: 10.1093/bioinformatics/btab272. Bioinformatics. 2021. PMID: 34252966 Free PMC article.
-
hicGAN infers super resolution Hi-C data with generative adversarial networks.Bioinformatics. 2019 Jul 15;35(14):i99-i107. doi: 10.1093/bioinformatics/btz317. Bioinformatics. 2019. PMID: 31510693 Free PMC article.
-
Predicting Genome Architecture: Challenges and Solutions.Front Genet. 2021 Jan 22;11:617202. doi: 10.3389/fgene.2020.617202. eCollection 2020. Front Genet. 2021. PMID: 33552135 Free PMC article. Review.
Cited by
-
BART3D: inferring transcriptional regulators associated with differential chromatin interactions from Hi-C data.Bioinformatics. 2021 Sep 29;37(18):3075-3078. doi: 10.1093/bioinformatics/btab173. Bioinformatics. 2021. PMID: 33720325 Free PMC article.
-
Machine Learning in Epigenomics: Insights into Cancer Biology and Medicine.Biochim Biophys Acta Rev Cancer. 2021 Dec;1876(2):188588. doi: 10.1016/j.bbcan.2021.188588. Epub 2021 Jul 7. Biochim Biophys Acta Rev Cancer. 2021. PMID: 34245839 Free PMC article. Review.
-
Integrative computational epigenomics to build data-driven gene regulation hypotheses.Gigascience. 2020 Jun 1;9(6):giaa064. doi: 10.1093/gigascience/giaa064. Gigascience. 2020. PMID: 32543653 Free PMC article.
-
Machine and deep learning methods for predicting 3D genome organization.ArXiv [Preprint]. 2024 Mar 4:arXiv:2403.03231v1. ArXiv. 2024. Update in: Methods Mol Biol. 2025;2856:357-400. doi: 10.1007/978-1-0716-4136-1_22. PMID: 38495565 Free PMC article. Updated. Preprint.
-
Multimodal deep learning for biomedical data fusion: a review.Brief Bioinform. 2022 Mar 10;23(2):bbab569. doi: 10.1093/bib/bbab569. Brief Bioinform. 2022. PMID: 35089332 Free PMC article. Review.
References
-
- Abadi M. et al. (2016) TensorFlow: a system for large-scale machine learning. In: Proceedings of the 12th USENIX Symposium on Operating Systems Design and Implementation, Savannah, GA, USA, pp. 265–283.
-
- Ballard D.H. (1987) Modular learning in neural networks. In: AAAI Proceedings, Seattle, WA, USA, pp. 279–284.
-
- Bergstra J., Bengio Y. (2012) Random search for hyper-parameter optimization. J. Mach. Learn. Res., 13, 281–305.
-
- Bromley J. et al. (1994) Signature Verification Using a “Siamese” Time Delay Neural Network. American Telephone and Telegraph Company, Holmdell, NJ, USA, pp. 737–744.
