. 2020 Jan 21;92(2):1796-1803.
doi: 10.1021/acs.analchem.9b03522. Epub 2019 Dec 5.

Statistically Driven Metabolite and Lipid Profiling of Patients from the Undiagnosed Diseases Network

Affiliations

Statistically Driven Metabolite and Lipid Profiling of Patients from the Undiagnosed Diseases Network

Bobbie-Jo M Webb-Robertson et al. Anal Chem. .

Abstract

Advancements in molecular separations coupled with mass spectrometry have enabled metabolome analyses for clinical cohorts. A population of interest for metabolome profiling is patients with rare disease for which abnormal metabolic signatures may yield clues into the genetic basis, as well as mechanistic drivers of the disease and possible treatment options. We undertook the metabolome profiling of a large cohort of patients with mysterious conditions characterized through the Undiagnosed Diseases Network (UDN). Due to the size and enrollment procedures, collection of the metabolomes for UDN patients took place over 2 years. We describe the study designed to adjust for measurements collected over a long time scale and how this enabled statistical analyses to summarize the metabolome of individual patients. We demonstrate the removal of time-based batch effects, overall statistical characteristics of the UDN population, and two case studies of interest that demonstrate the utility of metabolome profiling for rare diseases.


Figures

Figure 1.
Figure 1.
Overall workflow of the UDN sample processing is defined by three core steps. (1) The collection of the normalized reference metabolome data set for which all patients and associated relatives can be assessed against. (2) Metabolome profiling of a batch of UDN patients utilizing the same quality-control samples as the reference data set to enable normalization. For both steps 1 and 2, quality-control processing to identify outlier samples using robust Mahalanobis distance panomic abundance vectors (rMd-PAV) and quality-control-based robust LOESS signal correction (QC-RLSC) for normalization is required to attain high-quality normalized data for statistical analysis. (3) Statistical comparison of all samples in a batch to the reference data collected in step 1. Steps 2 and 3 are repeated as each new UDN batch is collected.
Figure 2.
Figure 2.
Structure of blanks (X), FAMES (F), and QC (Q) samples distribution within a batch for (A) LC–MS analysis of the plasma and CSF lipids and (B) urine metabolomics. The QC sample placement is representative of the placement used for normalization for each sample type. Under the pilot project comparing the pooled and NIST-based QC samples, they were placed adjacent to one another in the design.
Figure 3.
Figure 3.
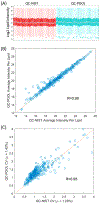
The first batch of samples included both QC-NIST and QC-POOL samples that showed similar (A) abundance profiles visually, (B) average abundance per lipid, and (C) CVs per lipid. For the abundance and CV, similarity is shown as the positive coefficient of correlation (R).
Figure 4.
Figure 4.
Pre- and post-normalization PCA plot shows a dramatic decrease in batch effects on the QC samples (A) before and (B) after normalization. The UDN samples show a similar batch effect prior to normalization (C), which is no longer visible after normalization (D). This is also shown in the reference population (+), which clusters with the first batch in panel C but is dispersed across all samples after normalization in panel D, removing the visible batch effect.
Figure 5.
Figure 5.
p-Values testing for project effects within the lipids and metabolite data show a clear increase in p-values.
Figure 6.
Figure 6.
Tukey’s post hoc test demonstrates that the correlation between replicates from the same subject is significantly larger than intrafamily and random sample relationships.
Figure 7.
Figure 7.
Bar graphs showing the number of patients in each z-score bin for the metabolite lysine, where the bin represents the number of subjects with the defined z-score range. The z-scores ±1.28, ±1.64, ±1.96, and ±2.57 correspond approximately to q-values of 0.2, 0.1, 0.05, and 0.01, respectively. Only one UDN patient (black bar) has an extremely elevated amount of lysine in comparison to the full population.
Figure 8.
Figure 8.
Volcano plot of CSF lipids from five UDN probands. Only lipids with both a significant change (p-value < 0.05) and a large fold-change (≥±2-fold relative to the reference data) are shown.

References

    1. Haijes HA; Willemsen M; Van der Ham M; Gerrits J; Pras-Raves ML; Prinsen H; Van Hasselt PM; De Sain-van der Velden MGM; Verhoeven-Duif NM; Jans JJM Metabolites 2019, 9 (1), 12. - PMC - PubMed
    1. Vinayavekhin N; Homan EA; Saghatelian A ACS Chem. Biol. 2010, 5 (1), 91–103. - PubMed
    1. Yan M; Xu G Anal. Chim. Acta 2018, 1037, 41–54. - PubMed
    1. Cheng S; Shah SH; Corwin EJ; Fiehn O; Fitzgerald RL; Gerszten RE; Illig T; Rhee EP; Srinivas PR; Wang TJ; Jain M Circ.: Cardiovasc. Genet 2017, 10 (2), e000032. - PMC - PubMed
    1. Liu J; Semiz S; van der Lee SJ; van der Spek A; Verhoeven A; van Klinken JB; Sijbrands E; Harms AC; Hankemeier T; van Dijk KW; van Duijn CM; Demirkan A Metabolomics 2017, 13 (9), 104. - PMC - PubMed

Publication types