. 2019 Nov 1;34(11):2297-2310.
doi: 10.1093/humrep/dez134.

Human induced pluripotent stem cells from two azoospermic patients with Klinefelter syndrome show similar X chromosome inactivation behavior to female pluripotent stem cells

Affiliations

Human induced pluripotent stem cells from two azoospermic patients with Klinefelter syndrome show similar X chromosome inactivation behavior to female pluripotent stem cells

Sarita Panula et al. Hum Reprod. .

Abstract

Study question: Does the X chromosome inactivation (XCI) of Klinefelter syndrome (KS)-derived human induced pluripotent stem cells (hiPSCs) correspond to female human pluripotent stem cells (hPSCs) and reflect the KS genotype?

Summary answer: Our results demonstrate for the first time that KS-derived hiPSCs show similar XCI behavior to female hPSCs in culture and show biological relevance to KS genotype-related clinical features.

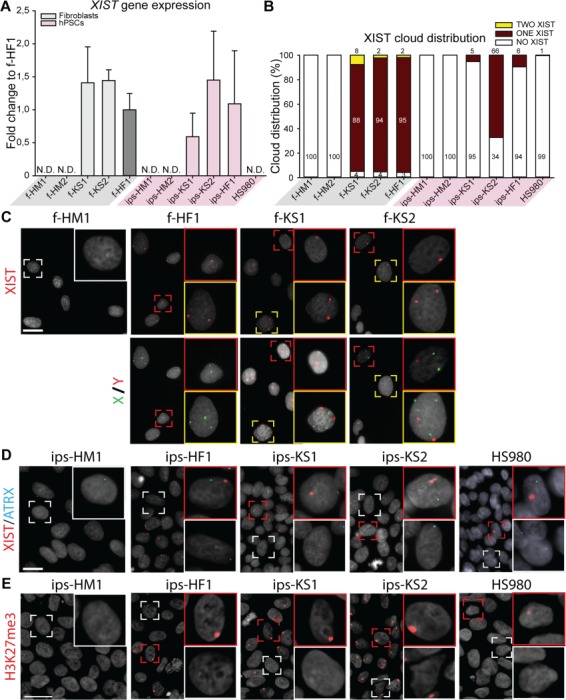
What is known already: So far, assessment of XCI of KS-derived hiPSCs was based on H3K27me3 staining and X-inactive specific transcript gene expression disregarding the at least three XCI states (XaXi with XIST coating, XaXi lacking XIST coating, and XaXe (partially eroded XCI)) that female hPSCs display in culture.

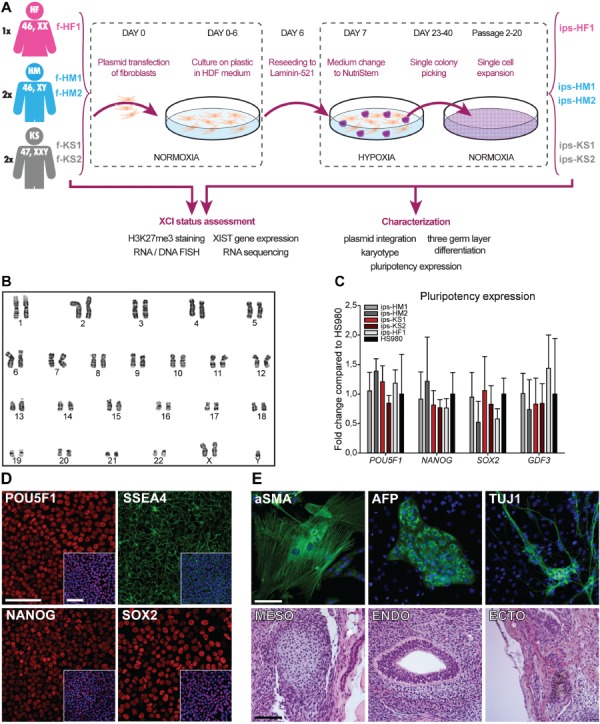
Study design, size, duration: The study used hiPSC lines generated from two azoospermic patients with KS and included two healthy male (HM) and one healthy female donor.

Participants/materials, setting, methods: In this study, we derived hiPSCs by reprograming fibroblasts with episomal plasmids and applying laminin 521 as culture substrate. hiPSCs were characterized by karyotyping, immunocytochemistry, immunohistochemistry, quantitative PCR, teratoma formation, and embryoid body differentiation. XCI and KS hiPSC relevance were assessed by whole genome transcriptomics analysis and immunocytochemistry plus FISH of KS, HM and female fibroblast, and their hiPSC derivatives.

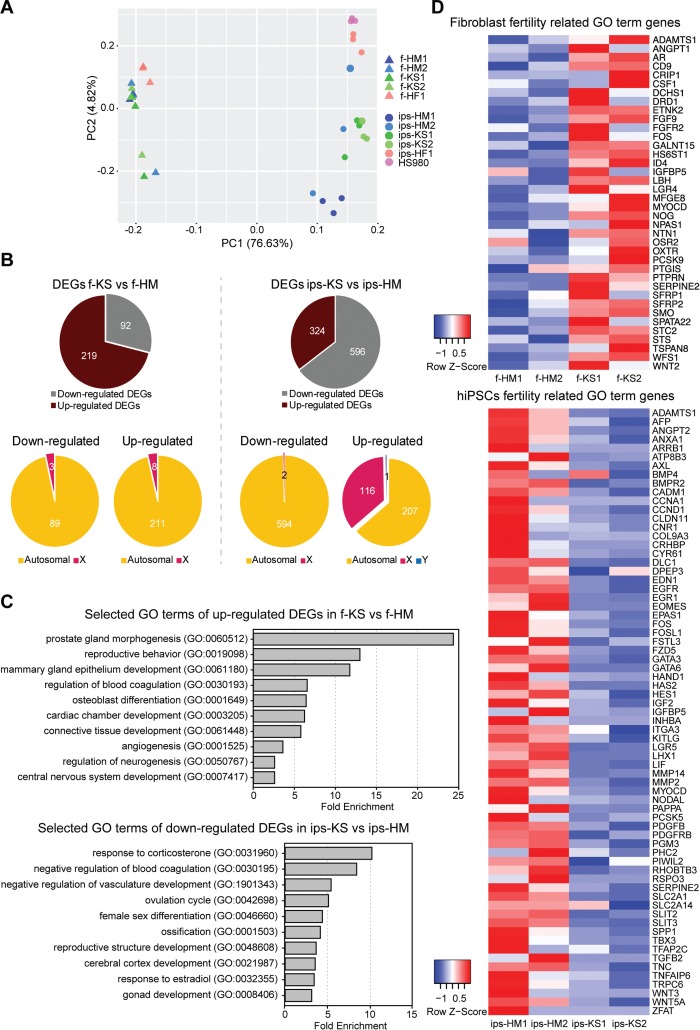
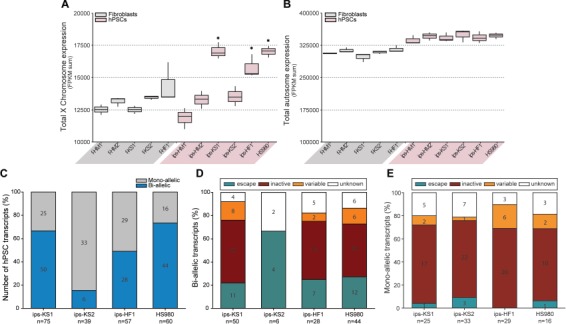
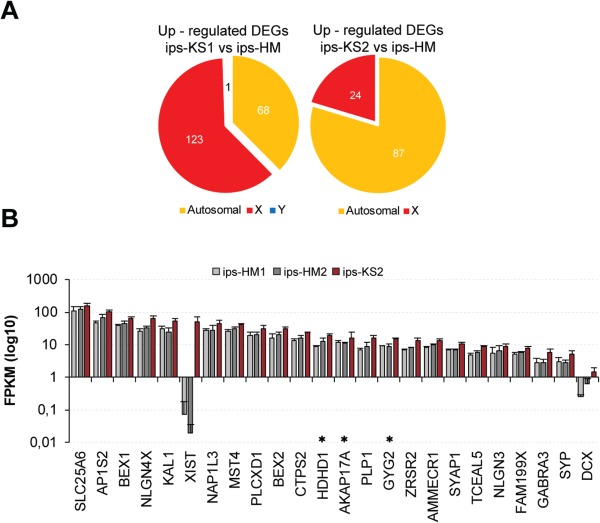
Main results and the role of chance: Applying whole genome transcriptomics analysis, we could identify differentially expressed genes (DEGs) between KS and HM donors with enrichment in gene ontology terms associated with fertility, cardiovascular development, ossification, and brain development, all associated with KS genotype-related clinical features. Furthermore, XCI analysis based on transcriptomics data, RNA FISH, and H3K27me3 staining revealed variable XCI states of KS hiPSCs similar to female hiPSCs, showing either normal (XaXi) or eroded (XaXe) XCI. KS hiPSCs with normal XCI showed nevertheless upregulated X-linked genes involved in nervous system development as well as synaptic transmission, supporting the potential use of KS-derived hiPSCs as an in vitro model for KS.

Limitations, reasons for caution: Detailed clinical information for patients included in this study was not available. Although a correlation between DEGs and the KS genotype could be observed, the biological relevance of these cells has to be confirmed with further experiments. In addition, karyotype analysis for two hiPSC lines was performed at passage 12 but not repeated at a later passage. Nevertheless, since all XCI experiments for those lines were performed between passage 11 and 15 the authors expect no karyotypic changes for those experiments.

Wider implications of the findings: As KS patients have variable clinical phenotypes that are influenced by the grade of aneuploidy, mosaicism, origin of the X chromosome, and XCI 'escapee' genes, which vary not only among individuals but also among different tissues within the same individual, differentiated KS hiPSCs could be used for a better understanding of KS pathogenesis.

Study funding/competing interest(s): This study was supported by grants from the Knut and Alice Wallenberg Foundation (2016.0121 and 2015.0096), Ming Wai Lau Centre for Reparative Medicine (2-343/2016), Ragnar Söderberg Foundation (M67/13), Swedish Research Council (2013-32485-100360-69), the Centre for Innovative Medicine (2-388/2016-40), Kronprinsessan Lovisas Förening För Barnasjukvård/Stiftelsen Axel Tielmans Minnesfond, Samariten Foundation, Jonasson Center at the Royal Institute of Technology, Sweden, and Initial Training Network Marie Curie Program 'Growsperm' (EU-FP7-PEOPLE-2013-ITN 603568). The authors declare no conflicts of interest.

Keywords: Klinefelter syndrome; X chromosome inactivation; XXY condition; human induced pluripotent stem cells; integration-free; laminin 521; xeno-free.


Figures

Figure 1
Figure 1
Feeder-free reprogramming conditions with nonintegrating episomal plasmids and characterization of hiPSCs. (A) Overview of reprogramming and characterization schema. (B) Chromosomal G-band analysis of at least 25 mitoses confirmed KS karyotype 47,XXY for ips-KS2 cells at passage 20. A representative image is shown. (C) Gene expression of pluripotency markers POU Class 5 Homeobox 1 (POU5F1), Nanog Homeobox (NANOG), SRY-Box 2 (SOX2), and Growth Differentiation Factor 3 (GDF3) for all hiPSC lines was similar to a hESC line (HS980) cultured on laminin 521 (LN521). Mean expression of three biological replicates with ±SD. (D) Expression of NANOG, POU5F1, SOX2, and stage-specific embryonic antigen-4 (SSEA4) was confirmed at protein level; ips-KS2 is shown as a representative line. Nuclei were counterstained with DAPI (blue) as shown in the small merged image in the lower right corner; scale bar is equal to 100 μm. (E) Three germ-layer formation from ips-KS2. Upper panel shows representative images with cytoskeletal staining of alpha-smooth muscle actin (aSMA, mesoderm) and neuron-specific class III beta-tubulin (TUJ1, ectoderm) as well as alpha fetoprotein (AFP, endoderm) in green with DAPI (blue) as counterstaining. Lower panel shows meso-, endo-, and ectodermal structures of paraffin-embedded teratomas stained with hematoxylin and eosin. Scale bar is equal to 100 μm. See also Supplementary Figure S1.
Figure 2
Figure 2
KS fibroblasts and hiPSCs show differentially expressed genes (DEGs) related to the clinical genotype of the KS disorder. (A) Principal component (PC) analysis with top 10 000 expressing genes of KS, HM and HF fibroblasts (triangle) and corresponding hiPSC as well as female hESC line HS980 (circle). See also Supplementary Tables SII. (B) Downregulated and upregulated DEGs comparing KS with HM fibroblast and KS with HM hiPSCs. P < 0.05 and fold change ≥1.5. See also Supplementary Tables SII and SIII. (C) Fold change of enriched GO terms of KS disorder-related terms for upregulated DEGs of KS fibroblasts, and downregulated DEGs of KS iPSCs, FDR <0.01. See also Supplementary Tables SIV–SVI. (D) Heatmap of gene expression levels associated with fertility-related GO terms in HM and KS fibroblasts and MH and KS hiPSCs. See also Supplementary Tables SV and SVII.
Figure 3
Figure 3
X chromosome inactivation (XCI) analysis of KS fibroblasts and hiPSCs indicates different XCI states. (A) Gene expression level of XCI marker, XIST, relative to female fibroblasts (f-HF1). Mean expression of three biological replicates with ±SD; N.D. means no detection. (B) Distribution of XIST cloud expression in each cell line based on RNA FISH: one cloud (red), no cloud (white), or two clouds (yellow). Total count from three independent experiments, with >193 cells counted per cell line. (C) Upper panel shows representative images of RNA fluorescence in situ hybridization (FISH) with one (red square) or two (yellow square) XIST clouds in HF (f-HF1) and KS (f-KS1 and f-KS2) fibroblasts. HM fibroblasts (f-HD1) were used as negative control showing no clouds (white square). Lower panel shows DNA FISH for X chromosome (green) and Y chromosome (red) for upper panel cells. DAPI (gray) was used as counterstaining. Scale bar is equal to 50 μm. (D) Representative images of RNA FISH with one (red square) or no (white square) XIST (red) cloud in HF (ips-HF1 and HS980) and KS (ips-KS1 and ips-KS2) hPSCs. HM hiPSCs (ips-HM1) were used as negative control showing no XIST (red) clouds. Active transcription site of ATRX is shown in blue. DAPI (gray) was used as counterstaining. Scale bar is equal to 50 μm. (E) Immunostaining of hPSCs for silencing methylation mark, H3K27me3 (red), with positive accumulation mark (red square) or no staining (white square). DAPI (gray) was used as counterstaining. Scale bar is equal to 50 μm.
Figure 4
Figure 4
Transcriptomics analysis of XCI state of KS fibroblasts and hiPSC confirms the XaXe and XaXi state of KS hiPSCs. (A) Total X chromosome expression (sum of FPKM values for X-linked genes) for HM, KS and HF fibroblasts and hiPSCs, and HS980. Significant compared to HM fibroblasts (f-HM-1 and f-HM2), HM hiPSCs (ips-HM1 and ips-HM2), KS fibroblasts (f-KS1 and f-KS2), and ips-KS2. Box-and-whisker plots representing the median value with 50% of all data falling within the box. The `whiskers' extend to the fifth and 95th percentiles, P < 0.05. (B) Total autosomal expression (sum of FPKM values for autosomal genes) for HM, KS and HF fibroblasts and hiPSCs, and HS980. Box-and-whisker plots representing the median value with 50% of all data falling within the box. The `whiskers' extend to the fifth and 95th percentiles. (C) Number of transcripts showing mono-allelic or bi-allelic expression in KS and HF hPSCs. Results combined from three biological replicates. (D) Reported XCI status of bi-allelic transcripts (E) and mono-allelic transcripts in KS and HF hPSCs. See also Supplementary Figure SII and Supplementary Table SVIII.
Figure 5
Figure 5
Upregulation of X-linked genes in ips-KS2 related to nervous system development, synaptic transmission, and metabolic processes. (A) Chromosomal distribution of upregulated DEGs comparing either ips-KS1 or ips-KS2 with HM hiPSCs. See also Supplementary Table SIX. (B) Expression of X-linked genes showing up-regulated expression in ips-KS2 compared to HM hiPSC. Mean expression of three biological replicates with ±SD. Asterisk indicates upregulated genes that showed also bi-allelic expression in ips-KS2. See also Supplementary Tables SVIII and SIX.

Similar articles

Cited by

References

    1. Albalushi H, Kurek M, Karlsson L, Landreh L, Kjartansdóttir KR, Söder O, Hovatta O, Stukenborg JB. Laminin 521 stabilizes the pluripotency expression pattern of human embryonic stem cells initially derived on feeder cells. Stem Cells Int 2018;2018:9. - PMC - PubMed
    1. Ayanlaja AA, Xiong Y, Gao Y, Ji G, Tang C, Abdikani Abdullah Z, Gao D. Distinct features of Doublecortin as a marker of neuronal migration and its implications in cancer cell mobility. Front Mol Neurosci 2017;10:199. - PMC - PubMed
    1. Belling K, Russo F, Jensen AB, Dalgaard MD, Westergaard D, Rajpert-De Meyts E, Skakkebaek NE, Juul A, Brunak S. Klinefelter syndrome comorbidities linked to increased X chromosome gene dosage and altered protein interactome activity. Hum Mol Genet 2017;26:1219–1229. - PMC - PubMed
    1. Bonomi M, Rochira V, Pasquali D, Balercia G, Jannini EA, Ferlin A, Klinefelter Italia NG. Klinefelter syndrome (KS): genetics, clinical phenotype and hypogonadism. J Endocrinol Invest 2017;40:123–134. - PMC - PubMed
    1. Botman O, Wyns C. Induced pluripotent stem cell potential in medicine, specifically focused on reproductive medicine. Front Surg 2014;1:5. - PMC - PubMed

Publication types