. 2019 Nov 18;51(4):476-487.e7.
doi: 10.1016/j.devcel.2019.10.018.

Tricalbin-Mediated Contact Sites Control ER Curvature to Maintain Plasma Membrane Integrity

Affiliations

Tricalbin-Mediated Contact Sites Control ER Curvature to Maintain Plasma Membrane Integrity

Javier Collado et al. Dev Cell. .

Abstract

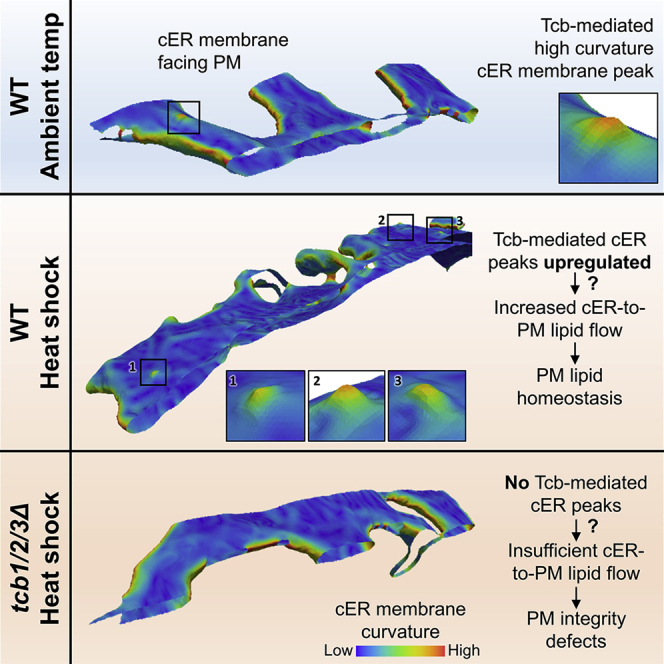
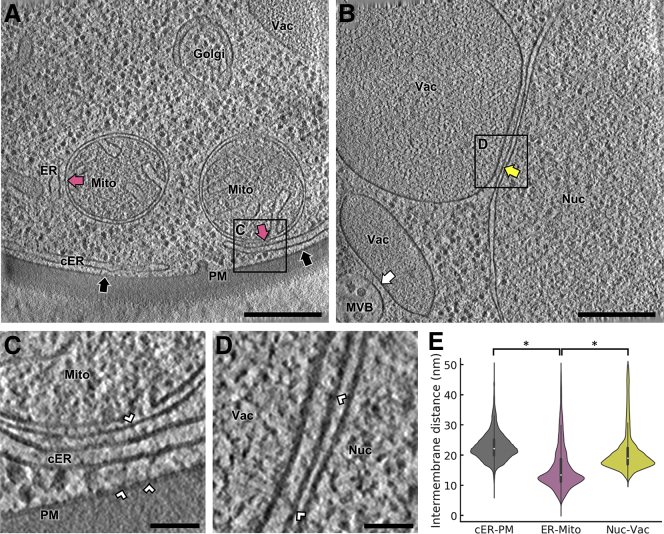
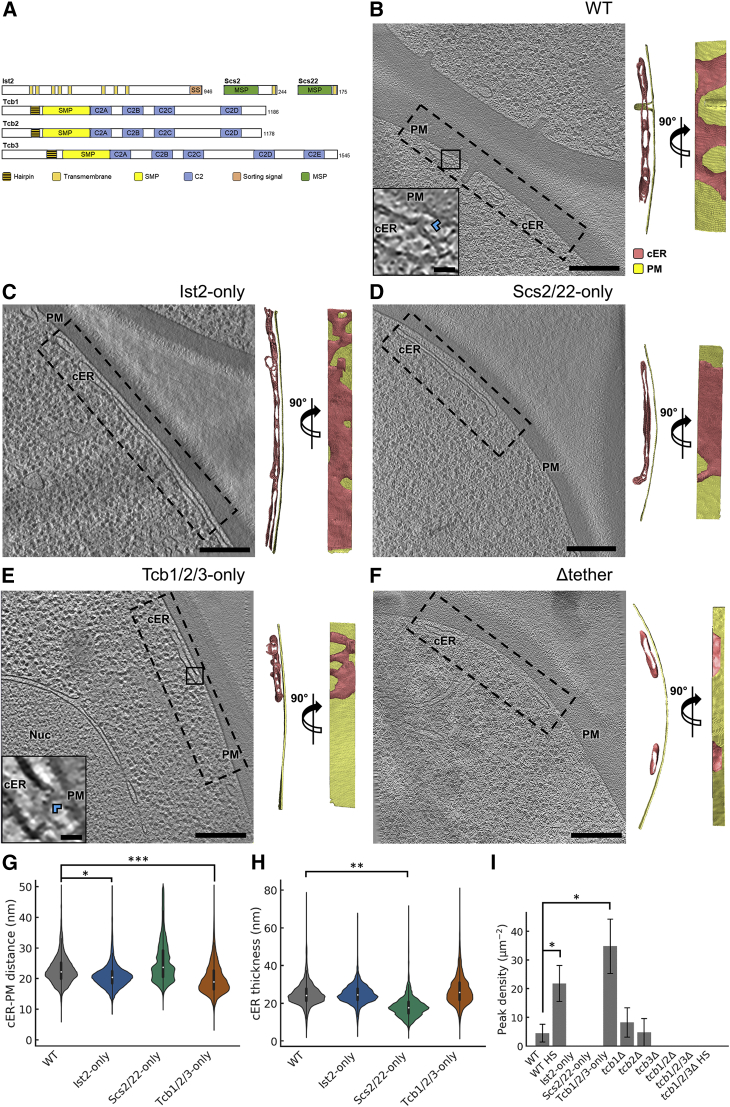
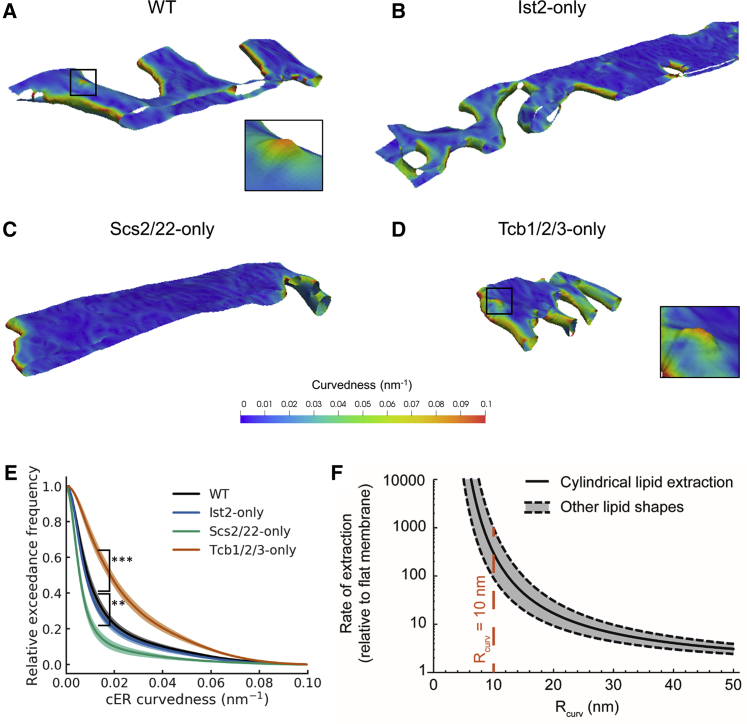
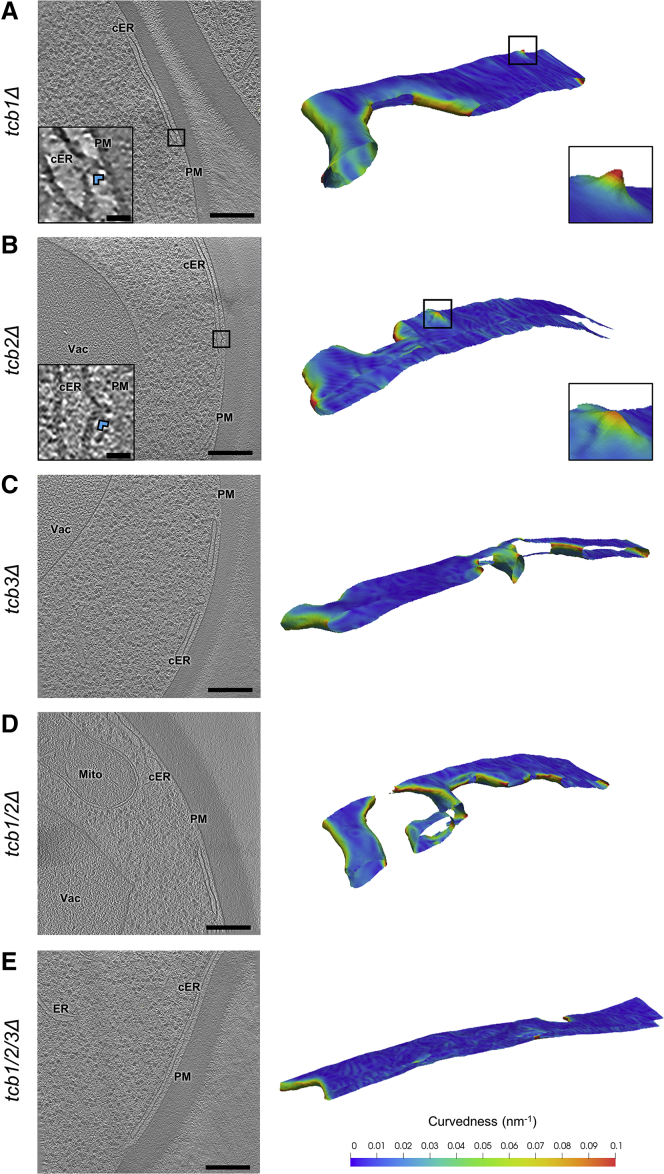
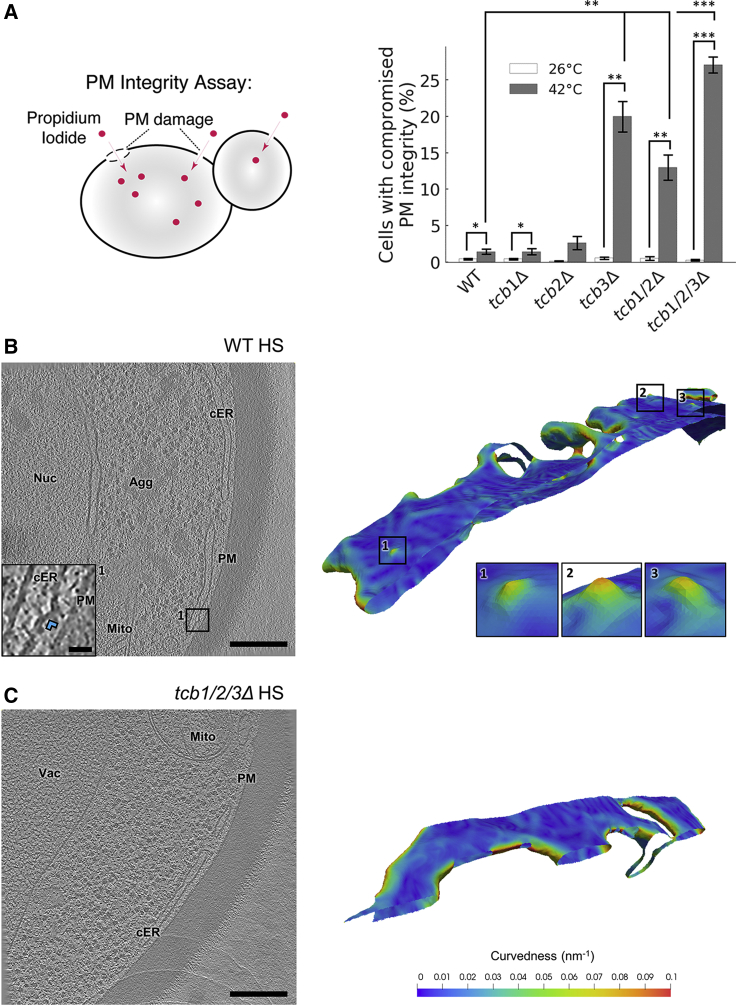
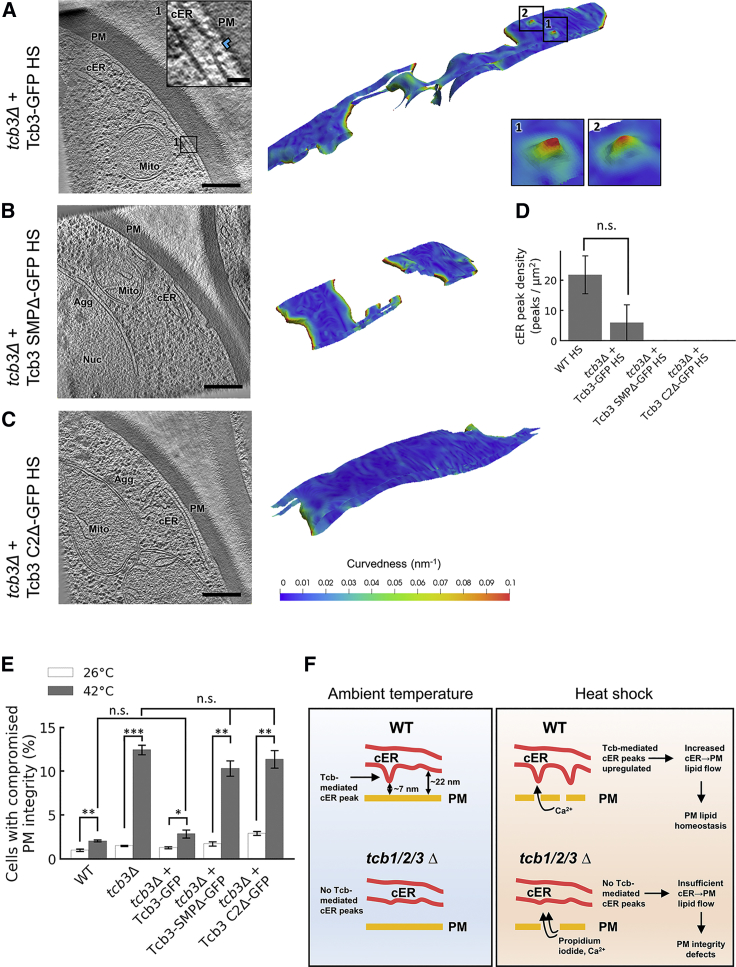
Membrane contact sites (MCS) between the endoplasmic reticulum (ER) and the plasma membrane (PM) play fundamental roles in all eukaryotic cells. ER-PM MCS are particularly abundant in Saccharomyces cerevisiae, where approximately half of the PM surface is covered by cortical ER (cER). Several proteins, including Ist2, Scs2/22, and Tcb1/2/3 are implicated in cER formation, but the specific roles of these molecules are poorly understood. Here, we use cryo-electron tomography to show that ER-PM tethers are key determinants of cER morphology. Notably, Tcb proteins (tricalbins) form peaks of extreme curvature on the cER membrane facing the PM. Combined modeling and functional assays suggest that Tcb-mediated cER peaks facilitate the transport of lipids between the cER and the PM, which is necessary to maintain PM integrity under heat stress. ER peaks were also present at other MCS, implying that membrane curvature enforcement may be a widespread mechanism to regulate MCS function.

Keywords: cryo-ET; cryo-FIB; cryo-electron tomography; cryo-focused ion beam milling; endoplasmic reticulum; membrane contact site; membrane curvature; plasma membrane; tricalbins.


Conflict of interest statement

The authors declare no competing interests.

Figures

None
Graphical abstract
Figure 1
Figure 1
Cryo-ET Imaging of MCS in WT S. cerevisiae (A) 1.4 nm-thick tomographic slice showing cER-PM MCS (black arrows) and ER-mitochondria MCS (purple arrows). The boxed area is magnified in (C). ER: endoplasmic reticulum; cER: cortical ER; Golgi: Golgi apparatus; Mito: mitochondrion; PM: plasma membrane; Vac: vacuole. (B) 1.4 nm-thick tomographic slice showing a nucleus-vacuole junction (yellow arrow) and a multivesicular body-vacuole MCS (white arrow). The boxed area is magnified in (D). MVB: multivesicular body; Nuc: nucleus. (C) Magnification of the area boxed in (A). White arrowheads: intermembrane tethers. (D) Magnification of the area boxed in (B). (E) Violin plots showing the distribution of intermembrane distances of cER-PM, ER-mitochondrion and nucleus-vacuole MCS. The plots show the complete distribution of values including all MCS analyzed. A white dot represents the median, a black slab the interquartile range, and a black line 1.5x the interquartile range. indicates p < 0.05 by unpaired t test. N = 6 (cER-PM), 5 (ER-mitochondria) and 5 (nucleus-vacuole) MCS in WT cells. Scale bars: 300 nm (A, B), 50 nm (C, D). See also Figure S2; Table S1.
Figure 2
Figure 2
cER Morphology in ER-PM MCS Tether Mutants (A) Domain structure of the main ER-PM tethers. Ist2 is an ER multipass transmembrane protein with a long and presumably unstructured cytosolic tail. The C-terminal sorting signal (SS) binds the PM. Scs2 and Scs22 are ER transmembrane proteins containing an N-terminal MSP domain. Tcb proteins are anchored to the ER membrane by a hairpin sequence. In their cytoplasmic C-terminus, Tcbs contain an SMP domain and a variable number of C2 domains. Panels B through F show 1.4-nm-thick tomographic slices of cER in the indicated strains (left) and 3D renderings in two perpendicular orientations upon a 90° rotation along an axis parallel to the PM (right). cER: cortical ER (pink); Nuc: nucleus; PM: plasma membrane (gold). (B) WT cell, (C) Ist2-only cell, (D) Scs2/22-only cell, (E) Tcb1/2/3-only cell, (F) Δtether cell. Insets in (B) and (E) show cER peaks (blue arrowheads). Scale bars: 300 nm (main panels); 25 nm (insets). Panels G, H, and I show quantifications of cER-PM distance (G), cER thickness (H) and cER peak density per μm2 of cER membrane area (I). In G and H the violin plots show the complete distribution of values for all MCS analyzed. A white dot represents the median, a black slab the interquartile range, and a black line 1.5 times the interquartile range. Panel I shows average values (gray bars) and SE (error bars). HS: heat shock (42°C for 10 min). , ∗∗, and ∗∗∗ indicate, respectively, p < 0.05, p < 0.01 and p < 0.01 by unpaired t test (G, H) or Mann-Whitney U test (I). N = 6 (WT), 7 (WT HS), 5 (Ist2-only), 5(Scs2/22-only), 9 (Tcb1/2/3-only), 5 (tcb1Δ), 5 (tcb2Δ), 5 (tcb3Δ), 5 (tcb1/2Δ), 5 (tcb1/2/3Δ), and 5 (tcb1/2/3Δ HS) cER-PM MCS. See also Figures S1 and S2; Table S1.
Figure 3
Figure 3
Quantification of cER Curvature (A–D) 3D visualizations of cER curvedness in the indicated strains. Insets in (A) and (D) show cER peaks. (A) WT cell, (B) Ist2-only cell, (C) Scs2/22-only cell, (D) Tcb1/2/3-only cell. (E) Quantification of cER curvedness, shown as an exceedance plot. The shaded lines represent the average across all MCS ± SE for each bin (1 nm-1.). ∗∗ and ∗∗∗ indicate, respectively, p < 0.01 and p < 0.001 by unpaired t test. N = 6 (WT), 7 (WT HS), 5 (Ist2-only), 5 (Scs2/22-only), and 9 (Tcb1/2/3-only) cER-PM MCS. (F) Enhancement of the rate of lipid extraction by membrane curvature according to a theoretical model. The plot shows the rate of extraction computed for a standard cylindrical lipid (black curve) as well as for lipids of other shapes, such as conical or inverted conical lipids (gray-shaded area between the dashed, black curves). The value of the radius of curvature of the experimentally observed cER peaks is denoted by the dashed red line. 1/Rcurv is equivalent to the curvedness for κ12. See also Figures S3 and S4; Table S1.
Figure 4
Figure 4
cER Peaks in Tcb Mutants (A–E) 1.4-nm-thick tomographic slices of cER in the indicated strains (left) and 3D renderings of cER curvature (right). (A) tcb1Δ, (B) tcb2Δ, (C) tcb3Δ, (D) tcb1/2Δ, (E) tcb1/2/3Δ cell. cER: cortical ER; Mito: mitochondrion; PM: plasma membrane; Vac: vacuole. Insets in (A) and (B) show cER peaks (blue arrowheads). Scale bars for tomographic slices: 300 nm (main panels), 25 nm (insets). See also Figure S2; Table S1.
Figure 5
Figure 5
PM Integrity and cER Curvature under Heat Stress (A) Schematic of the propidium iodide assay to assess PM integrity (left) and PM integrity measurements of Tcb deletion mutants upon 10-min incubation at 42°C (right). The entry of propidium iodide in cells with compromised PM integrity was measured by flow cytometry. The plot shows average values (white/gray bars) for each condition ± SE (error bars). , ∗∗, and ∗∗∗, respectively, indicate p < 0.05, p < 0.01, and p < 0.001 by Mann-Whitney U test (for tcb1Δ 26°C data, which was not normally distributed) or unpaired t test (for all other conditions). Four independent biological repeats were performed for all conditions. (B and C) 1.4-nm-thick tomographic slices of cER in the indicated strains (left) and 3D renderings of cER curvature (right). Agg: aggregate; cER: cortical ER; Mito: mitochondrion; Nuc: nucleus; PM: plasma membrane; Vac: vacuole. (B) WT cell under heat stress (HS). Insets show cER peaks (blue arrowhead in the tomographic slice inset). (C) tcb1/2/3Δ cell under heat stress. Scale bars: 300 nm (main panels), 25 nm (inset). See also Figures S2 and S4; Table S1.
Figure 6
Figure 6
cER Peaks and PM Integrity in Heat-Shocked Tcb3 Truncation Mutants (A–C) 1.4-nm-thick tomographic slices of cER in the indicated strains (left) and 3D renderings of cER curvature (right). Agg: aggregate; cER: cortical ER; Mito: mitochondrion; Nuc: nucleus; PM: plasma membrane. (A) tcb3Δ + Tcb3-GFP HS, (B) tcb3Δ + Tcb3 SMPΔ- GFP HS, (C) tcb3Δ + Tcb3 C2Δ-GFP HS. Insets show cER peaks (blue arrowhead in the tomographic slice inset). Scale bars for tomographic slices: 300 nm (main panels); 25 nm (insets). The contrast of the tomographic slices in (A), (B), and (C) was enhanced using a deconvolution filter. (D) cER peak density per μm2 of cER membrane area showing average values (gray bars) ± SE (error bars). N = 7 (WT HS), 3 (tcb3Δ + Tcb3-GFP HS), 3 (tcb3Δ + Tcb3 SMPΔ-GFP HS), and 3 (tcb3Δ + Tcb3 C2Δ-GFP HS) ER-PM MCS. n.s. indicates p > 0.05 by Mann-Whitney U test. (E) PM integrity assay of tcb3Δ cells complemented with Tcb3 truncation mutants upon 10-min incubation at 42°C. The plot shows average values (white/gray bars) for each condition ± SE (error bars). n.s., , ∗∗, and ∗∗∗, respectively, indicate p > 0.05, p < 0.05, p < 0.01, and p < 0.001 by unpaired t test. Four independent biological repeats were performed for all conditions. (F) Model for the function of cER peaks in maintaining PM integrity. In WT cells, Tcbs generate membrane peaks of extreme curvature on the cER membrane. This may facilitate the extraction of cER lipids and their delivery to the PM (top left). The generation of cER peaks is the main structural role of Tcbs at ER-PM MCS, as overall ER-PM tethering is not substantially affected by Tcb1/2/3 deletion. However, tcb1/2/3Δ cells lack cER peaks (bottom left). Under heat stress, influx of extracellular Ca2+ through a damaged PM drives the localized formation of additional Tcb-mediated cER peaks, which in turn facilitate sufficient delivery of cER lipids to the PM to maintain PM integrity (top right). Absence of cER peaks in heat stressed tcb1/2/3Δ cells leads to PM integrity defects allowing influx of propidium iodide (bottom right). See also Figure S4; Table S1.

References

    1. Ackema K.B., Prescianotto-Baschong C., Hench J., Wang S.C., Chia Z.H., Mergentaler H., Bard F., Frank S., Spang A. Sar1, a novel regulator of ER-mitochondrial contact sites- sar1. PLoS One. 2016;11:e0154280. - PMC - PubMed
    1. Ahrens J., Geveci B., Law C. Visualization Handbook. Elsevier; 2005. ParaView: an end-user tool for large data visualization.
    1. Andrews N.W., Corrotte M. Plasma membrane repair. Curr. Biol. 2018;28:R392–R397. - PubMed
    1. Antonny B. Mechanisms of membrane curvature sensing. Annu. Rev. Biochem. 2011;80:101–123. - PubMed
    1. Balla T. Ca(2+) and lipid signals hold hands at endoplasmic reticulum-plasma membrane contact sites. J. Physiol. (Lond.) 2018;596:2709–2716. - PMC - PubMed

Publication types

MeSH terms

LinkOut - more resources