

Reiber's Diagram for Kappa Free Light Chains: The New Standard for Assessing Intrathecal Synthesis?
- PMID: 31744096
- PMCID: PMC6963502
- DOI: 10.3390/diagnostics9040194
Reiber's Diagram for Kappa Free Light Chains: The New Standard for Assessing Intrathecal Synthesis?
Abstract
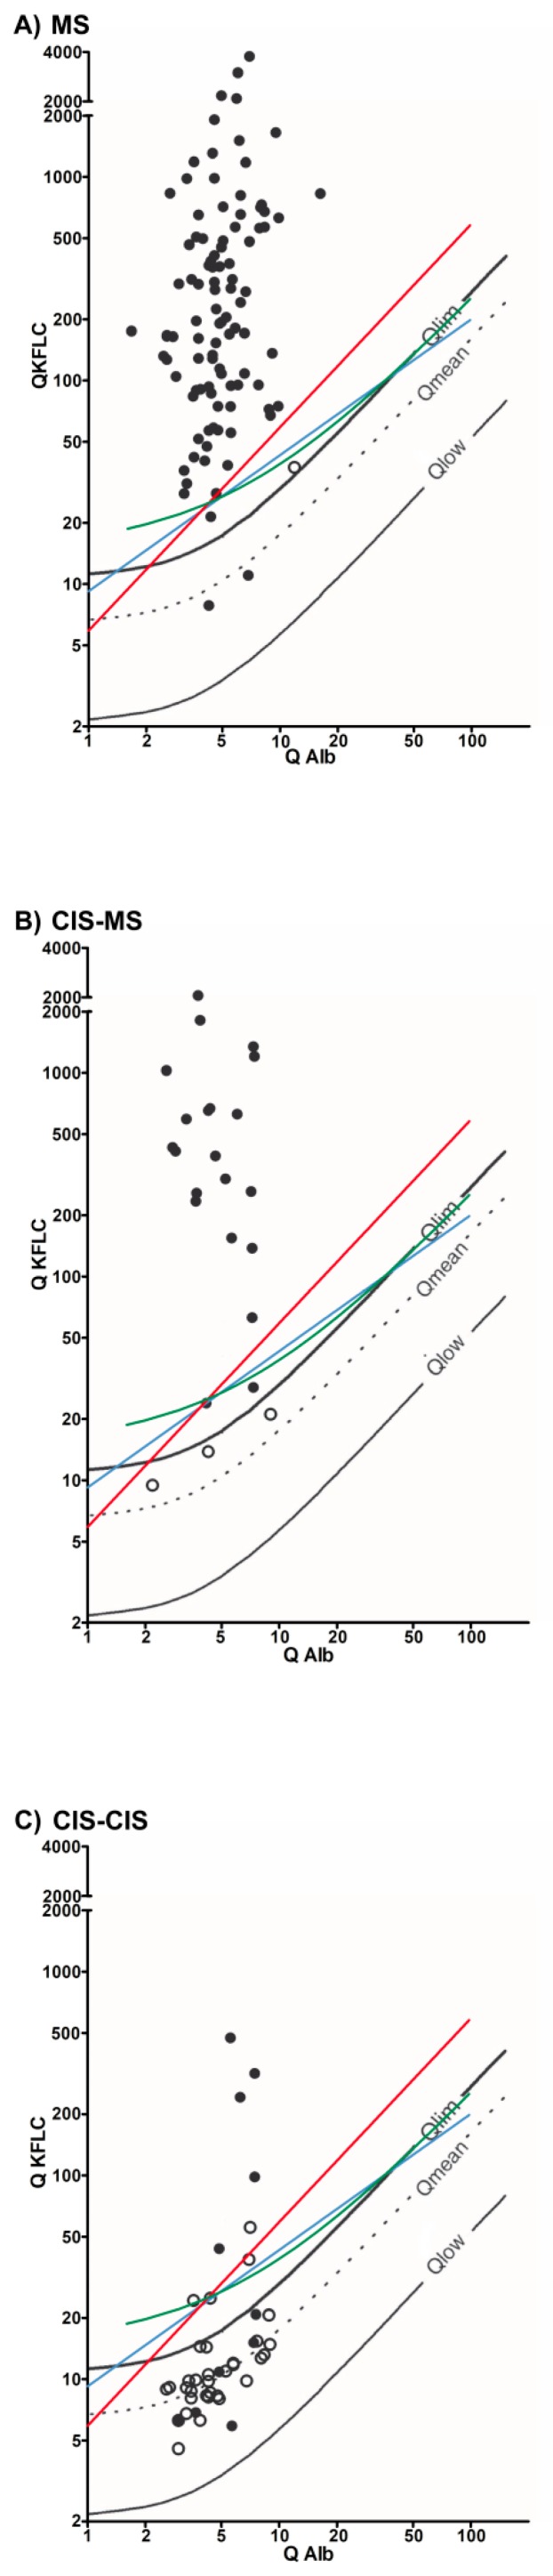
Oligoclonal bands are the gold standard for determination of an intrathecal immunoglobulin G synthesis and were recently included in the McDonald criteria of 2017 to diagnose relapsing multiple sclerosis (MS) as a substitute for dissemination in time. Intrathecally produced kappa free light chains (KFLC) are a novel promising biomarker with similar characteristics and the advantage for automated determination. However, different approaches exist to determine the intrathecal KFLC fraction. The most common method is to calculate the CSF/serum KFLC quotient with reference to the albumin CSF/serum quotient (QKappa/QAlb) the so-called KFLC index. Recently, Reiber developed a theoretically and empirically founded hyperbolic function similar to his traditional hyperbolic function for the immunoglobulins A, G, M. Our study included a total of 168 patients with either MS according to the McDonald criteria of 2017, clinically isolated syndrome (CIS) with conversion to MS during follow-up, or stable CIS. Positive oligoclonal bands were compared with the KFLC index, Reiber's KFLC diagram, Presslauer's KFLC exponential curve, and Senel's linear curve for KFLC. Reiber's diagram detected an intrathecal production of KFLC in 98/100 patients with MS, only one patient fewer than oligoclonal bands positivity (99/100). By using the KFLC index ≥ 5.9, Presslauer's KFLC exponential function, and Senel's linear curve two more patients would not have been identified (96/100). For the group of patients who converted from CIS to MS similar results were obtained for both the oligoclonal bands and the Reiber graph (21/24, 88%). The KFLC index ≥ 5.9, Presslauer's method, and Senel's linear function each identified two patients fewer (19/24, 79%). In patients with stable CIS, 11/44 patients (25%) displayed oligoclonal bands in contrast to 9/44 patients (20%) with elevated KFLC by using Reiber's diagram and Presslauer's method, 8/44 patients (18%) with elevated KFLC as detected by Senel's linear function, and 7/44 patients (16%) with KFLC index ≥ 5.9. In conclusion, Reiber's KFLC diagram shows a great diagnostic performance to detect an intrathecal KFLC production in patients with MS.
Keywords: Reiber’s diagram; biomarker; cerebrospinal fluid; hyperbolic function; kappa free light chains; multiple sclerosis.
Conflict of interest statement
The authors declare no conflict of interest.
Figures
References
-
- Presslauer S., Milosavljevic D., Huebl W., Aboulenein-Djamshidian F., Krugluger W., Deisenhammer F., Senel M., Tumani H., Hegen H. Validation of kappa free light chains as a diagnostic biomarker in multiple sclerosis and clinically isolated syndrome: A multicenter study. Mult. Scler. 2016;22:502–510. doi: 10.1177/1352458515594044. - DOI - PubMed
LinkOut - more resources
Full Text Sources
Medical
Miscellaneous
