. 2020 Feb 11;141(6):464-478.
doi: 10.1161/CIRCULATIONAHA.119.042501. Epub 2019 Nov 20.

Endothelial Cell-Derived Interleukin-18 Released During Ischemia Reperfusion Injury Selectively Expands T Peripheral Helper Cells to Promote Alloantibody Production

Affiliations

Endothelial Cell-Derived Interleukin-18 Released During Ischemia Reperfusion Injury Selectively Expands T Peripheral Helper Cells to Promote Alloantibody Production

Lufang Liu et al. Circulation. .

Abstract

Background: Ischemia reperfusion injury (IRI) predisposes to the formation of donor-specific antibodies, a factor contributing to chronic rejection and late allograft loss.

Methods: We describe a mechanism underlying the correlative association between IRI and donor-specific antibodies by using humanized models and patient specimens.

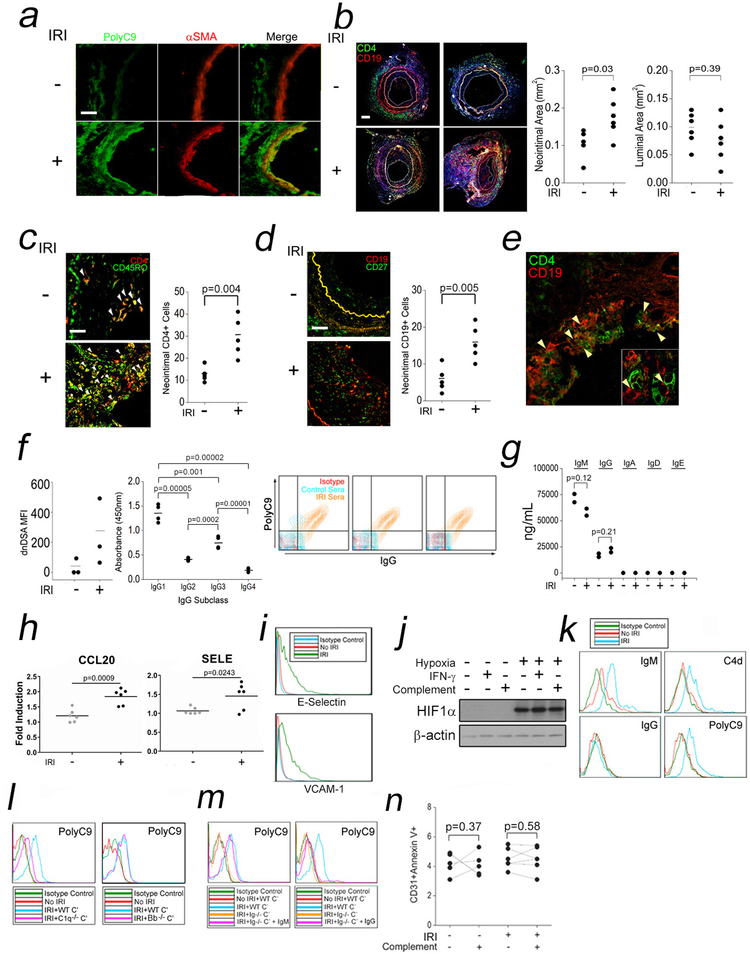
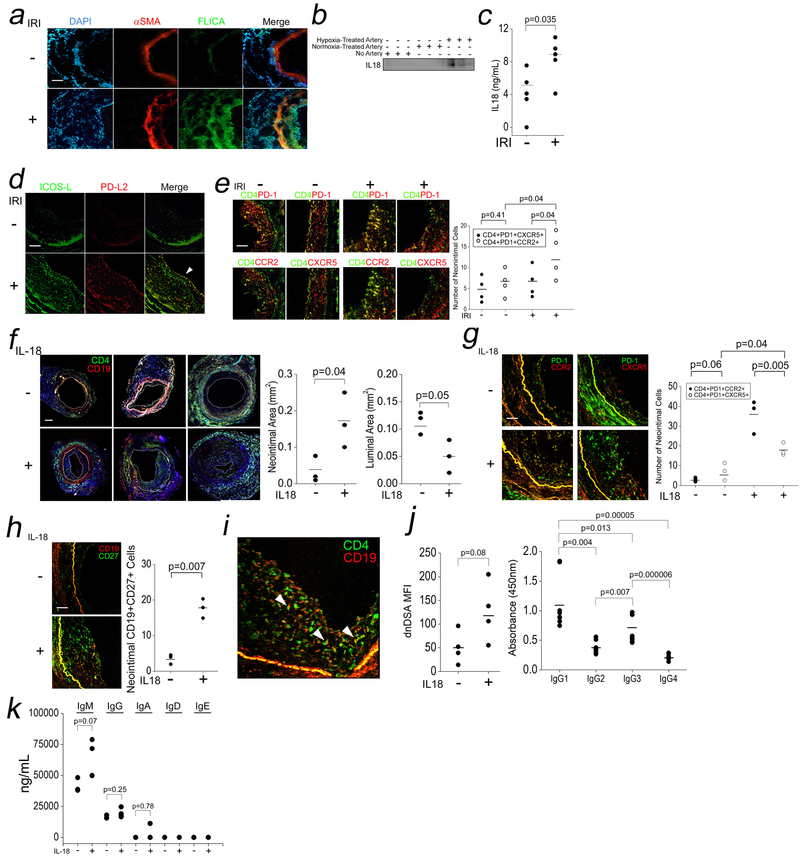
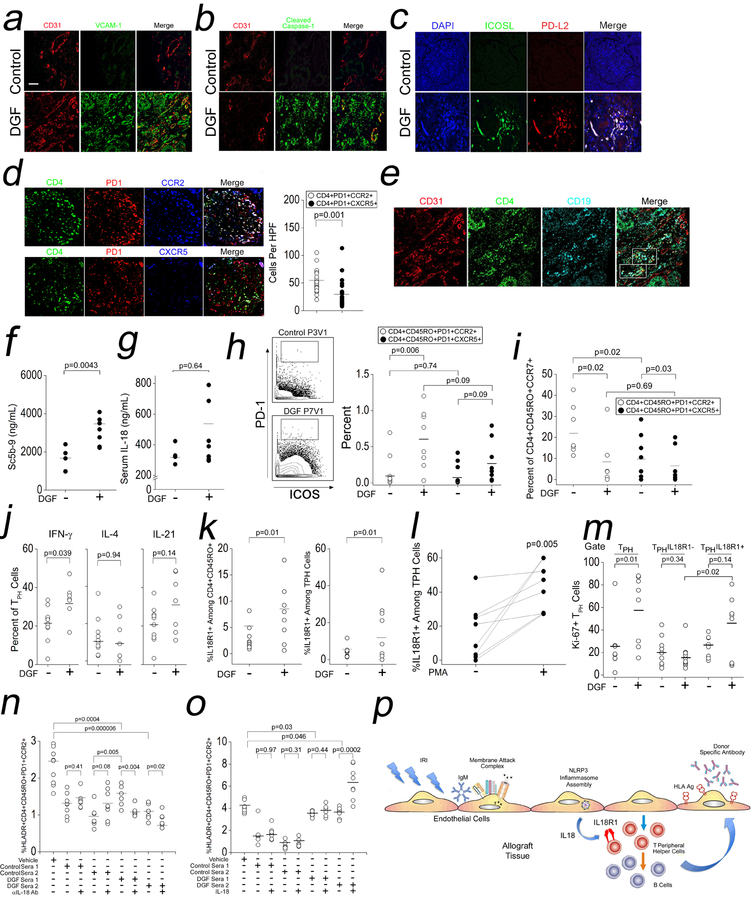
Results: IRI induces immunoglobulin M-dependent complement activation on endothelial cells that assembles an NLRP3 (NOD-like receptor pyrin domain-containing protein 3) inflammasome via a Rab5-ZFYVE21-NIK axis and upregulates ICOS-L (inducible costimulator ligand) and PD-L2 (programmed death ligand 2). Endothelial cell-derived interleukin-18 (IL-18) selectively expands a T-cell population (CD4+CD45RO+PD-1hiICOS+CCR2+CXCR5-) displaying features of recently described T peripheral helper cells. This population highly expressed IL-18R1 and promoted donor-specific antibodies in response to IL-18 in vivo. In patients with delayed graft function, a clinical manifestation of IRI, these cells were Ki-67+IL-18R1+ and could be expanded ex vivo in response to IL-18.

Conclusions: IRI promotes elaboration of IL-18 from endothelial cells to selectively expand alloreactive IL-18R1+ T peripheral helper cells in allograft tissues to promote donor-specific antibody formation.

Keywords: T-lymphocytes, helper-inducer; antibody specificity; complement system proteins; inflammasomes; interleukin-18; reperfusion injury.


Conflict of interest statement

CONFLICT OF INTEREST DISCLOSURES

All of the authors listed in this manuscript declare no financial conflicts of interest and have no financial disclosures.

Figures

Fig 1.
Fig 1.. Humanized Models of IRI to Recapitulate Features of CABMR.
Human coronary artery grafts were subjected to ex vivo normoxia or hypoxia for 12h prior to implantation as infrarenal interposition grafts in descending aortae of SCID/bg mice engrafted with human lymphoid cells. Four weeks after implantation, artery tissues were harvested for analysis. Control (n=6) and IRI-treated (n=6) xenografts were analyzed for MAC (PolyC9, a, scale bar: 200μm), vasculopathy (b, scale bar: 400μm), neointimal CD4+CD45RO+ T cells (c, scale bar: 200μm), CD19+CD27+ B cells (d, scale bar: 200μm), and CD4+ T cell:CD19+ B cell “conjugates” (e). Total dnDSA (f, left) and dnDSA IgG subclasses from host sera were quantified (f, middle). HUVEC were pretreated with IFN-γ (50ng/mL) for 48h prior to overlay of control or murine sera (25% v/v) in gelatin veronal buffer for 2h prior to FACS analysis (f, right). Sera Ig isotypes were quantified (g). HUVEC subjected to “IRI” were analyzed by qRT-PCR (h), FACS (i), and Western blot (j). Cells were analyzed by FACS after “IRI” (k) and in the presence of WT, C1q, (l, left) or Bb-deficient (l, right) human sera. HUVEC were subjected to “IRI” using total Ig-depleted sera in the presence of exogenous IgM (2mg/mL) or IgG (8mg/mL) and analyzed by FACS (m). HUVEC were subjected to “IRI” and assessed by FACS (n). Student’s t-test was used for Fig 1b, 1c, 1d, 1f, left, 1g, and 1h. One-way ANOVA followed by Tukey’s pairwise comparison was used for Fig 1f, middle. A two-way repeated measured ANOVA was used for Fig 1n. Experiments above were repeated 2–6 times using ≥2 pools of HUVEC donors.
Fig 2.
Fig 2.. A Rab5-ZFYVE21-NIK Axis Activates an NLRP3 Inflammasome in “IRI”-Treated EC.
Following “IRI” without (a) or with IFN-γ pretreatment (b, 50ng/mL for 48–72h), HUVEC were tested by qRT-PCR. Western blots of HUVEC lysates after 4h of hypoxia followed by varying normoxia times (c). Western blots of “IRI”-treated HUVEC subjected to 4h of hypoxia followed by 2h of normoxia (d). HUVEC were pretreated for 30min with Ac-YVAD-CMK or Ac-YVAD-FMK prior to “IRI” (e). HUVEC were pretreated with MCC950 as indicated for 30min prior to “IRI” (f). “IRI”-treated HUVEC were assessed by Western blot (g). HUVEC stably transduced with Rab5 WT or Rab5 DN constructs were probed by Western blot following “IRI” (h). Western blot analysis of EC transfected with control or ZFYVE21 siRNA (i). “IRI”-treated HUVEC were analyzed by FACS (j) in the presence or absence of depleting Ab as indicated (k). Student’s t-test was used for Fig 2a and 2b. One-way ANOVA followed by Tukey’s pairwise comparison was used for Fig 2k. Experiments were repeated 2–4 times using ≥2 HUVEC donors.
Fig 3.
Fig 3.. “IRI”-Treated EC Selectively Expand TPH Cells In Vitro.
HUVEC were subjected to “IRI” in the presence or absence of normal human sera as a source of complement (C’) prior to co-culture with CD4+CD45RO+ T cells (Tmem) for 7–10 days prior to T cell analysis for activation (a, top) and proliferation (a, bottom). ***p<0.001, **p<0.005, *p<0.05, N.S. not significant (p>0.05). Tmem cocultured with HUVEC subjected to “IRI” in the presence of WT C’, C1q-deficient C’, or C6-deficient C’ (b). Tmem were cocultured with IRI-treated EC and analyzed for CD4+CD45RO+PD-1+CXCR5-CCR2+ and CD4+CD45RO+PD-1+CXCR5+CCR2- T cells (c). FACS-sorted T cells were cocultured with IRI-treated EC as indicated and analyzed by FACS (d). Tmem were cocultured with EC for 7–10 days and bcl-6:BLIMP ratios were assessed (e). Tmem were cocultured with EC for 14 days and intracellular cytokines were analyzed (f). “IRI”-treated EC were cocultured with FACS-sorted T cells in the presence of autologous B cells for 14 days, and supernatant titers of anti-class I (g, left) and anti-class II (g, right) HLA Ab specific for cultured EC, i.e., dnDSA, were quantified (g) along with dnDSA IgG subclasses (h). Total Ig isotypes were quantified by ELISA (i). Student’s t-test was used for Fig 3c. One-way ANOVA followed by Tukey’s pairwise comparison was used for Fig 3g, 3h, and 3i. Two-way ANOVA followed by Tukey’s pairwise comparison was used for Fig 3a, 3b, 3d, and 3f. Experiments were repeated 2–8 times using ≥2 PBMC donors and ≥2 HUVEC donors.
Fig 4.
Fig 4.. IL-18 Directly Expands IL-18R1+ TPH Cells.
EC were treated with Ac-YVAD-FMK (a) or MCC950 (b) during “IRI” prior to coculture with CD4+CD45RO+ T cells (Tmem) in the presence or absence of exogenous IL-18 (0.5μg) as indicated for 10 days prior to FACS analysis. TPH cells and TFH cells were gated among Tmem cocultured with “IRI”-treated ECs in the presence IL-18-depleting antibody (10μg/mL, c, left) or exogenous IL-18 as indicated (c, right). Mean fluorescent intensities (MFI) of bcl-6 and BLIMP1 were assessed in Tmem with αIL-18 Ab (d, left) or exogenous IL-18 (d, right) following coculture with IRI-treated EC. Tmem were stimulated with “IRI”-treated EC (e). IL-18R1 expression after gating on TPH and TFH cell populations following 7 day coculture with “IRI”-treated HUVEC (f). TPH and TFH cells were analyzed after gating on IL-18R1 (g). Tmem were stimulated with αCD3/CD28 for 24h prior in the presence or absence of IL-18 (h,i). IL-18R1 shRNA was transduced into “IRI”-treated HUVEC, Tmem, or both prior to EC:T cell coculture for 7 days (j, **p<0.001, N.S., not significant). Student’s t-test was used for Fig 4e and 4g. Two-way ANOVA followed by Tukey’s pairwise comparison was used for Fig 4a, 4b, 4c, 4d, 4f, 4h, 4i, and 4j. Experiments were repeated 2–6 times using ≥3 PBMC donors and ≥2 HUVEC donors.
Fig 5.
Fig 5.. IRI-Induced Inflammasomes in EC and IL-18-Mediated TPH Cell Expansion In Vivo.
Human coronary artery grafts were subjected to ex vivo hypoxia and surgically implanted into descending aortae of SCID/bg mice for 24h prior to analysis by I.F. for FLICA (a, scale bar: 200μm) and sera were analyzed by Western blot IL-18 (b) and ELISA (c). n=3–5 for the above experiments. Grafts were analyzed for ICOS-L and PD-L2 (d, 250μm) and TPH and TFH cell infiltrates (e, scale bar: 250μm). Hosts bearing normoxia-treated human arteries were injected i.p. with vehicle or IL-18 (10μg/dy) for 14 days. Neointimal and luminal areas were calculated (f, scale bar: 400μm), and neointimal TPH cells and TFH cells were quantified (g, scale bar: 250μm) along with CD19+CD27+ B cells (h). CD4+:CD19+ cell “conjugates” were visualized in neointimal tissues (i). Sera was tested for dnDSA Ab titers (j, left), dnDSA IgG subclasses (j, right), and Ig isotypes (k). Student’s t-test was used for Fig 5c, 5f, 5h, and 5j, left. One-way ANOVA followed by Tukey’s pairwise comparison was used for Fig 5j, right, and 5k. Two-way ANOVA followed by Tukey’s pairwise comparison was used for Fig 5e and 5g.
Fig 6.
Fig 6.. IL-18-Dependent Expansion of IL-18R1+ TPH Cells in DGF Patients.
Archived biopsies from patients with DGF who developed CABMR were analyzed by I.F. (a-e). Prospectively collected sera from control or DGF renal transplant patients were assessed for complement activation (f) and IL-18 (g). PBMCs from control or DGF renal transplant patients were analyzed by CyTOF (h-m). In (j) and (l), PBMCs were stimulated for 4h with PMA/ionomycin prior to CyTOF analysis. Non-autologous Tmem were stimulated with αCD3/CD28 for 24hr in the presence of 10% v/v autologous sera from DGF or control patients in the presence αIL-18 Ab (n) or exogenous IL-18 (o). Proposed model connecting IRI with CABMR (p). Scale bars: 300μm. Student’s t-test was used for Fig 6d, 6f, 6g, 6j, 6k, and 6l. Two-way ANOVA followed by Tukey’s pairwise comparison was used for Fig 6h, 6i, 6m, 6n, and 6o.

Comment in

  • Mechanisms Underlying Antibody-Mediated Rejection.
    Baldwin W 3rd, Valujskikh A. Baldwin W 3rd, et al. Circulation. 2020 Feb 11;141(6):479-481. doi: 10.1161/CIRCULATIONAHA.119.044541. Epub 2020 Feb 10. Circulation. 2020. PMID: 32078432 Free PMC article. No abstract available.

References

    1. Wu WK, Famure O, Li Y, Kim SJ. Delayed graft function and the risk of acute rejection in the modern era of kidney transplantation. Kidney Int. 2015;88:851–858. - PubMed
    1. Levine DJ, Glanville AR, Aboyoun C, Belperio J, Benden C, Berry GJ, Hachem R, Hayes D Jr, Neil D, Reinsmoen NL, et al. Antibody-mediated rejection of the lung: a consensus report of the International Society for Heart and Lung Transplantation. J Heart Lung Transplant. 2016; 35:397–406. - PubMed
    1. Demetris AJ, Bellamy C, Hubscher SG, O’Leary J, Randhawa PS, Feng S, Neil D, Colvin RB, McCaughan G, Fung JJ, et al. Comprehensive update of the Banff Working Group on Liver Allograft Pathology: introduction of antibody-mediated rejection. Am J Transplant. 2016;16:2816–2835. - PubMed
    1. Haas M, Loupy A, Lefaucheur C, Roufosse C, Glotz D, Seron D, Nankivell BJ, Halloran PF, Colvin RB, Akalin E, et al. The Banff 2017 Kidney Meeting Report: revised diagnostic criteria for chronic active T cell-mediated rejection, antibody-mediated rejection, and prospects for integrative endpoints for next-generation clinical trials. Am J Transplant. 2018;18:293–307. - PMC - PubMed
    1. Wiebe C, Gibson IW, Blydt-Hansen TD, Karpinski M, Ho J, Storsley LJ, Goldberg A, Birk PE, Rush DN, Nickerson PW. Evolution and clinical pathologic correlations of de novo donor-specific HLA antibody post kidney transplant. Am J Transplant. 2012;12:1157–1167. - PubMed

Publication types

MeSH terms