. 2020 Sep;16(9):1584-1597.
doi: 10.1080/15548627.2019.1689770. Epub 2019 Nov 19.

Restriction of intracellular Salmonella replication by restoring TFEB-mediated xenophagy

Affiliations

Restriction of intracellular Salmonella replication by restoring TFEB-mediated xenophagy

Veena Ammanathan et al. Autophagy. 2020 Sep.

Abstract

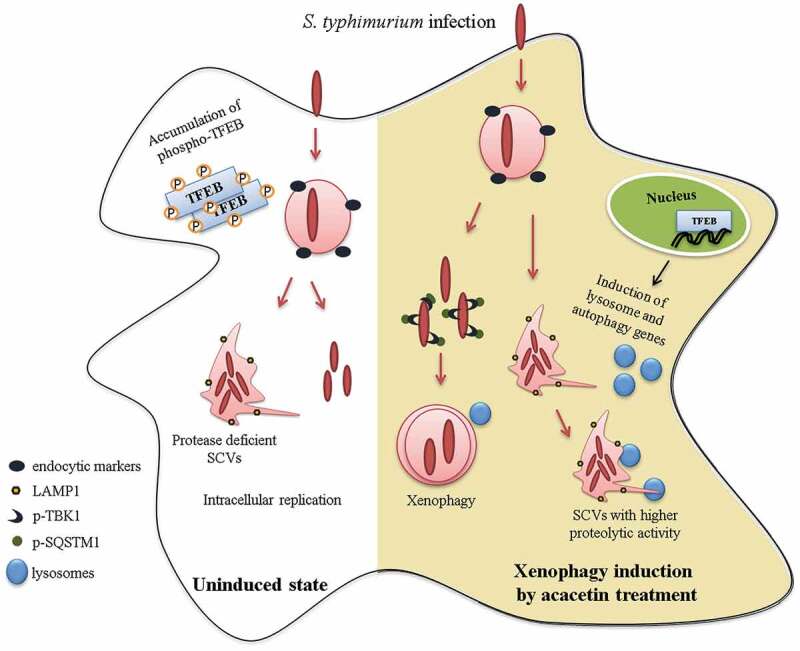
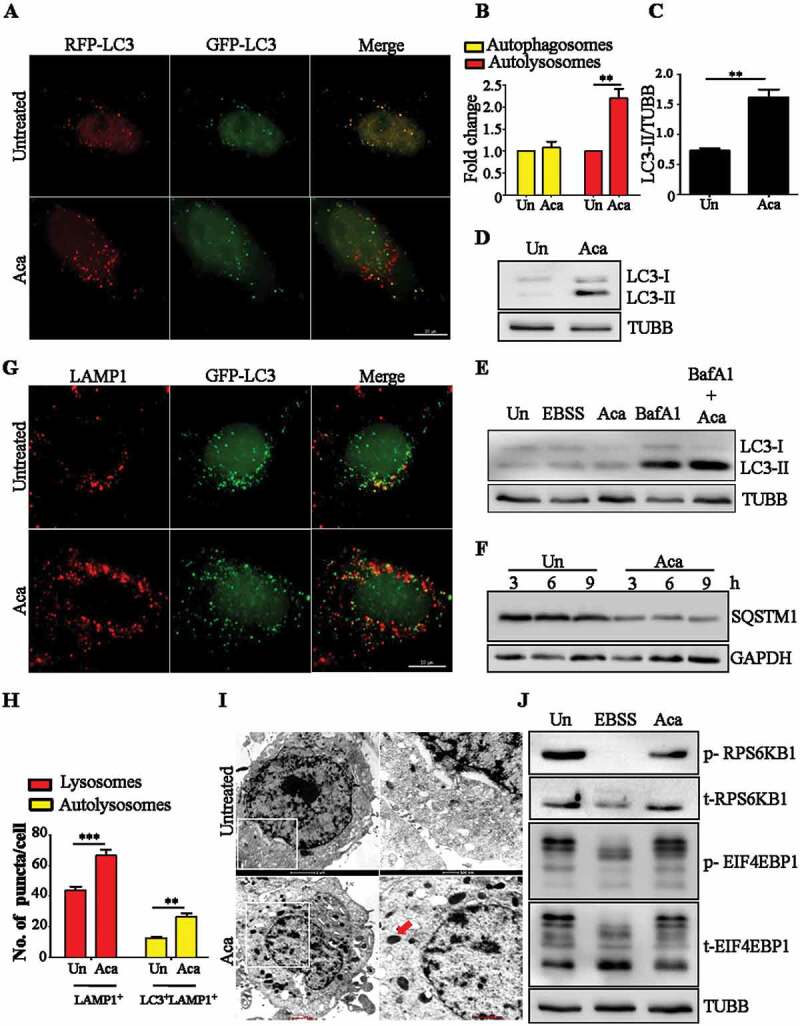
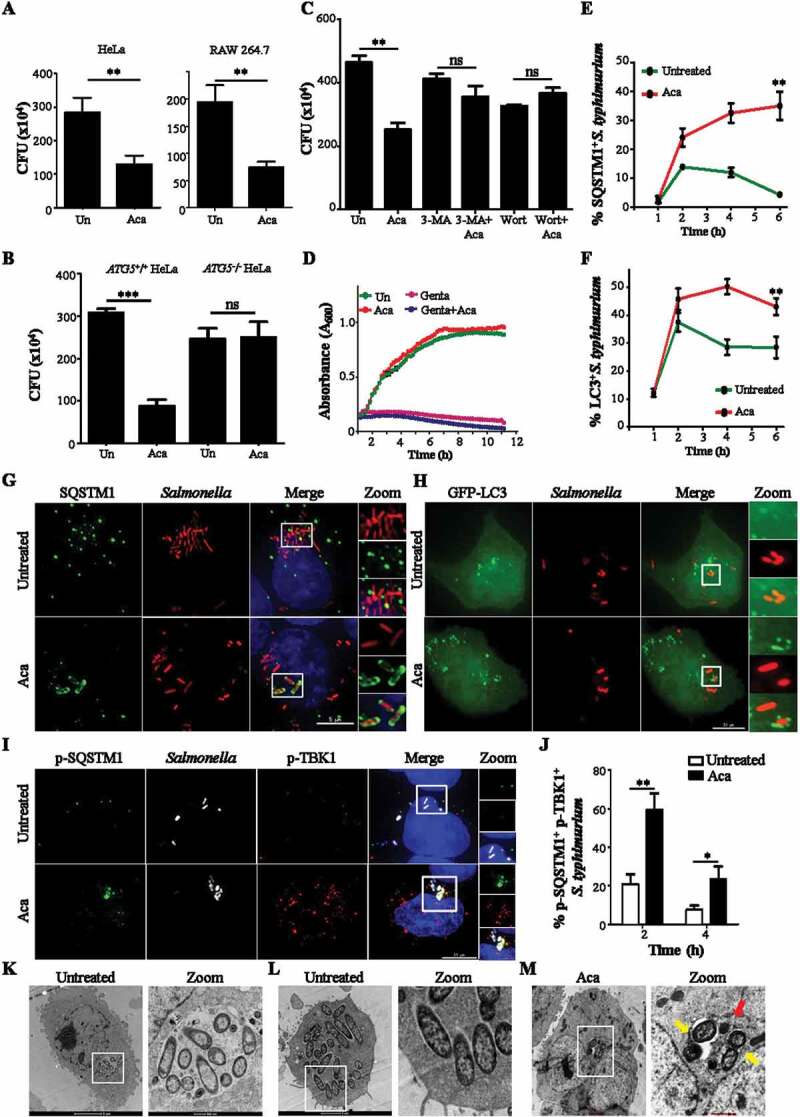
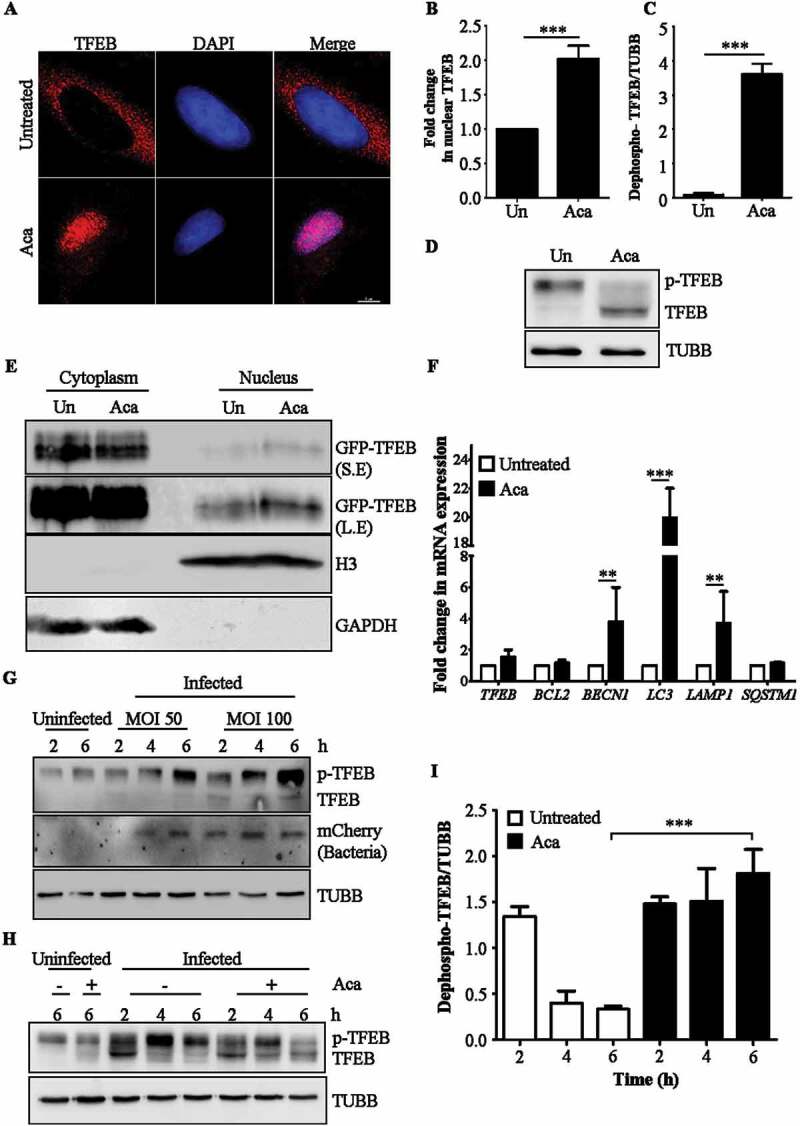
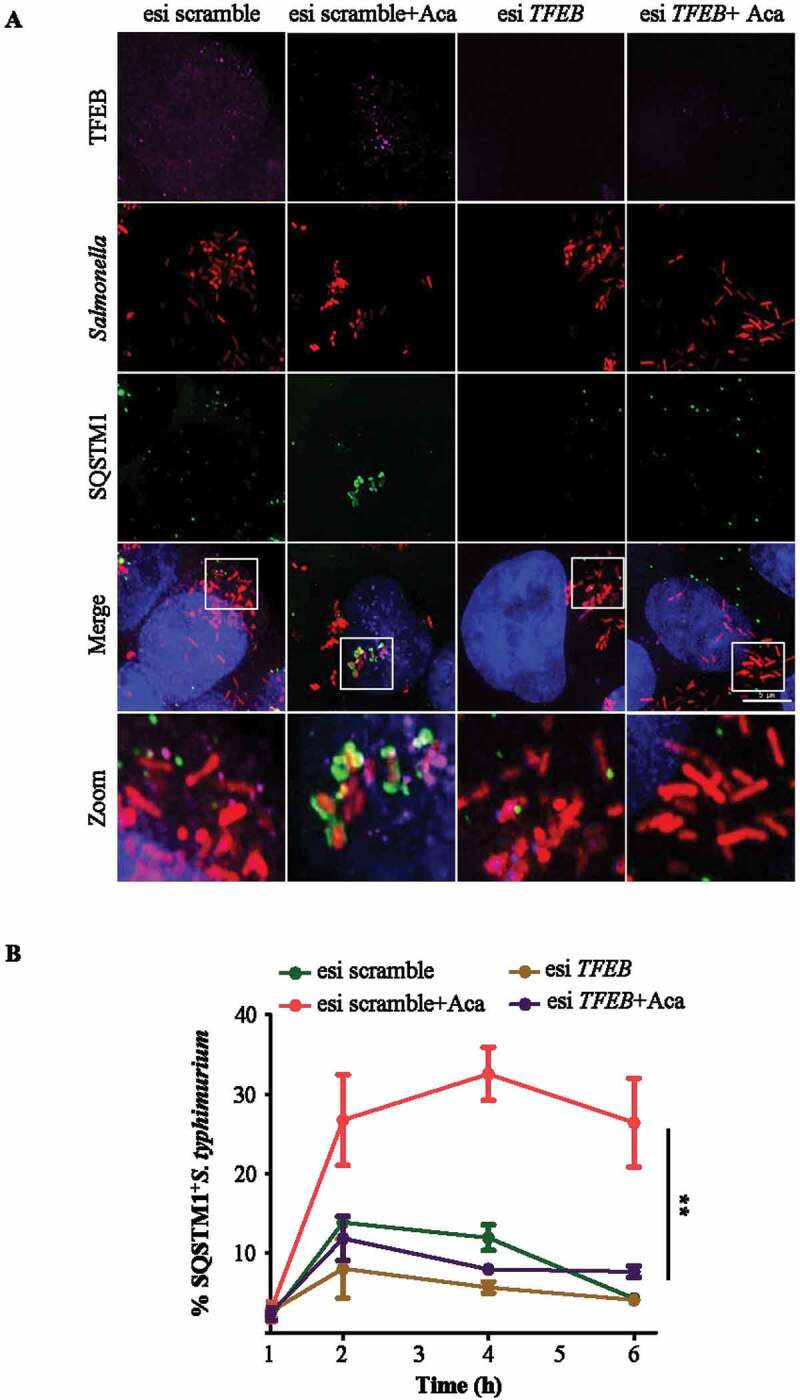
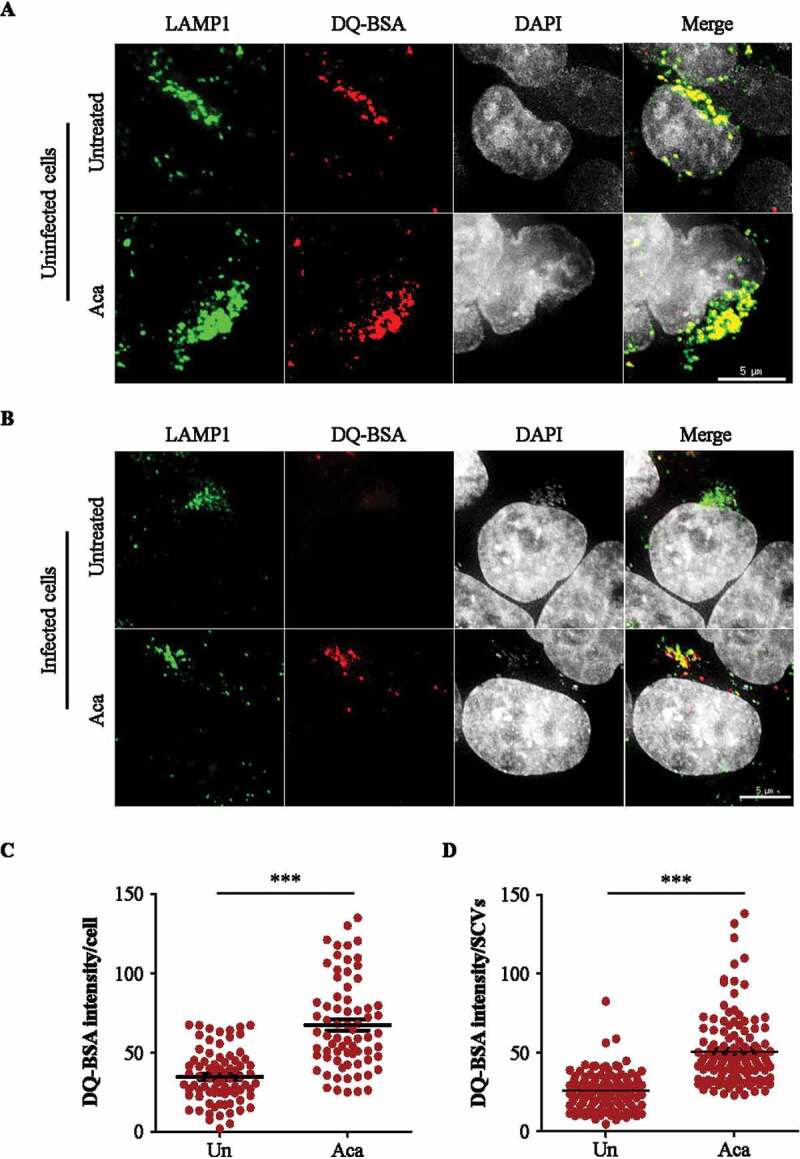
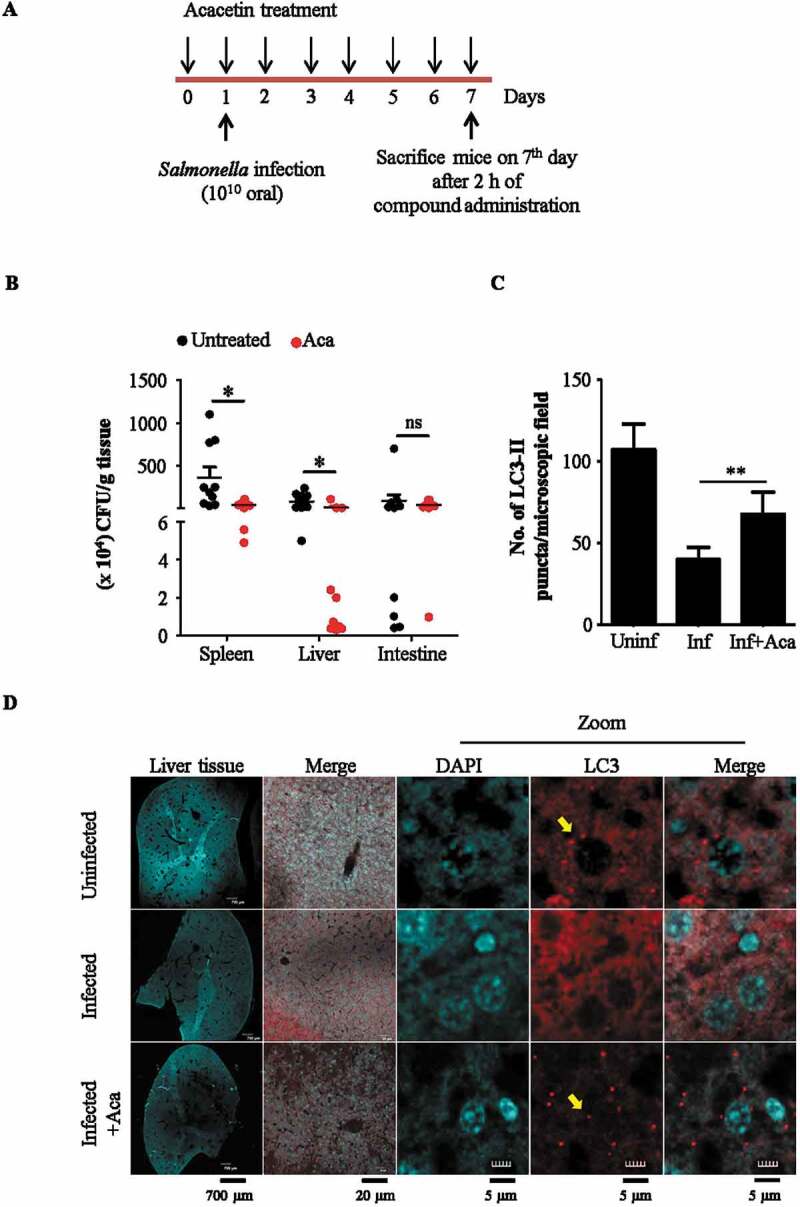
Macroautophagy/autophagy functions as a part of the innate immune system in clearing intracellular pathogens. Although this process is well known, the mechanisms that control antibacterial autophagy are not clear. In this study we show that during intracellular Salmonella typhimurium infection, the activity of TFEB (transcription factor EB), a master regulator of autophagy and lysosome biogenesis, is suppressed by maintaining it in a phosphorylated state on the lysosomes. Furthermore, we have identified a novel, antibacterial small molecule autophagy (xenophagy) modulator, acacetin. The xenophagy effect exerted by acacetin occurs in an MTOR (mechanistic target of rapamycin kinase)-independent, TFEB-dependent manner. Acacetin treatment results in persistently maintaining active TFEB in the nucleus and also in TFEB mediated induction of functional lysosomes that target Salmonella-containing vacuoles (SCVs). The enhanced proteolytic activity due to deployment of lysosomes results in clamping down Salmonella replication in SCVs. Acacetin is effective as a xenophagy compound in an in vivo mouse model of infection and reduces intracellular Salmonella burden.

Abbreviations: 3-MA: 3-methyladenine; BafA1: bafilomycin A1; CFU: colony-forming units; DQ-BSA: dye quenched-bovine serum albumin; EEA1: early endosome antigen 1; FITC: fluorescein isothiocyanate; FM 4-64: pyridinium,4-(6-[4-{diethylamino}phenyl]-1,3,5-hexatrienyl)-1-(3[triethylammonio] propyl)-dibromide; GFP: green fluorescent protein; LAMP1: lysosomal associated membrane protein 1; MAPILC3/LC3: microtubule associated protein 1 light chain 3; MOI: multiplicity of infection; MTOR: mechanistic target of rapamycin kinase; RFP: red fluorescent protein; SCVs: Salmonella-containing vacuoles; SD: standard deviation; SDS: sodium dodecyl sulfate; SEM: standard mean error; SQSTM1: sequestosome 1; TBK1: TANK binding kinase 1; TFEB: transcription factor EB.

Keywords: Salmonella typhimurium; Salmonella-containing vacuoles; Acacetin; MTOR-independent; TFEB; autolysosomes; lysosomes; xenophagy.


Conflict of interest statement

No potential conflict of interest was reported by the authors.

Figures

None
Graphical abstract
Figure 1.
Figure 1.
Acacetin induces autophagy and increases lysosomal population. (A) Representative microscopy images for tandem RFP-GFP-LC3 transfected HeLa cells treated with acacetin (50 µM) for 2 h. Yellow puncta correspond to autophagosomes whereas red puncta correspond to autolysosomes. Scale bar: 10 µm. (B) Fold change in autophagosomes and autolysosomes induced by acacetin were quantified (n = 25, three independent experiments N = 3). (C) Fold change in normalized LC3-II levels between growth condition and acacetin treatment were quantified (N = 3). (D) Representative immunoblot for LC3-I to LC3-II conversion in HeLa cells in the presence of the compound for 2 h. (E) Representative immunoblot for LC3-II accumulation in the presence of acacetin only and acacetin with BafA1 (100 nM). (F) Representative immunoblot for SQSTM1 degradation post acacetin treatment. (G) Representative immunofluorescence microscopy images of HeLa cells stained for LAMP1 and LC3 after 2 h of acacetin treatment (n = 25, N = 3). Scale bar: 10 µm. (H) Fold change in lysosomes and autolysosomes induced by acacetin were quantified (n = 25, N = 3). (I) Representative electron micrographs of acacetin treated HeLa cells. Electron dense structures in the zoomed-in panel represent lysosomes (red arrow). (J) Representative immunoblot indicating the phosphorylation status of MTOR substrates, RPS6KB1/p70S6K and EIF4EBP1 caused by acacetin and Earle’s Balanced Salt Solution (EBSS) treatments. TUBB/β-tubulin was used as a loading control. Quantification of microscopy images was performed on projected images. Statistical analyses were performed using unpaired two-tailed student’s t-test; ns- non-significant, *p < 0.05, **p < 0.01, ***p < 0.001. Error bars represent mean ± SEM.
Figure 2.
Figure 2.
Acacetin induces xenophagy of S. typhimurium. (A) Graph showing CFU indicating intracellular S. typhimurium in HeLa cells and RAW 264.7 after acacetin treatment (N = 3). (B) Graph showing CFU indicating intracellular S. typhimurium in HeLa cells and ATG5/ HeLa cells after acacetin treatment (N = 3). (C) Graph showing CFU indicating intracellular S. typhimurium in HeLa cells after various treatments like acacetin, wortmannin and 3-MA (N=3). (D) Growth curve of S. typhimurium in cell free Luria Broth containing acacetin. (E) Graph representing the percentage of time course recruitment of SQSTM1 to S. typhimurium induced by acacetin. (F) Graph representing the percentage of time course recruitment of LC3 to S. typhimurium induced by acacetin. (G) Representative microscopy images of HeLa cells infected with mCherry expressing S. typhimurium and immunostained for SQSTM1 at 6 h post infection (n = 25, N = 3). Scale bar: 5 µm. (H) Representative microscopy images of GFP-LC3 transfected HeLa cells and infected with mCherry expressing S. typhimurium at 6 h post infection. Scale bar: 10 µm. (I) Representative microscopy images of HeLa cells infected with mCherry expressing S. typhimurium and immunostained for p-TBK1 and p-SQSTM1 at 6 h post infection (n = 25, N = 3). Scale bar: 10 µm. (J) Graph representing the percentage recruitment of p-TBK1 and p-SQSTM1 to S. typhimurium induced by acacetin. Quantification of microscopy images was performed on individual Z slices. (K-M) Representative electron micrographs of S. typhimurium infected HeLa cells (showing (K) Vacuolar and (L) cytoplasmic Salmonella population) with and without acacetin. Red arrows indicate electron dense lysosomes and yellow arrows indicate host mediated capture of S. typhimurium. Statistical analyses on three independent experiments were performed using unpaired two-tailed student’s t-test; ns- non-significant, *p < 0.05, **p < 0.01, ***p < 0.001. Error bars represent mean ± SEM. The concentrations of 3-MA, wortmannin and acacetin used were 5 mM, 100 nM and 50 µM respectively.
Figure 3.
Figure 3.
Acacetin enhances nuclear translocation of TFEB. (A) Representative microscopy images of HeLa cells treated with acacetin for 2 h and immunostained for TFEB. Scale bar: 5 µm. (B) Fold change in nuclear TFEB intensity induced by acacetin were quantified (n = 50, N = 3). Quantification of microscopy images were performed on individual Z slices. (C) The graph represents the fold change in dephosphorylated form of TFEB caused by acacetin (N = 3). (D) Representative immunoblot for HeLa cells treated with acacetin and probed for TFEB. Molecular weight shift in TFEB band corresponds to dephosphorylated TFEB. TUBB/β-tubulin was used as a loading control. (E) Representative immunoblot of cytoplasmic-nuclear fractionation indicating TFEB levels in nucleus and cytoplasm. 2X concentration of nuclear fraction was loaded compared to cytoplasmic fraction. S.E and L.E represents short and long exposure respectively. (F) Fold change in mRNA levels of indicated TFEB target genes related to autophagy and lysosomal pathways post 2 h of acacetin treatment (N = 3). (G) Representative immunoblot indicating the phosphorylation status of TFEB post S. typhimurium infection across different time points and MOI. The lower molecular weight TFEB band corresponds to dephosphorylated TFEB. (H) Representative immunoblot indicating the phosphorylation status of TFEB post S. typhimurium infection and acacetin treatment in a time dependent manner. (I) Graph representing the difference in dephosphorylated TFEB induced by acacetin post S. typhimurium infection (N = 3). TUBB/β-tubulin was used as a loading control. Statistical analyses on three independent experiments were performed using unpaired student’s two-tailed t-test; ns- non-significant, *p < 0.05, **p < 0.01, ***p < 0.001. Error bars represent mean ± SEM.
Figure 4.
Figure 4.
Acacetin treatment results in enhanced capture of S. typhimurium in a TFEB-dependent manner. (A) Representative microscopy images of control and TFEB silenced HeLa cells post S. typhimurium infection for 6 h and immunostained for SQSTM1 and TFEB. Scale bar: 5 µm. (B) Graph represents the time course recruitment of SQSTM1 to S. typhimurium induced by acacetin treatment (n = 25, N = 3). Quantification of microscopy images were performed on individual Z slices. Statistical analysis was performed using unpaired student’s two-tailed t-test; ns- non-significant, *p < 0.05, **p < 0.01, ***p < 0.001. Error bars represent mean ± SEM.
Figure 5.
Figure 5.
Acacetin treatment increases the proteolytic activity of Salmonella-containing vacuoles. (A) Representative microscopy images of HeLa cells treated with DQ-BSA for 2 h followed by 4 h incubation of DQ-BSA along with acacetin treatment. Cells were immunostained for LAMP1 (n = 25, N = 3). Scale bar: 5 µm. (B) Representative microscopy images of mCherry S. typhimurium infected HeLa cells treated with DQ-BSA for 2 h followed by 4 h incubation of DQ-BSA along with acacetin treatment. Cells were immunostained for LAMP1. Scale bar: 5 µm. (C and D) The differences in DQ-BSA intensity per cell or SCVs induced by acacetin treatment were quantified (n = 25, N = 3). Quantification of microscopy images were performed on projected images. Statistical analyses on three independent experiments were performed using unpaired student’s two-tailed t-test; ns- non-significant, *p < 0.05, **p < 0.01, ***p < 0.001. Error bars represent mean ± SEM.
Figure 6.
Figure 6.
Acacetin induces xenophagy in mouse model of infection. (A) Scheme for infection assay. (B) Graph representing the reduction in intracellular S. typhimurium burden in various organs of acacetin treated mice (N = 10). (C) Graph representing the difference in number of LC3-II puncta per microscopy field (1X1 binning and 1024 × 1024 pixel) between different groups of mice (N=3). (D) Representative immunohistochemistry images of liver cryosections stained for autophagosome membrane marker, LC3 (Olympus FV3000 1.25X objective was used for imaging entire DAPI stained liver section, 20X objective was used to choose a region of interest stained for LC3 in red and DAPI. 40X objective was used for observing LC3 puncta, indicated by yellow arrows). Quantification of microscopy images were performed on projected images. Statistical analyses of three independent experiments was performed using unpaired student’s two-tailed t-test; ns- non-significant, *p < 0.05, **p < 0.01, ***p < 0.001. Error bars represent mean ± SEM.

References

    1. Armstrong JA, Hart PD.. Response of cultured macrophages to Mycobacterium tuberculosis, with observations on fusion of lysosomes with phagosomes. J Exp Med. 1971;134:713–740. - PMC - PubMed
    1. Rich KA, Burkett C, Webster P.. Cytoplasmic bacteria can be targets for autophagy. Cell Microbiol. 2003;5:455–468. - PubMed
    1. Gutierrez MG, Master SS, Singh SB, et al. Autophagy is a defense mechanism inhibiting BCG and Mycobacterium tuberculosis survival in infected macrophages. Cell. 2004;119:753–766. - PubMed
    1. Nakagawa I, Amano A, Mizushima N, et al. Autophagy defends cells against invading group A Streptococcus. Science. 2004;306:1037–1040. - PubMed
    1. Deretic V, Levine B. Autophagy, immunity, and microbial adaptations. Cell Host Microbe. 2018;8:527–549. - PMC - PubMed

Publication types

MeSH terms