Population densities predict forebrain size variation in the cleaner fish Labroides dimidiatus
- PMID: 31744435
- PMCID: PMC6892052
- DOI: 10.1098/rspb.2019.2108
Population densities predict forebrain size variation in the cleaner fish Labroides dimidiatus
Abstract
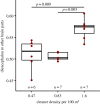
The 'social brain hypothesis' proposes a causal link between social complexity and either brain size or the size of key brain parts known to be involved in cognitive processing and decision-making. While previous work has focused on comparisons between species, how social complexity affects plasticity in brain morphology at the intraspecific level remains mostly unexplored. A suitable study model is the mutualist 'cleaner' fish Labroides dimidiatus, a species that removes ectoparasites from a variety of 'client' fishes in iterative social interactions. Here, we report a positive relationship between the local density of cleaners, as a proxy of both intra- and interspecific sociality, and the size of the cleaner's brain parts suggested to be associated with cognitive functions, such as the diencephalon and telencephalon (that together form the forebrain). In contrast, the size of the mesencephalon, rhombencephalon, and brain stem, assumed more basal in function, were independent of local fish densities. Selective enlargement of brain parts, that is mosaic brain adjustment, appears to be driven by population density in cleaner fish.
Keywords: brain size; cleaning mutualism; mosaic brain; social brain hypothesis; sociality; strategic sophistication.
Conflict of interest statement
All authors declare no competing interests.
Figures


Similar articles
-
Brain morphology predicts social intelligence in wild cleaner fish.Nat Commun. 2020 Dec 21;11(1):6423. doi: 10.1038/s41467-020-20130-2. Nat Commun. 2020. PMID: 33349638 Free PMC article.
-
Cleaner fish Labroides dimidiatus manipulate client reef fish by providing tactile stimulation.Proc Biol Sci. 2001 Jul 22;268(1475):1495-501. doi: 10.1098/rspb.2001.1495. Proc Biol Sci. 2001. PMID: 11454294 Free PMC article.
-
Neuro-molecular characterization of fish cleaning interactions.Sci Rep. 2022 May 19;12(1):8468. doi: 10.1038/s41598-022-12363-6. Sci Rep. 2022. PMID: 35589869 Free PMC article.
-
The behavioural ecology of marine cleaning mutualisms.Biol Rev Camb Philos Soc. 2021 Dec;96(6):2584-2601. doi: 10.1111/brv.12770. Epub 2021 Jun 24. Biol Rev Camb Philos Soc. 2021. PMID: 34165230 Review.
-
A marine cleaning mutualism provides new insights in biological market dynamics.Philos Trans R Soc Lond B Biol Sci. 2023 May 8;378(1876):20210501. doi: 10.1098/rstb.2021.0501. Epub 2023 Mar 20. Philos Trans R Soc Lond B Biol Sci. 2023. PMID: 36934753 Free PMC article. Review.
Cited by
-
Why big brains? A comparison of models for both primate and carnivore brain size evolution.PLoS One. 2021 Dec 21;16(12):e0261185. doi: 10.1371/journal.pone.0261185. eCollection 2021. PLoS One. 2021. PMID: 34932586 Free PMC article.
-
Modelling how cleaner fish approach an ephemeral reward task demonstrates a role for ecologically tuned chunking in the evolution of advanced cognition.PLoS Biol. 2022 Jan 5;20(1):e3001519. doi: 10.1371/journal.pbio.3001519. eCollection 2022 Jan. PLoS Biol. 2022. PMID: 34986149 Free PMC article.
-
Evolution of schooling drives changes in neuroanatomy and motion characteristics across predation contexts in guppies.Nat Commun. 2023 Sep 27;14(1):6027. doi: 10.1038/s41467-023-41635-6. Nat Commun. 2023. PMID: 37758730 Free PMC article.
-
Social isolation affects intra-specific interaction behaviour and reduces the size of the cerebellar brain region in juvenile Atlantic salmon Salmo salar.J Fish Biol. 2022 Sep;101(3):711-721. doi: 10.1111/jfb.15142. Epub 2022 Jul 13. J Fish Biol. 2022. PMID: 35751413 Free PMC article.
-
Brain morphology predicts social intelligence in wild cleaner fish.Nat Commun. 2020 Dec 21;11(1):6423. doi: 10.1038/s41467-020-20130-2. Nat Commun. 2020. PMID: 33349638 Free PMC article.
References
-
- Jerison H. 1973. Evolution of the brain and intelligence. New York, NY: Academic Press.
Publication types
MeSH terms
Associated data
LinkOut - more resources
Full Text Sources

