. 2020 Jan 15;80(2):263-275.
doi: 10.1158/0008-5472.CAN-19-0342. Epub 2019 Nov 19.

An Engineered Tumor-on-a-Chip Device with Breast Cancer-Immune Cell Interactions for Assessing T-cell Recruitment

Affiliations

An Engineered Tumor-on-a-Chip Device with Breast Cancer-Immune Cell Interactions for Assessing T-cell Recruitment

Aereas Aung et al. Cancer Res. .

Abstract

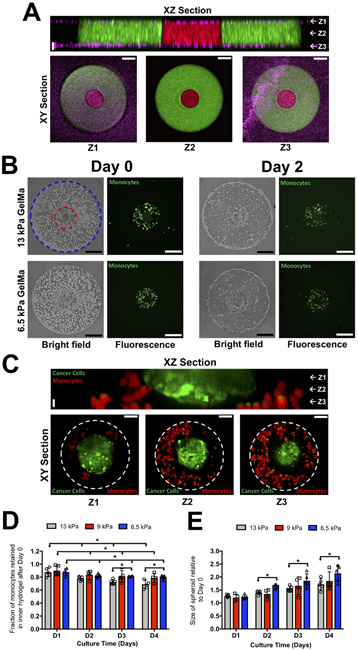
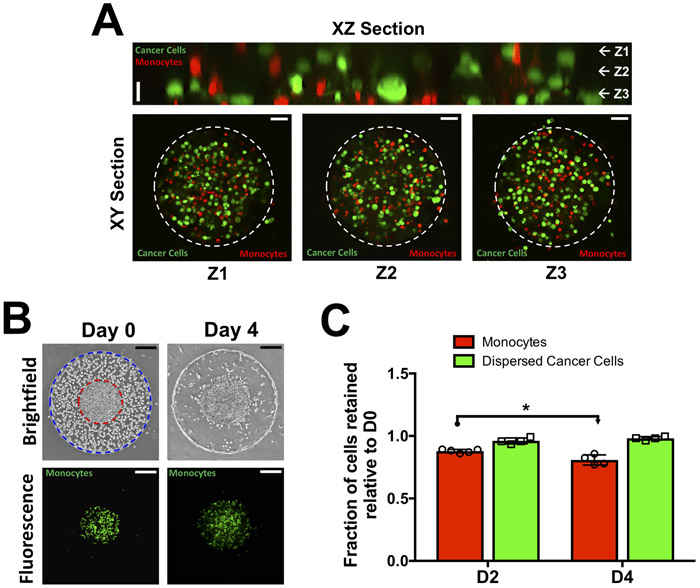
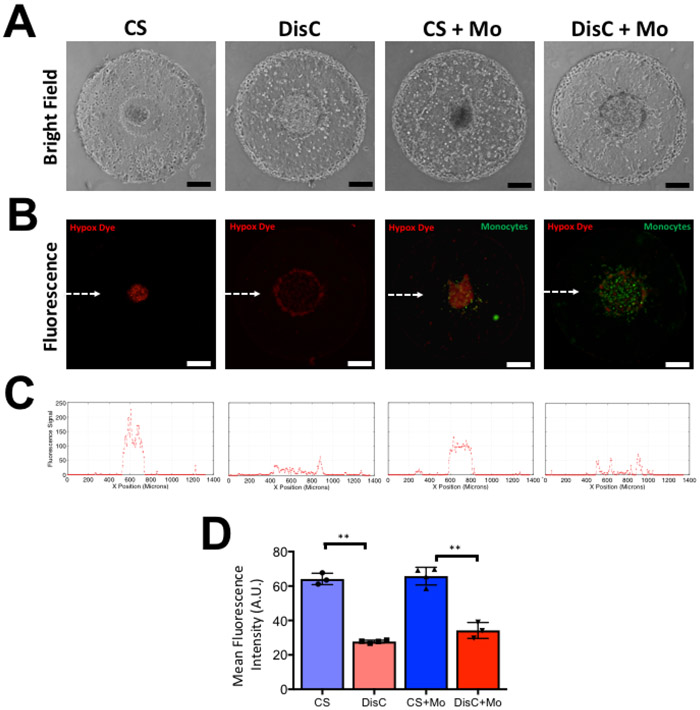
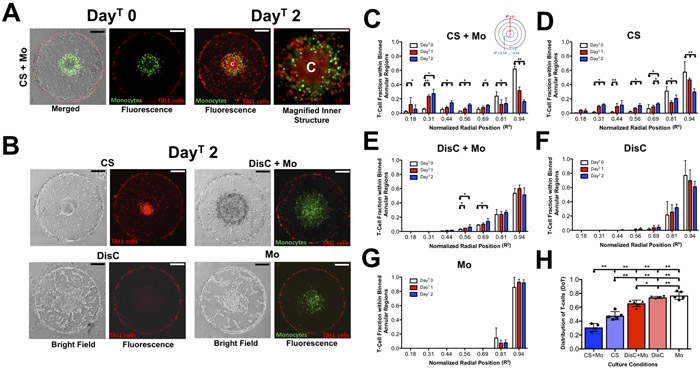
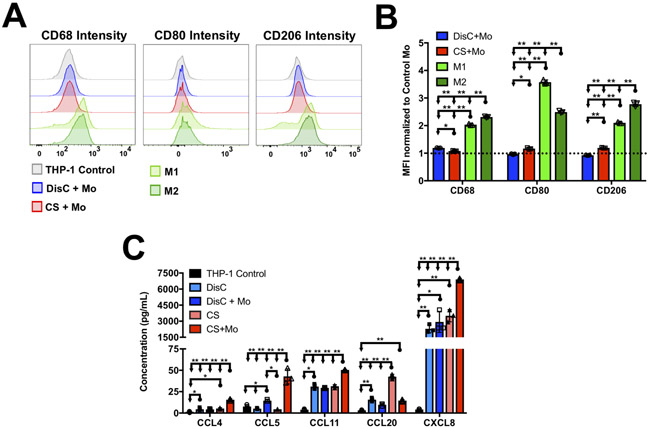
Recruitment of immune cells to a tumor is determined by the complex interplay between cellular and noncellular components of the tumor microenvironment. Ex vivo platforms that enable identification of key components that promote immune cell recruitment to the tumor could advance the field significantly. Herein, we describe the development of a perfusable multicellular tumor-on-a-chip platform involving different cell populations. Cancer cells, monocytes, and endothelial cells were spatially confined within a gelatin hydrogel in a controlled manner by using 3D photopatterning. The migration of the encapsulated endothelial cells against a chemokine gradient created an endothelial layer around the constructs. Using this platform, we examined the effect of cancer cell-monocyte interaction on T-cell recruitment, where T cells were dispersed within the perfused media and allowed to infiltrate. The hypoxic environment in the spheroid cultures recruited more T cells compared with dispersed cancer cells. Moreover, the addition of monocytes to the cancer cells improved T-cell recruitment. The differences in T-cell recruitment were associated with differences in chemokine secretion including chemokines influencing the permeability of the endothelial barrier. This proof-of-concept study shows how integration of microfabrication, microfluidics, and 3D cell culture systems could be used for the development of tumor-on-a-chip platforms involving heterotypic cells and their application in studying recruitment of cells by the tumor-associated microenvironment. SIGNIFICANCE: This study describes how tumor-on-chip platforms could be designed to create a heterogeneous mix of cells and noncellular components to study the effect of the tumor microenvironment on immune cell recruitment.


Conflict of interest statement

Conflicts: There are no conflicts of interests to declare.

Figures

Figure 1:
Figure 1:. Spatially confined co-culture of cancer spheroid, monocytes and endothelial cells.
(A) XZ confocal section of a bi-layer GelMA hydrogel comprised of two concentric cylinders sandwiched by PAm hydrogels at the top and bottom surfaces. The interior and exterior GelMA hydrogels are labeled with red and green fluorescent particles, respectively, while the PAm hydrogels are with magenta fluorescent particles. White arrows and labels Z1, Z2, and Z3 in the XZ section indicate the vertical positions of the XY sections. Vertical Scale bar: 20 μm. Horizontal Scale bar: 50 μm. (B) Brightfield and fluorescence images of monocytes (green), MCF7 cancer spheroid, and endothelial cells embedded in bi-layer GelMA hydrogels immediately after encapsulation (Day 0) and two days in culture (Day 2) with outer layers of varying rigidities, 6.5 and 13 kPa respectively. The boundary of the interior compartment and periphery of the bi-layer hydrogel are marked by red and blue lines, respectively. Scale bar: 200 μm. (C) XZ and XY confocal sections of the interior compartment of a bi-layer hydrogel containing a MCF7 cancer spheroid (green) and THP-1 monocytes (red) cultured for 4 days. The dashed white circle indicates the boundary of the inner gel compartment. Vertical Scale bar: 20 μm. Horizontal Scale bar: 50 μm. The fraction of monocytes retained (D) and change in the cancer spheroid size within the in the inner hydrogel layer (E) as a function of culture time with outer hydrogel layer of varying stiffnesses.
Figure 2:
Figure 2:. Co-culture involving dispersed cancer cells (MCF7), monocytes (THP-1), and endothelial cells.
(A) Confocal sections of dispersed cancer cells (green) and monocytes (red) in the interior of the bi-layer GelMA hydrogel at Day 0. XZ section along with XY section at vertical positions (Z1-Z3) show homogeneously distributed cancer cells and monocytes. The dashed white circle indicates the boundary of the inner gel compartment. Vertical scale bar: 20 μm. Horizontal scale bar: 50 μm. (B) Time course brightfield and fluorescent images of cell-laden bi-layer GelMA hydrogel. The interior hydrogel contains a mixture of cancer cells and monocytes (green) while the exterior contains endothelial cells. The boundaries of the interior and exterior hydrogels are lined with red and blue circles, respectively. Scale bar: 200 μm. (C) Quantification of normalized monocyte and cancer cell numbers within the GelMA hydrogel as a function of culture time.
Figure 3:
Figure 3:. Mass transfer analyses of hydrogels containing cancer cell aggregates of varying sizes.
(A) Schematic of the mass transfer model illustrating the domain geometry, boundary conditions, and position of the cancer cell aggregates. (B) Profile of diffusion coefficient within a cell aggregate (D;) along its diameter for hydrogels containing different number of cell clusters. For hydrogels with 1, 4, 9, and 16 clusters, the radius of each cluster is 140, 70, 47, and 35 μm, respectively. The x-axis and y-axis denote the locations along the aggregate diameter in microns and the corresponding value of the diffusion coefficient, respectively. Heat map of the diffusion coefficient (C) and normalized concentration of solute at steady state (D) within the GelMA hydrogel containing cancer cell aggregates at specified sizes. The x- and y- axis denotes the spatial positions in microns within the hydrogel. (E) The steady state normalized concentration at the center of the innermost aggregate as a function of ϕ and aggregate size. ϕ is defined as the ratio of diffusion to consumption rate of a solute.
Figure 4:
Figure 4:. Culture condition-dependent hypoxia in GelMA hydrogels containing cancer cells (MCF7) and monocytes (THP-1) after 2 days of culture.
(A) Brightfield images of GelMA hydrogels containing a cancer spheroid (CS), dispersed cancer cells (DisC), cancer spheroid with monocytes (CS + Mo), and dispersed cancer cells with monocytes (DisC + Mo). (B) Fluorescent image of hypoxia detection dye within encapsulated cells. Increased intensity of red fluorescence denotes more hypoxia experienced by the cells. Monocytes within the hydrogels are labeled with green fluorescent dye. (C) Line profile of red fluorescence intensity along the midline of the fluorescent images, which is indicated by the white dashed line in the fluorescent image containing CS. (D) Mean fluorescence intensity within different cultures. Scale bar: 200 μm.
Figure 5:
Figure 5:. TALL-104 cell infiltration into bi-layer GelMA hydrogels laden with cancer cells (MCF7), monocytes (THP-1), and endothelial cells.
(A, DayT0 Panel) Merged and fluorescence images of T-cells adhered onto the periphery of a bi-layer GelMA hydrogel containing a cancer spheroid, monocytes, and endothelial cells (CS + Mo) immediately after introducing T-cells. (A, DayT 2 Panel) Fluorescence image of the cell-laden construct two days post-infiltration (DayT 2 wherein “C” designates the center of the hydrogel. Monocytes and T-cells are fluorescently labeled by green and red dyes, respectively. Scale bar: 200 μm. (B) Brightfield and fluorescence image of the bi-layer hydrogels with cancer spheroids (CS), dispersed cancer cells and monocytes (DisC + Mo), dispersed cancer cells (DisC), and monocytes (Mo) within the interior of the hydrogel at DayT 2. (C-G) Fraction of TALL-104 cells residing within each annular region, shown in the inset, from DayT 0 to DayT 2 for hydrogels containing CS + Mo, CS, DisC + Mo, DisC, and Mo. The normalized radial position denotes the radial midpoint location in each annulus. The sample sizes for CS+Mo, CS, DisC+Mo, DisC, and Mo are 4, 5, 5, 4, and 5, respectively. (H) Quantification of the Distribution of T-cells (DoT) within the bi-layer hydrogels for different cultures. Lower and higher DoT values indicate the distribution of T-cells towards the center and periphery, respectively.
Figure 6:
Figure 6:. Culture condition dependent chemokine secretion and changes in THP-1 phenotypes.
(A) FACS analysis of THP-1 monocytes from different cultures showing representatives intensity histograms for CD68, CD80, and CD206. M1 and M2 within the legends indicate THP-1 cells differentiated into either M1 or M2 macrophages. (B) Mean fluorescence intensity (MFI) of CD68, CD80, and CD206 normalized to MFI of these markers of THP-1 monoculture. (C) Chemokines of different cultures containing MCF7 cells and THP-1 monocytes.

References

    1. Maude SL, Frey N, Shaw PA, Aplenc R, Barrett DM, Bunin NJ, et al. Chimeric Antigen Receptor T Cells for Sustained Remissions in Leukemia. New Engl J Med 2014;371:1507–17 - PMC - PubMed
    1. Lee DW, Barrett DM, Mackall C, Orentas R, Grupp SA. The Future Is Now: Chimeric Antigen Receptors as New Targeted Therapies for Childhood Cancer. Clin Cancer Res 2012;18:2780–90 - PMC - PubMed
    1. Kochenderfer JN, Rosenberg SA. Treating B-cell cancer with T cells expressing anti-CD19 chimeric antigen receptors. Nat Rev Clin Oncol 2013;10:267–76 - PMC - PubMed
    1. Gettinger SN, Horn L, Gandhi L, Spigel DR, Antonia SJ, Rizvi NA, et al. Overall Survival and Long-Term Safety of Nivolumab (Anti-Programmed Death 1 Antibody, BMS-936558, ONO-4538) in Patients With Previously Treated Advanced Non-Small-Cell Lung Cancer. J Clin Oncol 2015;33:2004–U32 - PMC - PubMed
    1. Topalian SL, Hodi FS, Brahmer JR, Gettinger SN, Smith DC, McDermott DF, et al. Safety, Activity, and Immune Correlates of Anti-PD-1 Antibody in Cancer. New Engl J Med 2012;366:2443–54 - PMC - PubMed

Publication types

MeSH terms