Early-Life Predictors of Fetal Alcohol Spectrum Disorders
- PMID: 31744890
- PMCID: PMC6889972
- DOI: 10.1542/peds.2018-2141
Early-Life Predictors of Fetal Alcohol Spectrum Disorders
Abstract
Background and objectives: Fetal alcohol spectrum disorders (FASD) comprise the continuum of disabilities associated with prenatal alcohol exposure. Although infancy remains the most effective time for initiation of intervention services, current diagnostic schemes demonstrate the greatest confidence, accuracy, and reliability in school-aged children. Our aims for the current study were to identify growth, dysmorphology, and neurodevelopmental features in infants that were most predictive of FASD at age 5, thereby improving the timeliness of diagnoses.
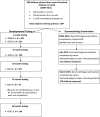
Methods: A cohort of pregnant South African women attending primary health care clinics or giving birth in provincial hospitals was enrolled in the project. Children were followed longitudinally from birth to 60 months to determine their physical and developmental trajectories (N = 155). Standardized protocols were used to assess growth, dysmorphology, and development at 6 weeks and at 9, 18, 42, and 60 months. A structured maternal interview, including estimation of prenatal alcohol intake, was administered at 42 or 60 months.
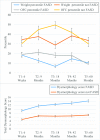
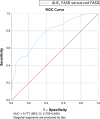
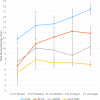
Results: Growth restriction and total dysmorphology scores differentiated among children with and without FASD as early as 9 months (area under the receiver operating characteristic curve = 0.777; P < .001; 95% confidence interval: 0.705-0.849), although children who were severely affected could be identified earlier. Assessment of developmental milestones revealed significant developmental differences emerging among children with and without FASD between 18 and 42 months. Mothers of children with FASD were significantly smaller, with lower BMIs and higher alcohol intake during pregnancy, than mothers of children without FASD.
Conclusions: Assessment of a combination of growth, dysmorphology, and neurobehavioral characteristics allows for accurate identification of most children with FASD as early as 9 to 18 months.
Copyright © 2019 by the American Academy of Pediatrics.
Conflict of interest statement
POTENTIAL CONFLICT OF INTEREST: The authors have indicated they have no potential conflicts of interest to disclose.
Figures


Comment in
-
Early Detection of Fetal Alcohol Spectrum Disorders: An Elusive but Critical Goal.Pediatrics. 2019 Dec;144(6):e20193080. doi: 10.1542/peds.2019-3080. Epub 2019 Nov 19. Pediatrics. 2019. PMID: 31744892 No abstract available.
References
-
- Sampson PD, Streissguth AP, Bookstein FL, et al. . Incidence of fetal alcohol syndrome and prevalence of alcohol-related neurodevelopmental disorder. Teratology. 1997;56(5):317–326 - PubMed
-
- May PA, Gossage JP, Kalberg WO, et al. . Prevalence and epidemiologic characteristics of FASD from various research methods with an emphasis on recent in-school studies. Dev Disabil Res Rev. 2009;15(3):176–192 - PubMed
Publication types
MeSH terms
Grants and funding
LinkOut - more resources
Full Text Sources
Medical

