

Genomic and transcriptomic profiling of carcinogenesis in patients with familial adenomatous polyposis
- PMID: 31744909
- PMCID: PMC7306982
- DOI: 10.1136/gutjnl-2019-319438
Genomic and transcriptomic profiling of carcinogenesis in patients with familial adenomatous polyposis
Abstract
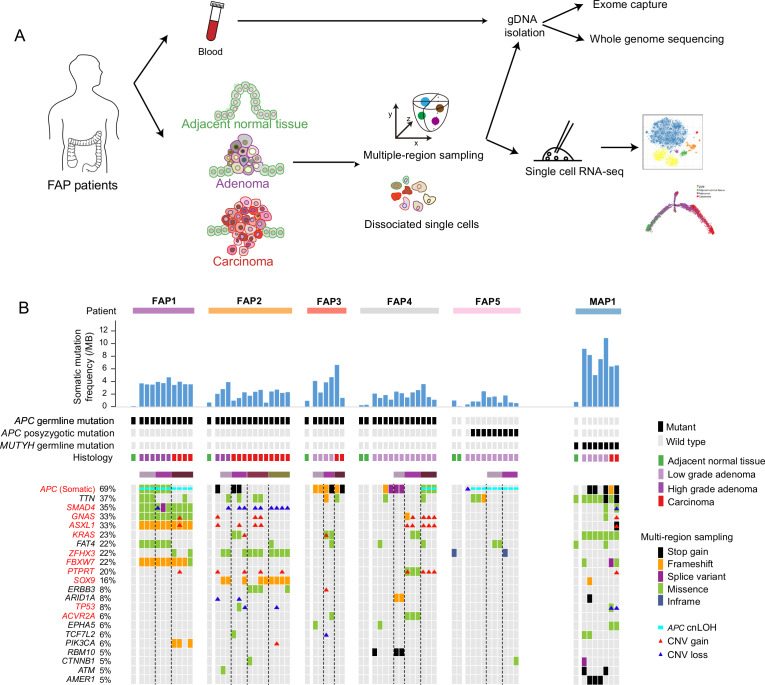
Objective: Familial adenomatous polyposis (FAP) is characterised by the development of hundreds to thousands of adenomas at different evolutionary stages in the colon and rectum that will inevitably progress to adenocarcinomas if left untreated. Here, we investigated the genetic alterations and transcriptomic transitions from precancerous adenoma to carcinoma.
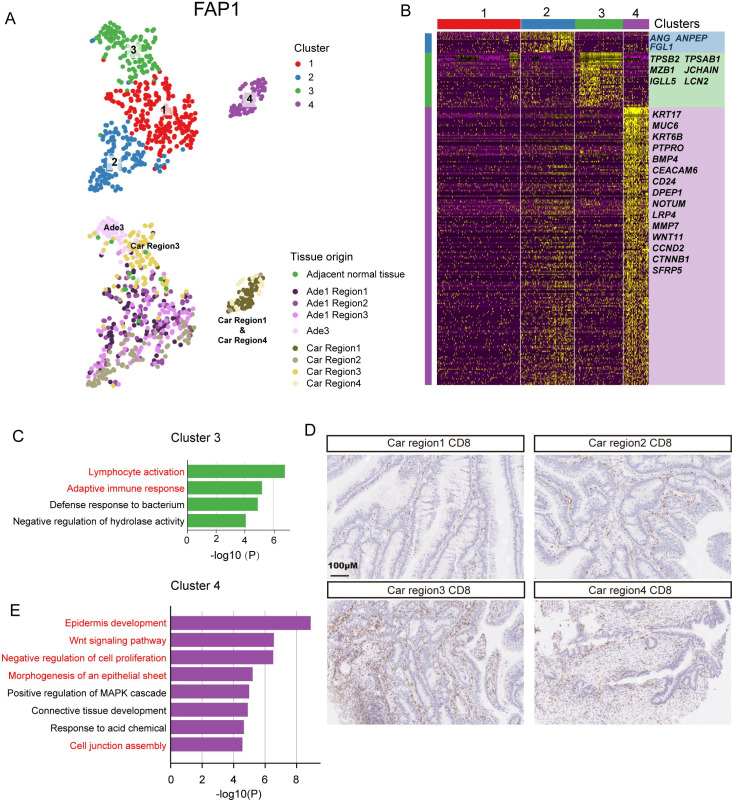
Design: Whole-exome sequencing, whole-genome sequencing and single-cell RNA sequencing were performed on matched adjacent normal tissues, multiregionally sampled adenomas at different stages and carcinomas from six patients with FAP and one patient with MUTYH-associated polyposis (n=56 exomes, n=56 genomes and n=8,757 single cells). Genomic alterations (including copy number alterations and somatic mutations), clonal architectures and transcriptome dynamics during adenocarcinoma carcinogenesis were comprehensively investigated.
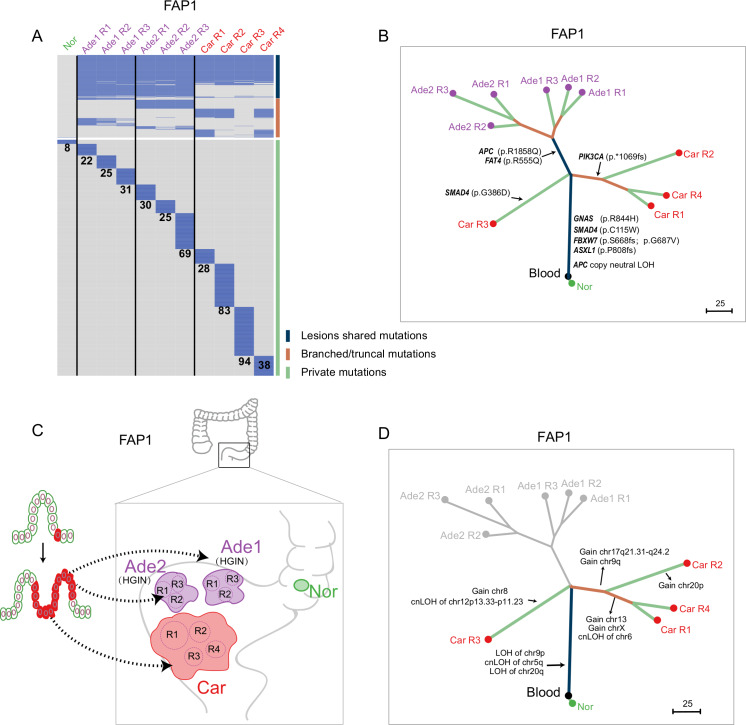
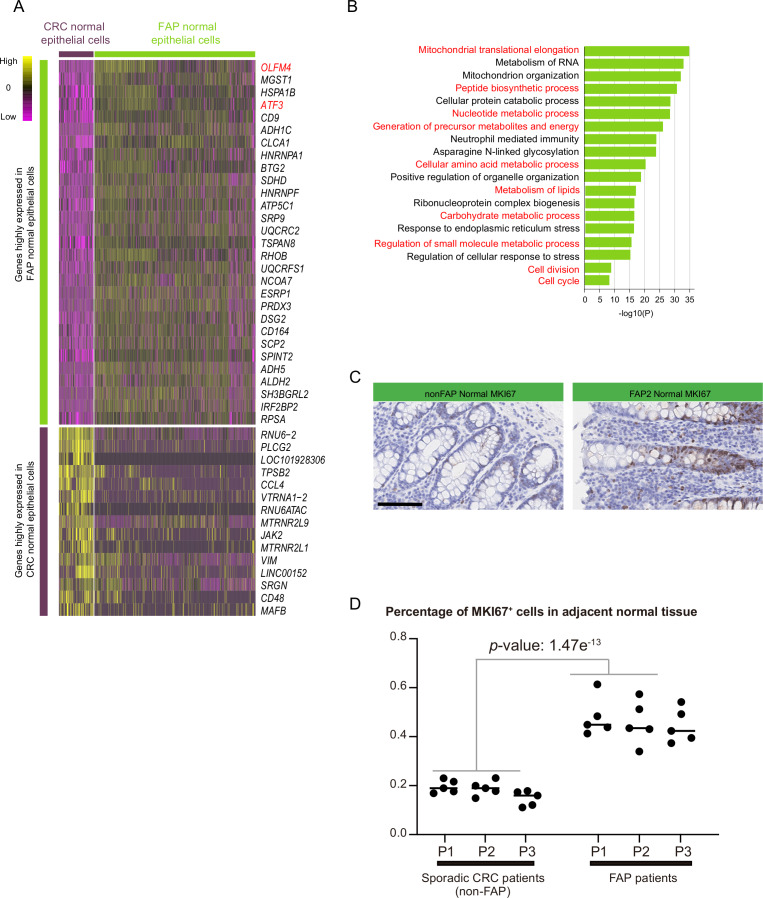
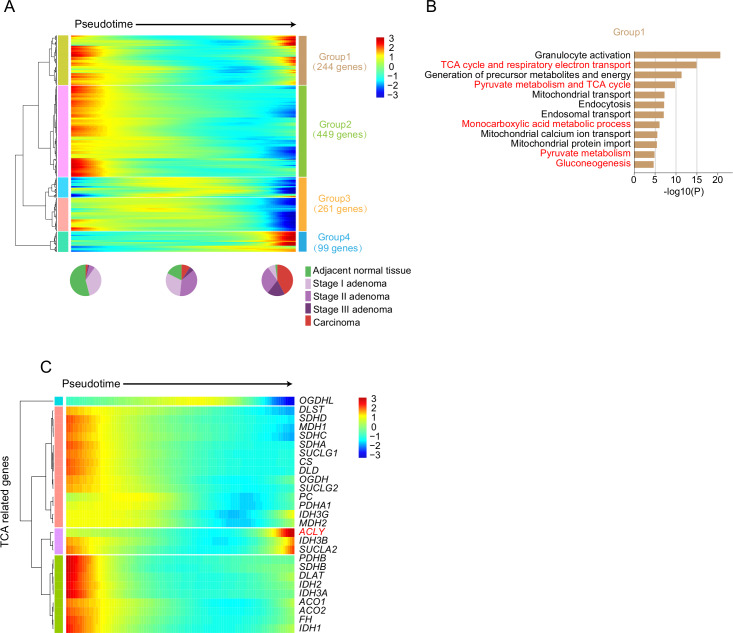
Results: Genomic evolutionary analysis showed that adjacent lesions from the same patient with FAP can originate from the same cancer-primed cell. In addition, the tricarboxylic acid cycle pathway was strongly repressed in adenomas and was then slightly alleviated in carcinomas. Cells from the 'normal' colon epithelium of patients with FAP already showed metabolic reprogramming compared with cells from the normal colon epithelium of patients with sporadic colorectal cancer.
Conclusions: The process described in the previously reported field cancerisation model also occurs in patients with FAP and can contribute to the formation of adjacent lesions in patients with FAP. Reprogramming of carbohydrate metabolism has already occurred at the precancerous adenoma stage. Our study provides an accurate picture of the genomic and transcriptomic landscapes during the initiation and progression of carcinogenesis, especially during the transition from adenoma to carcinoma.
Keywords: MUTYH-associated polyposis (MAP); Familial adenomatous polyposis (FAP); Field cancerization; Single-cell transcriptome profiling; Tumor heterogeneity; colon carcinogenesis; colorectal adenomas.
© Author(s) (or their employer(s)) 2020. Re-use permitted under CC BY-NC. No commercial re-use. See rights and permissions. Published by BMJ.
Conflict of interest statement
Competing interests: None declared.
Figures
Similar articles
-
Burden and Profile of Somatic Mutation in Duodenal Adenomas from Patients with Familial Adenomatous- and MUTYH-associated Polyposis.Clin Cancer Res. 2017 Nov 1;23(21):6721-6732. doi: 10.1158/1078-0432.CCR-17-1269. Epub 2017 Aug 8. Clin Cancer Res. 2017. PMID: 28790112
-
Evolutionary history of adenomas to colorectal cancer in FAP families.Front Genet. 2024 Jul 3;15:1391851. doi: 10.3389/fgene.2024.1391851. eCollection 2024. Front Genet. 2024. PMID: 39021676 Free PMC article.
-
Adenoma development in familial adenomatous polyposis and MUTYH-associated polyposis: somatic landscape and driver genes.J Pathol. 2016 Jan;238(1):98-108. doi: 10.1002/path.4643. Epub 2015 Nov 2. J Pathol. 2016. PMID: 26414517 Free PMC article.
-
Familial adenomatous polyposis.Orphanet J Rare Dis. 2009 Oct 12;4:22. doi: 10.1186/1750-1172-4-22. Orphanet J Rare Dis. 2009. PMID: 19822006 Free PMC article. Review.
-
Molecular Pathways of Carcinogenesis in Familial Adenomatous Polyposis.Int J Mol Sci. 2023 Mar 16;24(6):5687. doi: 10.3390/ijms24065687. Int J Mol Sci. 2023. PMID: 36982759 Free PMC article. Review.
Cited by
-
Colorectal Cancer Cell Differentiation Trajectory Predicts Patient Immunotherapy Response and Prognosis.Cancer Control. 2022 Jan-Dec;29:10732748221121382. doi: 10.1177/10732748221121382. Cancer Control. 2022. PMID: 36036380 Free PMC article.
-
Research progress of colorectal cancer in genomic and transcriptomic at multi-level.Front Genet. 2025 May 30;16:1533817. doi: 10.3389/fgene.2025.1533817. eCollection 2025. Front Genet. 2025. PMID: 40520235 Free PMC article. Review.
-
Using genotype to assist clinical surveillance: a retrospective study of Chinese familial adenomatous polyposis patients.Am J Cancer Res. 2022 Sep 15;12(9):4254-4266. eCollection 2022. Am J Cancer Res. 2022. PMID: 36225625 Free PMC article.
-
Predicting Duodenal Cancer Risk in Patients with Familial Adenomatous Polyposis Using Machine Learning Model.Turk J Gastroenterol. 2023 Oct;34(10):1025-1034. doi: 10.5152/tjg.2023.22346. Turk J Gastroenterol. 2023. PMID: 37565794 Free PMC article.
-
Post-translational modifications and the reprogramming of tumor metabolism.Discov Oncol. 2025 May 26;16(1):929. doi: 10.1007/s12672-025-02674-1. Discov Oncol. 2025. PMID: 40418495 Free PMC article. Review.
References
-
- Rengifo-Cam W, Jasperson KW, Burt RW. Familial adenomatous polyposis : Intestinal polyposis syndromes: diagnosis and management. 101 Springer, 2016: 173–95.
-
- Church J. Molecular genetics of colorectal cancer. Seminars in Colon and Rectal Surgery 2016;27:172–5. 10.1053/j.scrs.2016.04.013 - DOI
Publication types
MeSH terms
LinkOut - more resources
Full Text Sources
Molecular Biology Databases
Research Materials
Miscellaneous