. 2020 Feb;182(2):707-720.
doi: 10.1104/pp.19.00617. Epub 2019 Nov 19.

GRANAR, a Computational Tool to Better Understand the Functional Importance of Monocotyledon Root Anatomy

Affiliations

GRANAR, a Computational Tool to Better Understand the Functional Importance of Monocotyledon Root Anatomy

Adrien Heymans et al. Plant Physiol. 2020 Feb.

Abstract

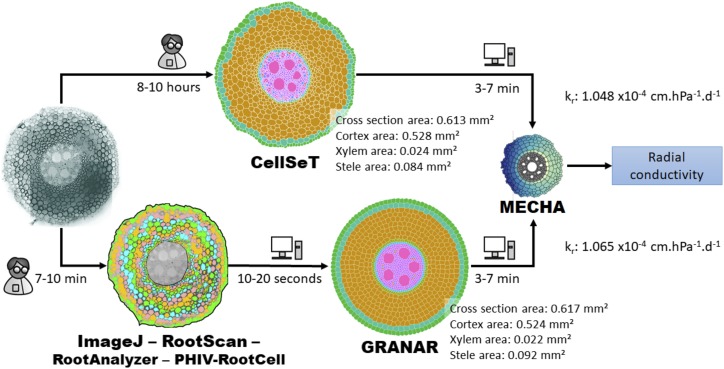
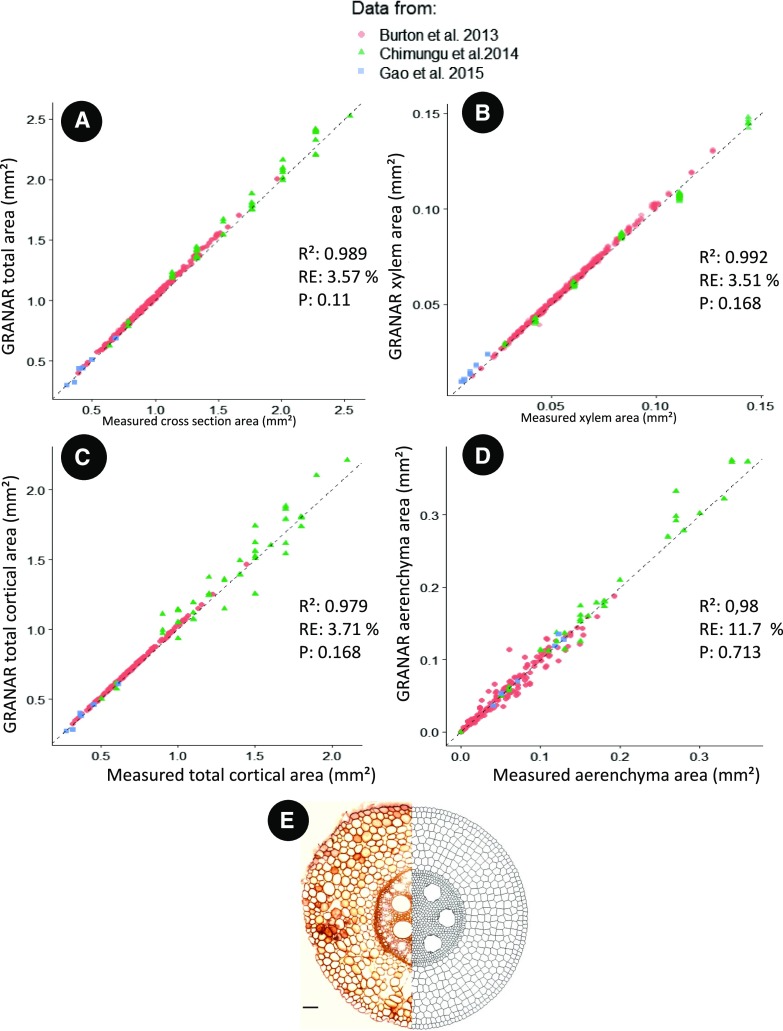
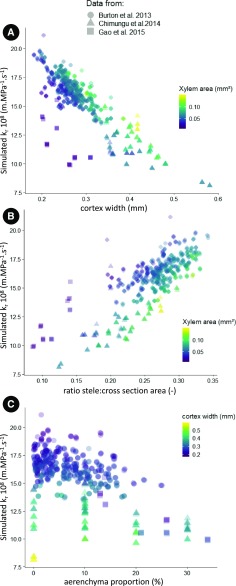
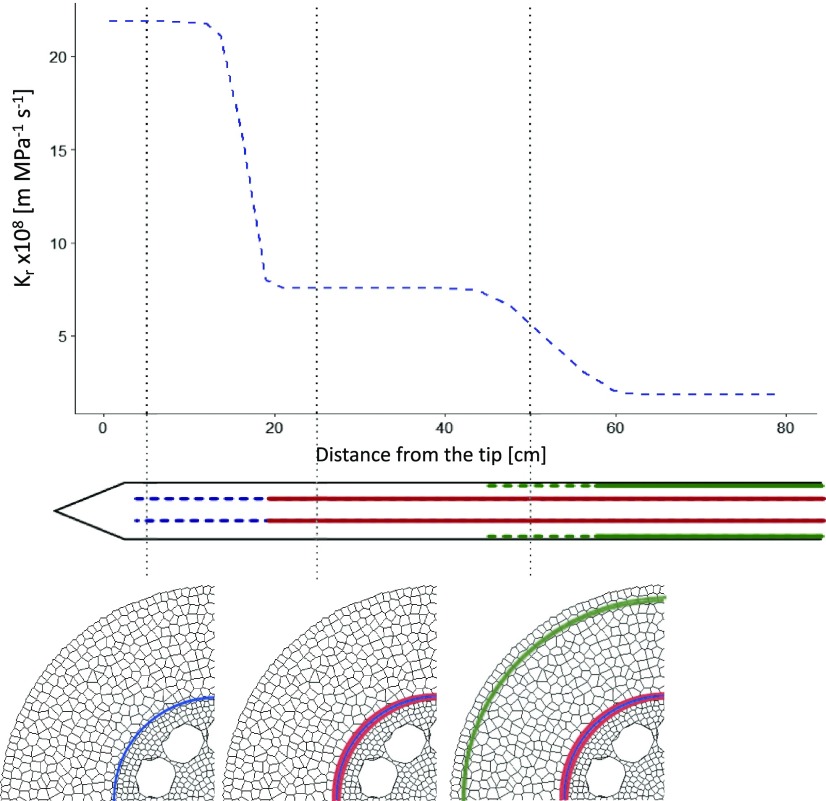
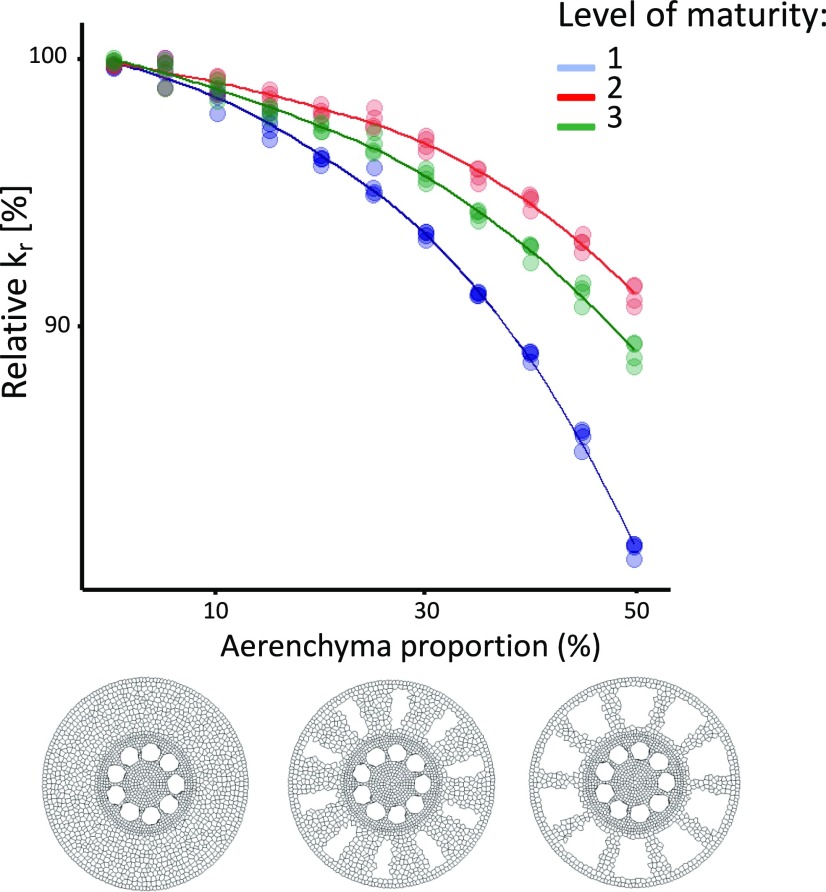
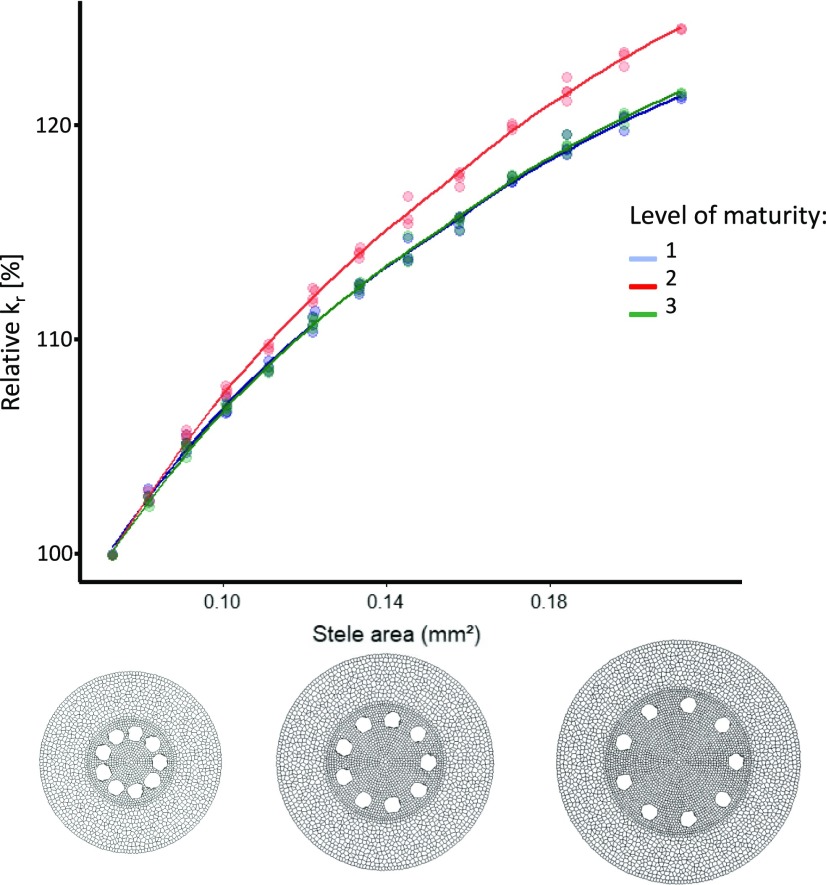
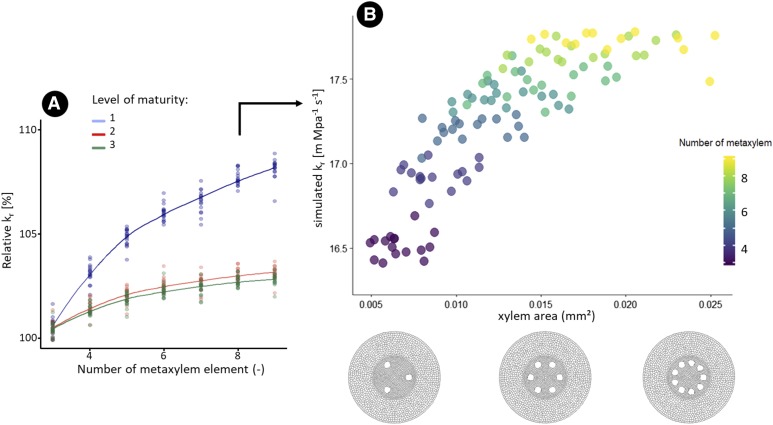
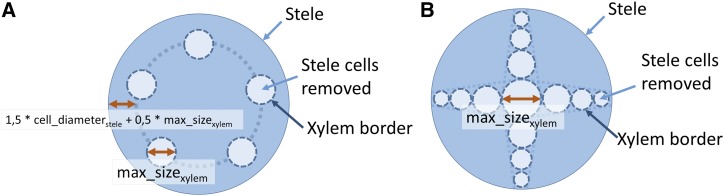
Root hydraulic conductivity is a limiting factor along the water pathways between the soil and the leaf, and root radial conductivity is itself defined by cell-scale hydraulic properties and anatomical features. However, quantifying the influence of anatomical features on the radial conductivity remains challenging due to complex time-consuming experimental procedures. We present an open-source computational tool, the Generator of Root Anatomy in R (GRANAR; http://granar.github.io), that can be used to rapidly generate digital versions of contrasted monocotyledon root anatomical networks. GRANAR uses a limited set of root anatomical parameters, easily acquired with existing image analysis tools. The generated anatomical network can then be used in combination with hydraulic models to estimate the corresponding hydraulic properties. We used GRANAR to reanalyze large maize (Zea mays) anatomical datasets from the literature. Our model was successful at creating virtual anatomies for each experimental observation. We also used GRANAR to generate anatomies not observed experimentally over wider ranges of anatomical parameters. The generated anatomies were then used to estimate the corresponding radial conductivities with the hydraulic model MECHA (model of explicit cross-section hydraulic architecture). Our simulations highlight the large importance of the width of the stele and the cortex. GRANAR is a computational tool that generates root anatomical networks from experimental data. It enables the quantification of the effect of individual anatomical features on the root radial conductivity.


Figures

Figure 1.
Figure 1.
Visual comparison between root cross section images of different plants and their simulation with GRANAR. A, Rice adventitious root grown hydroponically and collected 10 cm above the root tip. B, Wheat (Triticum aestivum) ‘Savannah’ mature adventitious root grown in soil and collected 5 cm from stem. C, Arabidopsis primary root grown on an agar plate collected 5 cm from the root tip. Initial image cross section comes from figure 4 in Atkinson and Wells (2017). D, Maize (B73 line) crown root grown aeroponically and collected 5 cm from the root tip. Initial image cross section comes from Hachez et al. (2006). E, Mature Ranunculus root (Reynolds, 2014). The model parameters used for the simulations were gathered with ImageJ and are available at https://github.com/granar/granar_examples. The area information below each image corresponds to the total area of the cross sections.
Figure 2.
Figure 2.
Comparison of GRANAR- and CellSeT-based methods used to estimate single-root scale hydraulic properties. The input parameters of GRANAR in the figure were gathered with ImageJ. The radial hydraulic conductivity (kr) values were calculated using the MECHA model assuming an endodermal Casparian strip as the only apoplastic barrier and uniform cell-scale hydraulic properties. The time (indicated as either person or computational using associated graphics) required for each procedure is detailed next to each arrow.
Figure 3.
Figure 3.
Comparison between simulated and experimental anatomies for four anatomical features. A, Total cross section area. B, Cortical area. C, Xylem area. D, Aerenchyma area. The different colors and shapes represent the different datasets. RE, relative error; R2, R-squared; P, P-value for the F test. E, Illustration depicting one initial image (Chimungu et al. 2014b) and the generated anatomy side by side. Bar = 100 µm.
Figure 4.
Figure 4.
Relationship between simulated kr and anatomical features for each dataset. Scenario with endodermal Casparian strip. Symbol shape corresponds to dataset. A, Effect of the cortex width on the simulated kr. Colors represent the xylem area. B, Effect of the ratio between the stele area and the total cross section area. Colors represent the xylem area. C, Effect of aerenchyma presence on the simulated kr. Colors represent the cortex width.
Figure 5.
Figure 5.
Comparison between simulated and measured kr values in maize.
Figure 6.
Figure 6.
Estimated evolution of the kr in main axes of the maize root system derived from Doussan et al. (1998). Top, kr as a function of distance from the maize root tip. Bottom, the illustrations depict our assumption of the evolution of main apoplastic barriers based on Enstone and Peterson (2005). The different lines represent different level of apoplastic barriers. 1: Endodermal Casparian strip (dashed blue); 2: Endodermal suberization (red); 3: Endodermis full suberization and exodermal Casparian strip (dashed green).
Figure 7.
Figure 7.
Influence of the proportion of aerenchyma on the relative kr for simulated monocot anatomies. The colors represent different levels of hydrophobic barrier development. 1: Endodermal Casparian strip (blue); 2: Endodermal suberization (red); 3: Endodermis full suberization and exodermal Casparian strip (green). The cross sections at the bottom of the figure, from left to right, show examples of roots with 0%, 25%, and 50% of aerenchyma.
Figure 8.
Figure 8.
Influence of cortex anatomy (number of cortex layers and cell size) on kr for simulated monocot anatomies. A, Overview of kr values across the parametric space where endodermal Casparian strip is the only apoplastic barrier. The colored dashed lines represent the cortex width isoline (mm), and the dotted lines are a visual representation of the fixed parameters for the two subplots (C and D). B, Evolution of the relative kr as the cortex width increases. C, Evolution of the relative kr as the cortex cell diameter increases for the number of cortex layers fixed to six. D, Evolution of the relative kr as the number of cortex layers increases for a cortex cell diameter set to 0.03 mm. B to d, The colors represent different levels of hydrophobic barrier development. 1: Endodermal Casparian strip (blue); 2: Endodermal suberization (red); 3: Endodermis full suberization and exodermal Casparian strip (green).
Figure 9.
Figure 9.
Influence of stele area on the relative kr for simulated monocot anatomies. The colors represent different levels of hydrophobic barrier development. 1: Endodermal Casparian strip (blue); 2: Endodermal suberization (red); 3: Endodermis suberization and exodermal Casparian strip (green). The cross sections at the bottom of the figure, from left to right, show examples of roots with 0.3, 0.4, and 0.5 mm stele diameter.
Figure 10.
Figure 10.
Influence of xylem features on the kr for simulated monocot anatomies. A, Influence of the number of xylem poles on the simulated relative kr. The colors represent different levels of hydrophobic barrier development. 1: Endodermal Casparian strip (blue); 2: Endodermal suberization (red); 3: Endodermis full suberization and exodermal Casparian strip (green). B, Influence of the xylem area on the simulated kr. The simulated kr was calculated using an endodermal Casparian strip as the only apoplastic barrier.
Figure 11.
Figure 11.
Overview of the methodology to create the vascular elements. A, Monocotyledon stele cross section. B, Dicotyledon stele cross section. In both (A) and (B), the stele cells inside the xylem border (dark blue) are removed to create xylem cells, indicated by light blue arrows. The different parameters used to build the root cross section simulation are described in light blue shaded boxes and indicated by double-headed red arrows.

References

    1. Atkinson JA, Wells DM (2017) An updated protocol for high throughput plant tissue sectioning. Front Plant Sci 8: 1721. - PMC - PubMed
    1. Barczi J-F, Rey H, Griffon S, Jourdan C (2018) DigR: A generic model and its open source simulation software to mimic three-dimensional root-system architecture diversity. Ann Bot 121: 1089–1104 - PMC - PubMed
    1. Bomfim NN, Graciano-Ribeiro D, Nassar NMA (2011) Genetic diversity of root anatomy in wild and cultivated Manihot species. Genet Mol Res 10: 544–551 - PubMed
    1. Bret-Harte MS, Silk WK (1994) Nonvascular, symplasmic diffusion of sucrose cannot satisfy the carbon demands of growth in the primary root tip of Zea mays L. Plant Physiol 105: 19–33 - PMC - PubMed
    1. Burton AL, Brown KM, Lynch JP (2013a) Phenotypic diversity of root anatomical and architectural traits in Zea species. Crop Sci 53: 1042–1055

Publication types

LinkOut - more resources