. 2019 Nov 19;10(1):5228.
doi: 10.1038/s41467-019-13035-2.

Transposable element expression in tumors is associated with immune infiltration and increased antigenicity

Affiliations

Transposable element expression in tumors is associated with immune infiltration and increased antigenicity

Yu Kong et al. Nat Commun. .

Abstract

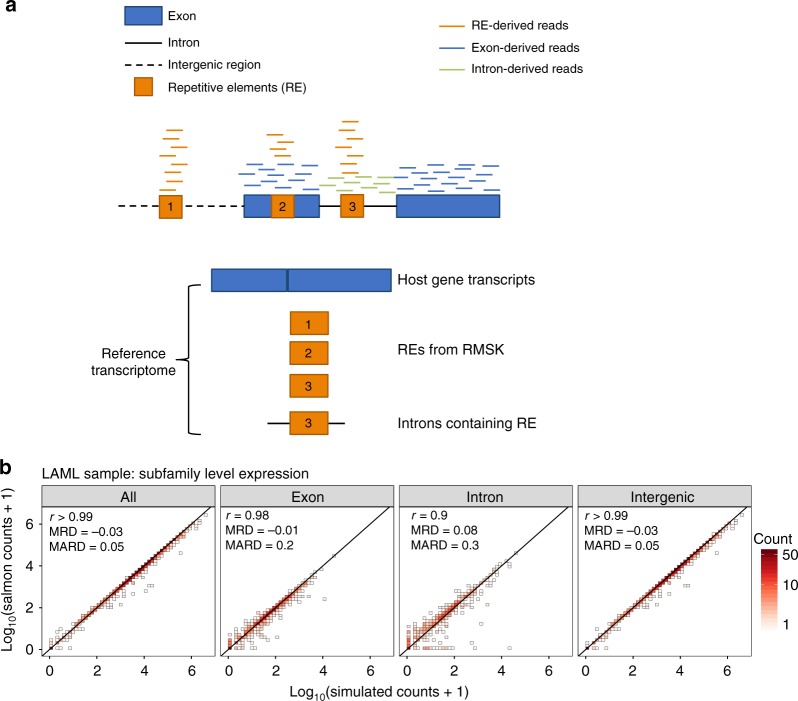
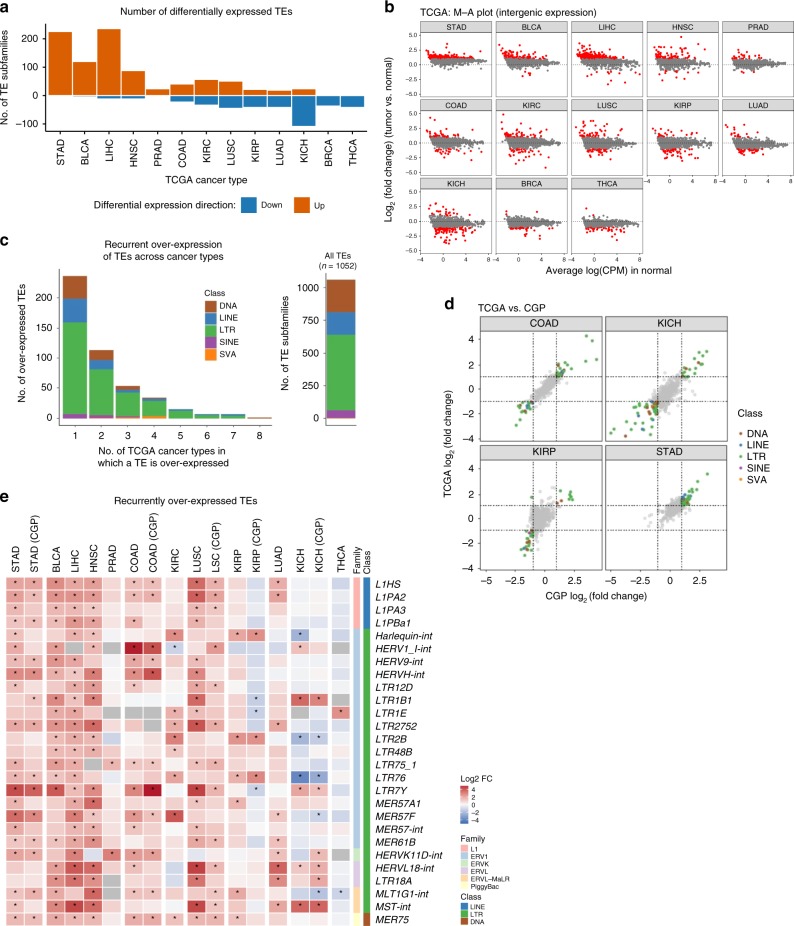
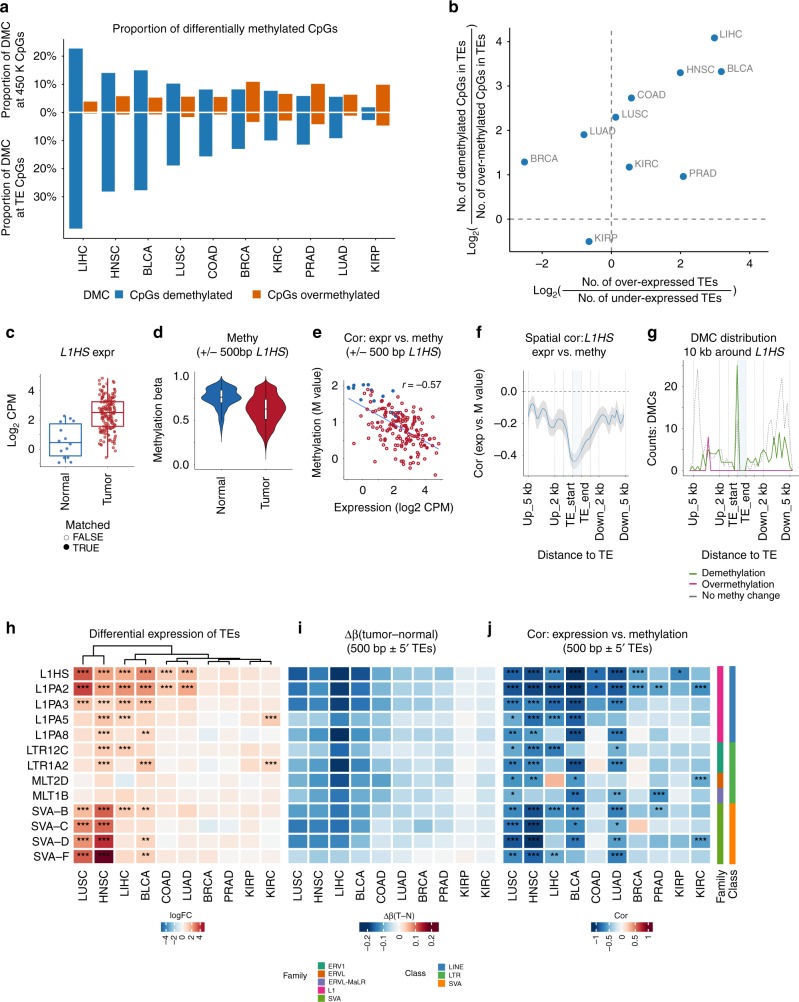
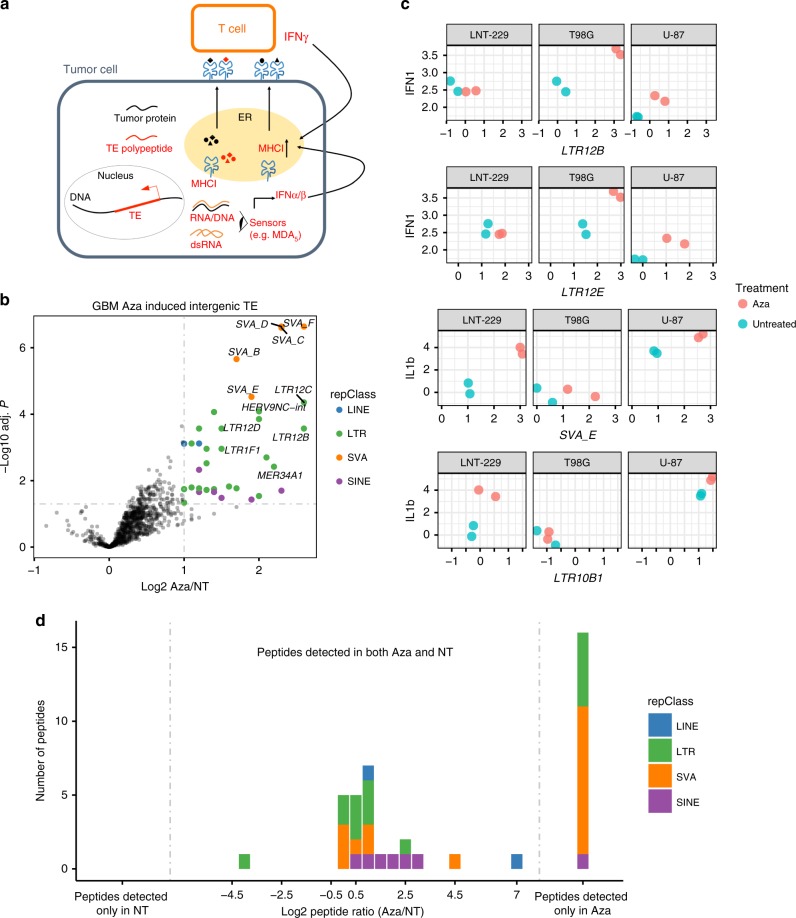
Profound global loss of DNA methylation is a hallmark of many cancers. One potential consequence of this is the reactivation of transposable elements (TEs) which could stimulate the immune system via cell-intrinsic antiviral responses. Here, we develop REdiscoverTE, a computational method for quantifying genome-wide TE expression in RNA sequencing data. Using The Cancer Genome Atlas database, we observe increased expression of over 400 TE subfamilies, of which 262 appear to result from a proximal loss of DNA methylation. The most recurrent TEs are among the evolutionarily youngest in the genome, predominantly expressed from intergenic loci, and associated with antiviral or DNA damage responses. Treatment of glioblastoma cells with a demethylation agent results in both increased TE expression and de novo presentation of TE-derived peptides on MHC class I molecules. Therapeutic reactivation of tumor-specific TEs may synergize with immunotherapy by inducing inflammation and the display of potentially immunogenic neoantigens.


Conflict of interest statement

C.M.R., M.D., A.-J.T., C.B., I.M., R.B., S.J. are employees of Genentech. A.G.W., S.L., M.L.A., P.M.H., H.C.-H. were employees of Genentech. H.C.-H. is the founder of Argonaut Genomics, Inc. The remaining authors declare no competing interests.

Figures

Fig. 1
Fig. 1
REdiscoverTE reference transcriptome and performance benchmarking. a REdiscoverTE whole-transcriptome reference for RE quantification. Schematic depicts short reads mapping to host gene features (exons, introns) and REs either embedded within host genes or intergenic regions. RE genomic locations are derived from RepeatMasker (RMSK). Reads stemming from repetitive elements (REs), exons, and introns are illustrated in orange, blue and green, respectively. b Benchmarking the accuracy of RE quantification by REdiscoverTE with simulation. Two-dimensional histogram comparing REdiscoverTE quantification to simulated RE expression generated based on a TCGA LAML sample. Expression is aggregated to the subfamily level. Left to right: all RE expression regardless of genomic context, exonic RE expression, intronic RE expression, intergenic RE expression. Performance accuracy is measured in terms of Spearman correlation coefficient (r), mean relative difference (MRD), mean absolute relative difference (MARD)
Fig. 2
Fig. 2
TE expression is dysregulated in cancer. a Number of differentially expressed TE subfamilies in 13 TCGA cancer types. Red bars: number of significantly overexpressed TE subfamilies. Blue bars: number of significantly underexpressed TE subfamilies. Cancer types are ordered from left to right by the ratio between number of overexpressed and underexpressed TE subfamilies. Differential expression analyses are based on intergenic TE expression and performed on matched tumor-normal sample pairs. Significance is defined at log2 fold change (FC) > 1 and FDR < 0.05. b M-A plot showing TE expression FC of tumor over normal as a function of mean normal tissue TE expression (log2 counts per million; CPM) for 13 TCGA cancer types. Each point is one TE subfamily. Red: significantly differentially expressed TE subfamilies. Cancer types are ordered as in Fig. 2a. c Left: histogram of TE subfamilies by number of TCGA cancer types in which they are overexpressed to show recurrence of overexpression. In total, 27 TE subfamilies were overexpressed in at least five cancer types. Right: number of TE subfamilies in each of five TE classes as defined by Repeatmasker GRCh38. d Comparison of TE differential expression profile (tumor vs. matched normal) between TCGA and CGP RNA-seq data on matching cancer types. e FC of expression for the 27 TE subfamilies are selected based on Fig. 2c. Heatmap colors indicate log2 FC (tumor vs. matched normal) values; columns are ordered as in Fig. 2a. CGP data are grouped with corresponding TCGA cancer types. *significant differential expression defined in a
Fig. 3
Fig. 3
TE expression in cancer is associated with epigenetic dysregulation. a Global differential methylation states across TCGA cancer types. Criteria for significant DMCs: absolute (Δbeta) ≥ 10%, FDR < 0.05. Top: proportion of DMCs among all Illumina 450 K CpG sites. Bottom: proportion of DMCs at CpGs within TEs. Blue: proportion of demethylated DMCs among all CpG sites. Orange: proportion of over-methylated DMCs. b TE mRNA overexpression correlation with the extent of CpG demethylation within TEs. Each point represents one cancer type. Horizontal axis: log2 ratio between the number of overexpressed TE subfamilies and the number of underexpressed TE subfamilies. Vertical axis: log2 ratio between the number of demethylated DMCs in TEs and the number of over-methylated DMCs in TEs. cg Association between L1HS intergenic expression and its DNA methylation state in BLCA (all samples). c L1HS intergenic expression in normal and tumor samples. Blue: normal sample. Red: tumor samples. Filled circle: tumor samples with matched normal. Open circle: tumor samples without matched normal). d L1HS proximal CpG M value in normal and tumor samples. Blue: normal samples. Red: tumor samples. CpG sites are from 500 bp ± regions around intergenic L1HS 5′ bp. e Pearson correlation between intergenic L1HS expression and methylation M value. f Spatial correlation between L1HS expression and CpG methylation M value 5 kb ± L1HS. Correlation was calculated for all samples at each CpG site, then smoothed with binsize = 500 bp. Shading indicates 95% confidence interval. g Spatial distribution of demethylated CpG (green), over-methylated CpGs (red) and CpGs with no methylation change (gray, dashed) 5 kb ± around L1HS. Binsize = 500 bp. hj Examples of selected TE subfamilies with significant negative correlation (Spearman cor ≤ −0.4 & FDR < 0.05) between intergenic expression and methylation in more than four types of tumors (based on matched samples only). h Tumor vs. Normal differential expression. Heatmap colors: log2 FC. Significance level *: logFC > 1 & FDR < 0.05; **: logFC > 1 & FDR < 0.01; ***: logFC > 1 & FDR < 0.001. i Tumor-normal average Δbeta in 500 bp ± regions around 5′ bp of all intergenic loci of given TE subfamily. j Correlation between intergenic TE expression and M values ~ 500 bp ± 5′ bp of intergenic TE. Heatmap colors: correlation (cor) coefficient. Significance level *: abs(cor) ≥ 0.4&FDR < 0.05, **: abs(cor) ≥ 0.4&FDR < 0.01; ***: abs(cor) ≥ 0.4 & FDR < 0.001
Fig. 4
Fig. 4
TE activity is associated with DNA damage and immune response in the tumor. a Comparison of R2 results of the three lasso models for nine gene signature scores. Each panel is one gene signature, each point is one of 25 cancer type. HR: homologous recombination. APM: antigen processing machinery. EMT: epithelia-mesenchymal-transition. Pan-F-TBRS: pan-fibroblast TGFbeta response signature. Red: R2 from the cellularity-only lasso models. Green: R2 from the cellularity + permuted TE models. Blue: R2 from the cellularity + true TE data models. b Examples of positive correlations between gene signature scores and TE expression levels in different TCGA cancer types. Each point is one tumor sample, gray line is the best fit from linear model. Cor: Spearman correlation coefficient. Gene signature scores were adjusted by tumor content using linear regression. c Association heatmap between one TE subfamily and multiple gene signatures and estimated immune infiltrates across 25 TCGA cancer types. Left: LTR21B. Right: MER57F. Color: Spearman correlation coefficient (cor) from partial correlation adjusting for tumor purity. Significance of correlation: * abs(cor) > 0.5 & FDR < 0.05, ** abs(cor) > 0.5 & FDR < 0.01; *** abs(cor) > 0.5 & FDR < 0.001. Bottom bars show the differential expression log2 fold change and FDR values of TE in each cancer type. Magenta: upregulated. Green: downregulated. Gray: either no normal samples available or the TE expression level was too low for a given cancer type
Fig. 5
Fig. 5
Decitabine increases TE expression and peptide presentation in GBM cell lines. a Working model of the impact of TE expression in the tumor. TE expression in the cytoplasm may trigger intracellular sensing of TE mRNA and result in type I IFN response. TE may be a source of tumor-associated antigens that can be presented at the tumor cell surface and recognized by TE-antigen specific T cells. b Volcano plot showing differential intergenic expression of TE subfamilies, Aza (decitabine) vs. NT (non-treated). TE subfamilies are colored by class at the significance threshold of log2 FC > 1 and BH-adjusted p value < 0.05 and labeled if log2 FC > 1.5 and adjust p value < 0.01. c Association between select overexpressed TE subfamilies and cytokine gene signatures. d Effect of decitabine treatment on TE peptide presentation. Middle panel: histogram on log2 FC for TE peptides abundance TE subfamilies with overexpression of mRNA. The log2 FC of peptide presentation was calculated by comparing spectral areas for each peptide in both Aza vs. NT conditions. Peptides detected only in Aza: peptides uniquely detected in the treated condition. No TE peptides were detected only in the NT condition

References

    1. Sahin U, Türeci Ö. Personalized vaccines for cancer immunotherapy. Science. 2018;359:1355–1360. doi: 10.1126/science.aar7112. - DOI - PubMed
    1. Turajlic S, et al. Insertion-and-deletion-derived tumour-specific neoantigens and the immunogenic phenotype: a pan-cancer analysis. Lancet Oncol. 2017;18:1009–1021. doi: 10.1016/S1470-2045(17)30516-8. - DOI - PubMed
    1. Smart AC, et al. Intron retention is a source of neoepitopes in cancer. Nat. Biotechnol. 2018 doi: 10.1038/nbt.4239. - DOI - PMC - PubMed
    1. Chiappinelli KB, et al. Inhibiting DNA methylation causes an interferon response in cancer via dsrna including endogenous retroviruses. Cell. 2015;169:361. doi: 10.1016/j.cell.2017.03.036. - DOI - PubMed
    1. Roulois D, et al. DNA-demethylating agents target colorectal cancer cells by inducing viral mimicry by endogenous transcripts. Cell. 2015;162:961–973. doi: 10.1016/j.cell.2015.07.056. - DOI - PMC - PubMed

Substances