

Regulatory effect of two Trichinella spiralis serine protease inhibitors on the host's immune system
- PMID: 31745105
- PMCID: PMC6863830
- DOI: 10.1038/s41598-019-52624-5
Regulatory effect of two Trichinella spiralis serine protease inhibitors on the host's immune system
Abstract
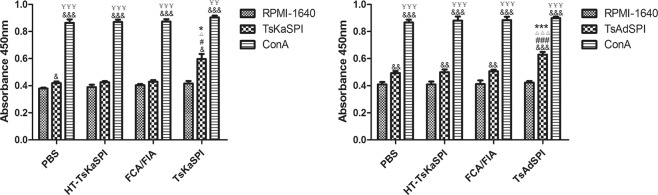
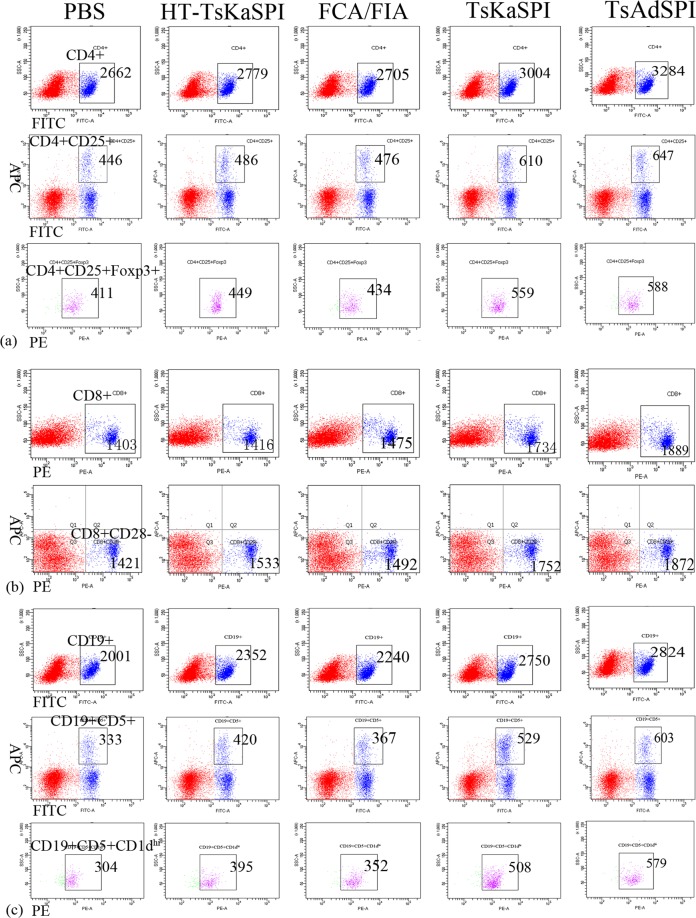
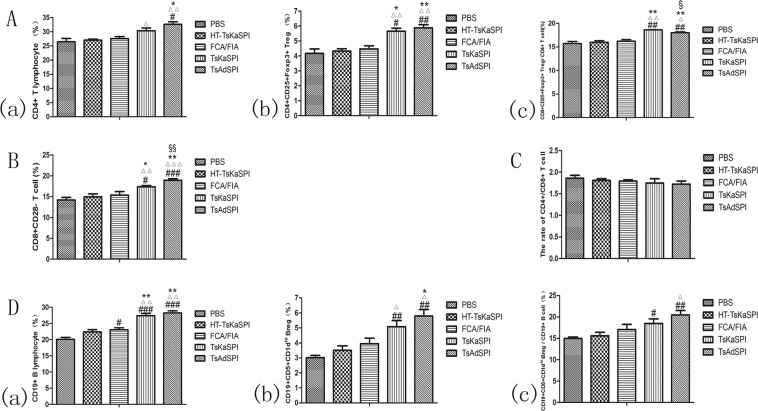
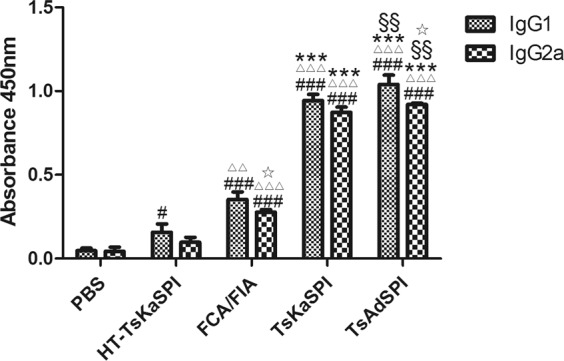
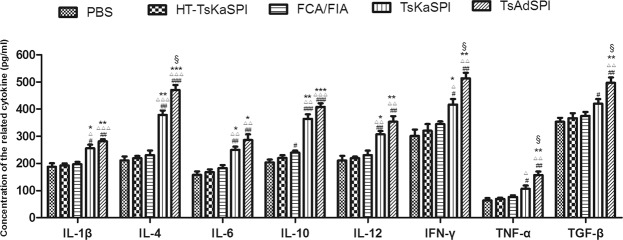
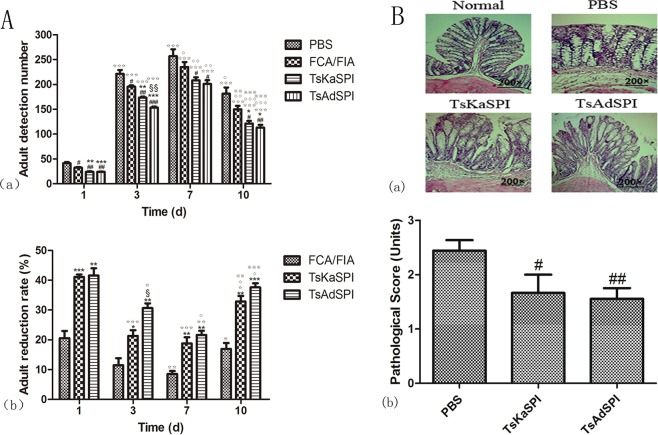
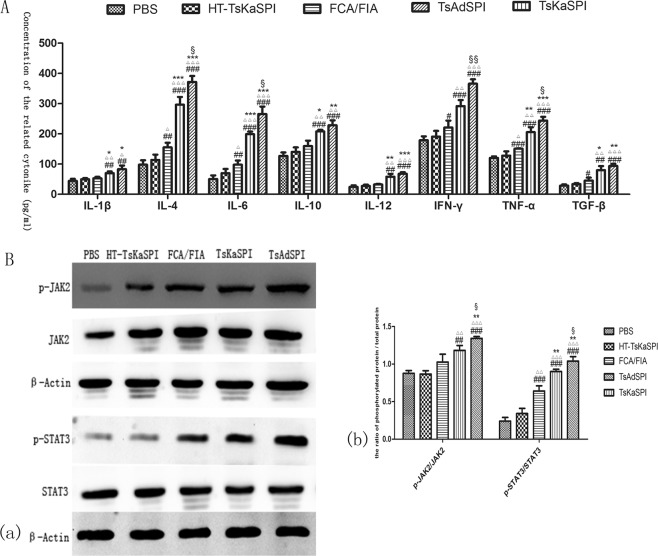
Trichinella spiralis (T. spiralis) is widely distributed throughout the world and can cause serious zoonotic parasitic diseases. Serine protease inhibitors (SPIs) have unique enzyme inhibitory activity and occupy an important position in the interaction between parasites and hosts. In order to further understand the immunoprotective effect of SPIs on T. spiralis invasion in vivo, the Kazal and Serpin type SPI of T. spiralis (TsKaSPI and TsAdSPI) were mixed with Freund's adjuvant in equal volume to immunize mice. The results showed that the expression of IgG1 and IgG2a in serum, the proliferation of spleen cells, and the expression level of cytokines were all increased. The results of flow cytometry showed that the expression of CD4+CD25+Foxp3+ Tregs, CD8+CD28- T cells, CD19+CD5+CD1dhi Bregs in spleen were also increased. Therefore, both TsKaSPI and TsAdSPI could induce strong humoral and cellular immune responses. And the results of adult reduction rate and pathological changes of intestine after adult invasion also indicated that both TsKaSPI and TsAdSPI could prevent T. spiralis from invading intestine. To explore the regulatory effects of TsKaSPI and TsAdSPI on the immune function of macrophage, the results of ELISA showed that the expression of cytokines in cell supernatant were increased. And the results of Western blot showed that both TsKaSPI and TsAdSPI could induce phosphorylation of JAK2 and STAT3 receptors, thereby affecting the signal transduction of macrophages. This experiment demonstrated that SPIs could act as effector molecules affecting the immune function of host when infected with T. spiralis.
Conflict of interest statement
The authors declare no competing interests.
Figures
Similar articles
-
Effects of Trichinella spiralis and its serine protease inhibitors on autophagy of host small intestinal cells.Infect Immun. 2023 Nov 16;91(11):e0010323. doi: 10.1128/iai.00103-23. Epub 2023 Oct 24. Infect Immun. 2023. PMID: 37874164 Free PMC article.
-
Effect of two recombinant Trichinella spiralis serine protease inhibitors on TNBS-induced experimental colitis of mice.Clin Exp Immunol. 2018 Dec;194(3):400-413. doi: 10.1111/cei.13199. Epub 2018 Sep 23. Clin Exp Immunol. 2018. PMID: 30105843 Free PMC article.
-
The Anti-Inflammatory Immune Response in Early Trichinella spiralis Intestinal Infection Depends on Serine Protease Inhibitor-Mediated Alternative Activation of Macrophages.J Immunol. 2021 Mar 1;206(5):963-977. doi: 10.4049/jimmunol.2000290. Epub 2021 Jan 25. J Immunol. 2021. PMID: 33495238 Free PMC article.
-
Vaccination of mice with an antigenic serine protease-like protein elicits a protective immune response against Trichinella spiralis infection.J Parasitol. 2013 Jun;99(3):426-32. doi: 10.1645/12-46.1. Epub 2012 Dec 19. J Parasitol. 2013. PMID: 23252743
-
Characterization of a serine protease inhibitor from Trichinella spiralis and its participation in larval invasion of host's intestinal epithelial cells.Parasit Vectors. 2018 Sep 6;11(1):499. doi: 10.1186/s13071-018-3074-3. Parasit Vectors. 2018. PMID: 30189888 Free PMC article.
Cited by
-
Trichinella spiralis dipeptidyl peptidase 1 suppressed macrophage cytotoxicity by promoting M2 polarization via the STAT6/PPARγ pathway.Vet Res. 2023 Sep 13;54(1):77. doi: 10.1186/s13567-023-01209-2. Vet Res. 2023. PMID: 37705099 Free PMC article.
-
RNAi-mediated silencing of Trichinella spiralis serpin-type serine protease inhibitors results in a reduction in larval infectivity.Vet Res. 2020 Nov 23;51(1):139. doi: 10.1186/s13567-020-00860-3. Vet Res. 2020. PMID: 33225967 Free PMC article.
-
Effects of Trichinella spiralis and its serine protease inhibitors on autophagy of host small intestinal cells.Infect Immun. 2023 Nov 16;91(11):e0010323. doi: 10.1128/iai.00103-23. Epub 2023 Oct 24. Infect Immun. 2023. PMID: 37874164 Free PMC article.
-
Serine protease inhibitor derived from Trichinella spiralis (TsSERP) inhibits neutrophil elastase and impairs human neutrophil functions.Front Cell Infect Microbiol. 2022 Oct 25;12:919835. doi: 10.3389/fcimb.2022.919835. eCollection 2022. Front Cell Infect Microbiol. 2022. PMID: 36389172 Free PMC article.
-
Regulatory effects of Trichinella spiralis serpin-type serine protease inhibitor on endoplasmic reticulum stress and oxidative stress in host intestinal epithelial cells.Vet Res. 2024 Jun 14;55(1):78. doi: 10.1186/s13567-024-01334-6. Vet Res. 2024. PMID: 38877574 Free PMC article.
References
Publication types
MeSH terms
Substances
LinkOut - more resources
Full Text Sources
Medical
Research Materials
Miscellaneous
