. 2019 Nov 19;9(1):16324.
doi: 10.1038/s41598-019-51974-4.

Neural correlates of the DMT experience assessed with multivariate EEG

Affiliations

Neural correlates of the DMT experience assessed with multivariate EEG

Christopher Timmermann et al. Sci Rep. .

Abstract

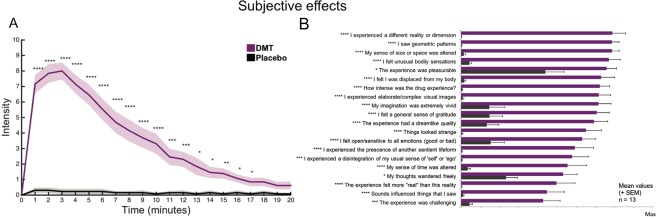
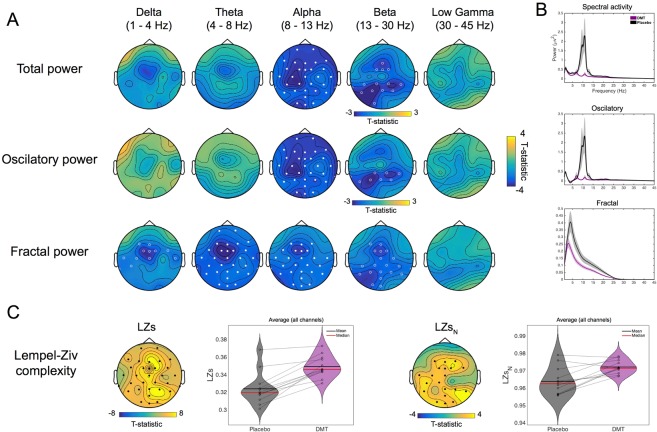
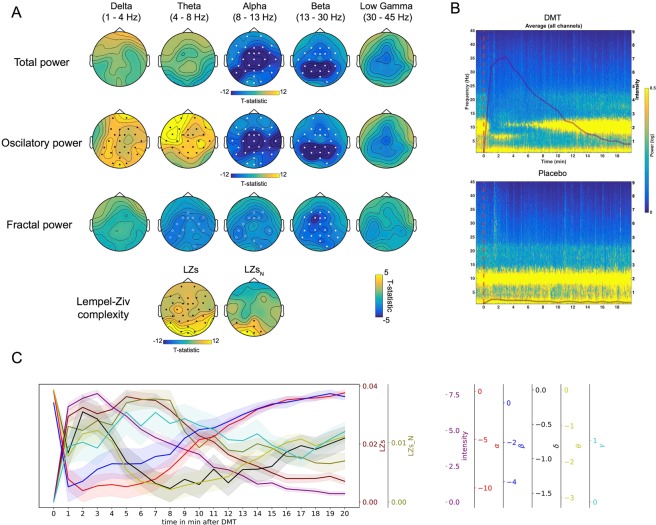
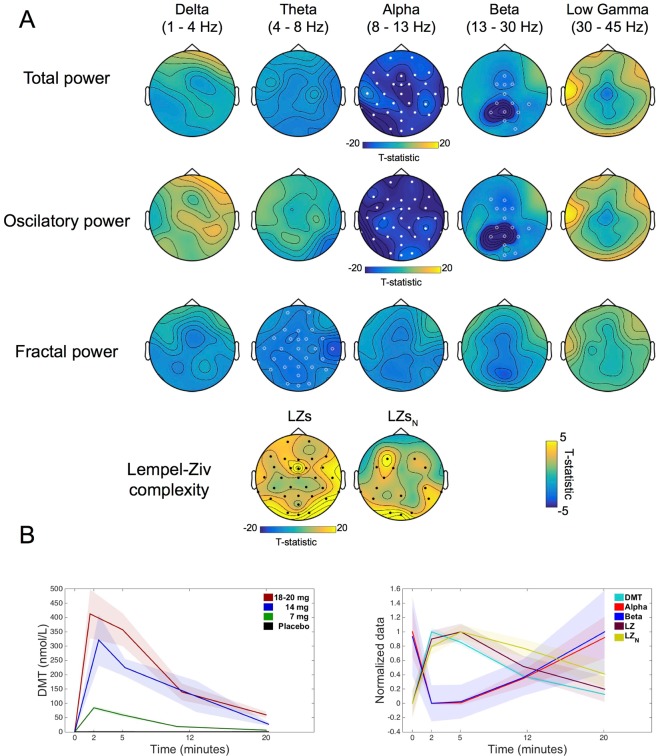
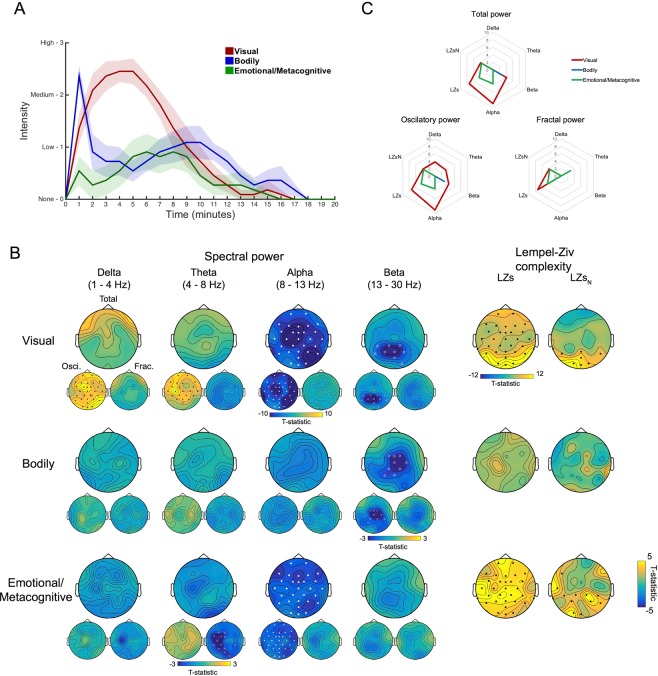
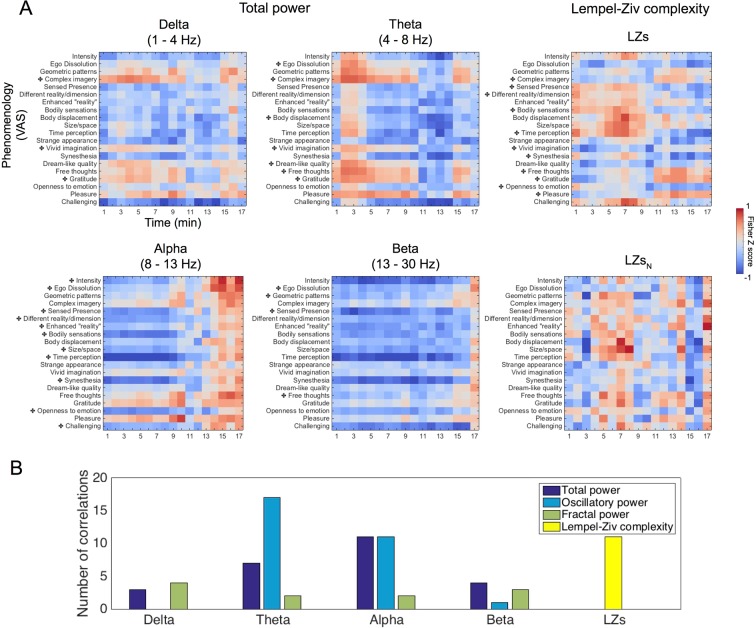
Studying transitions in and out of the altered state of consciousness caused by intravenous (IV) N,N-Dimethyltryptamine (DMT - a fast-acting tryptamine psychedelic) offers a safe and powerful means of advancing knowledge on the neurobiology of conscious states. Here we sought to investigate the effects of IV DMT on the power spectrum and signal diversity of human brain activity (6 female, 7 male) recorded via multivariate EEG, and plot relationships between subjective experience, brain activity and drug plasma concentrations across time. Compared with placebo, DMT markedly reduced oscillatory power in the alpha and beta bands and robustly increased spontaneous signal diversity. Time-referenced and neurophenomenological analyses revealed close relationships between changes in various aspects of subjective experience and changes in brain activity. Importantly, the emergence of oscillatory activity within the delta and theta frequency bands was found to correlate with the peak of the experience - particularly its eyes-closed visual component. These findings highlight marked changes in oscillatory activity and signal diversity with DMT that parallel broad and specific components of the subjective experience, thus advancing our understanding of the neurobiological underpinnings of immersive states of consciousness.


Conflict of interest statement

The authors declare no competing interests.

Figures

Figure 1
Figure 1
Subjective effects. (A) Real-time intensity ratings for DMT and placebo (mean ± SEM) (****p < 0.001; ***p < 0.005; **p < 0.01; * p < 0.05, FDR corrected, N = 13). (B) Visual analogue scales depict the phenomenological features of DMT and placebo (mean + SEM) (****p < 0.001; ***p < 0.005; **p < 0.01; *p < 0.05, FDR corrected, N = 13).
Figure 2
Figure 2
Time-averaged EEG results. (A) The comparison of DMT versus placebo for changes in spectral activity reveals significant decreases for the alpha and beta bands for conventional spectral power. The decomposed spectra into oscillatory and fractal power, revealed similar results for the former and reductions were seen on all bands < 30 Hz for the latter. Filled circles correspond to clusters p < 0.01 and hollow circles for clusters p < 0.05, N = 12. (B) Grand-average spectral power for DMT and placebo corresponding to spectral, oscillatory and fractal (1/f) components of the signal (N = 12). (C) Increases are seen for both measures of spontaneous signal diversity following DMT administration compared to placebo Filled circles correspond to clusters p < 0.01 and hollow circles for clusters p < 0.05, N = 12 (LZs = Lempel-Ziv complexity, LZsN = normalized LZs).
Figure 3
Figure 3
Subjective vs EEG effects across time. (A) Significant inverse relationships were found between real-time intensity ratings and power in alpha and beta bands for all power measures (including the theta band for fractal power). A positive relationship was found between intensity and power at delta and theta bands in the oscillatory component. Increased signal diversity (LZs and LZsN) correlated positively with intensity ratings also. Filled circles/dots correspond to clusters p < 0.01 and hollow circles for clusters p < 0.05, N = 12. Positive relationships are shown using black dots and negative relationships are shown using white dots/circles (B) Time frequency plot illustrating the associations between intensity ratings and spectral activity for DMT and placebo (red line marks beginning of injection), N = 12. (C) Temporal development of intensity, and EEG measures of spectral activity and spontaneous signal diversity (mean ± SEM, N = 12). (δ = delta, θ = theta, γ = gamma, α = alpha, β = beta, LZs = Lempel-Ziv complexity, LZsN = normalized LZs).
Figure 4
Figure 4
Plasma DMT vs EEG effects. (A) Significant inverse relationships (white dots/circles) were found between plasma levels of DMT and power in the alpha and beta bands for spectral and oscillatory power, while the relationship was found for plasma DMT and power in the theta band for fractal power. A positive relationship (black dots) was found between plasma levels of DMT and complexity measures (LZs and LZsN). Filled circles correspond to clusters p < 0.01 and hollow circles for clusters p < 0.05, N = 12. (B) Temporal development of DMT plasma concentrations, and EEG measures of total power and spontaneous signal diversity which were found significant to have a significant effect (mean ± SEM, N = 12).
Figure 5
Figure 5
Neurophenomenology. (A) Average ratings (mean ± SEM) regarding the intensity for the three dimensions of experience which were found to be commonly altered across all participants following DMT administration. (B) Significant inverse relationships (white dots/circles) were found between the progression of visual effects induced by DMT and power at the alpha and the beta bands, as well as increases (black dots) in complexity (LZs and LZsN). Decreases of central beta band power showed a significant association the trajectory of bodily effects. Decreases in alpha band power and increases in complexity (LZs and LZsN) were significantly associated to the dynamics of emotional/metacognitive effects. Mostly consistent results were found with oscillatory power, however an intriguing positive relationship found with power at delta and theta bands for visual effects and reduced theta activity was linked to emotional/metacognitive effects. Filled circles/dots correspond to clusters p < 0.01 and hollow circles for clusters p < 0.05, N = 11. (C) Radar plots displaying the constellation of EEG effects associated to different dimensions of experience (mean values displayed).
Figure 6
Figure 6
Psychometric correlational analyses. (A) Normalized correlation coefficient values between VAS items and EEG measures for each minute following DMT. Significant correlations between these normalized correlation values and intensity ratings are marked with a cross following Bonferroni-correction for multiple comparisons at p < 0.05 (see Fig. S3 for correlations with oscillatory and fractal power and Fig. S4 for 5-minute averaged data correlations). (B) Bar chart displaying the number of significant correlations between normalized correlation values (EEG metrics vs VAS items) and intensity ratings. Results revealed that alpha correlate most with subjective experience when the total power is assessed, whereas theta correlates most when just the oscillatory power is extracted. Conversely, fractal power displayed a small amount of significant correlations (See Fig. S6 for the specific correlation values for each item for oscillatory and fractal power). Finally LZs was a metric which displayed the same amount of significant correlations as alpha in total and oscillatory power.
Figure 7
Figure 7
Schematic of the LZs computation. An example EEG signal with a sampling rate of 250 Hz and a length of 1 sec is shown in black (x). The mean (red) of the absolute value of its analytic signal (green, a) is used to binarize the signal (blue). The encoding step of the Lempel-Ziv algorithm is then applied to the first 25 entries of that binarized signal (in this illustration), creating a dictionary of the unique subsequences, which is then normalized by dividing the raw value by those obtained for the same randomly shuffled binary sequence. This provides a value between 0–1 that quantifies the temporal diversity of the EEG signal (LZs).

References

    1. Nichols DE. Psychedelics. Pharmacol. Rev. 2016;68:264–355. doi: 10.1124/pr.115.011478. - DOI - PMC - PubMed
    1. Szára S. Dimethyltryptamin: Its metabolism in man; the relation of its psychotic effect to the serotonin metabolism. Experientia. 1956;12:441–442. doi: 10.1007/BF02157378. - DOI - PubMed
    1. Strassman RJ, Qualls CR, Uhlenhuth EH, Kellner R. Dose-Response Study of N,N-Dimethyltryptamine In Humans. II. Subjective effects and preliminary results of a new rating scale. Arch. Gen. Psychiatry. 1994;51:98–108. doi: 10.1001/archpsyc.1994.03950020022002. - DOI - PubMed
    1. Strassman, R. DMT: The spirit molecule. (Park Street Press, 2001).
    1. Strassman RJ. Human psychopharmacology of N,N-dimethyltryptamine. Behav. Brain Res. 1995;73:121–124. doi: 10.1016/0166-4328(96)00081-2. - DOI - PubMed

Publication types