. 2019 Nov 19;9(1):17049.
doi: 10.1038/s41598-019-53448-z.

Prediction and associations of preterm birth and its subtypes with eicosanoid enzymatic pathways and inflammatory markers

Affiliations

Prediction and associations of preterm birth and its subtypes with eicosanoid enzymatic pathways and inflammatory markers

Max T Aung et al. Sci Rep. .

Abstract

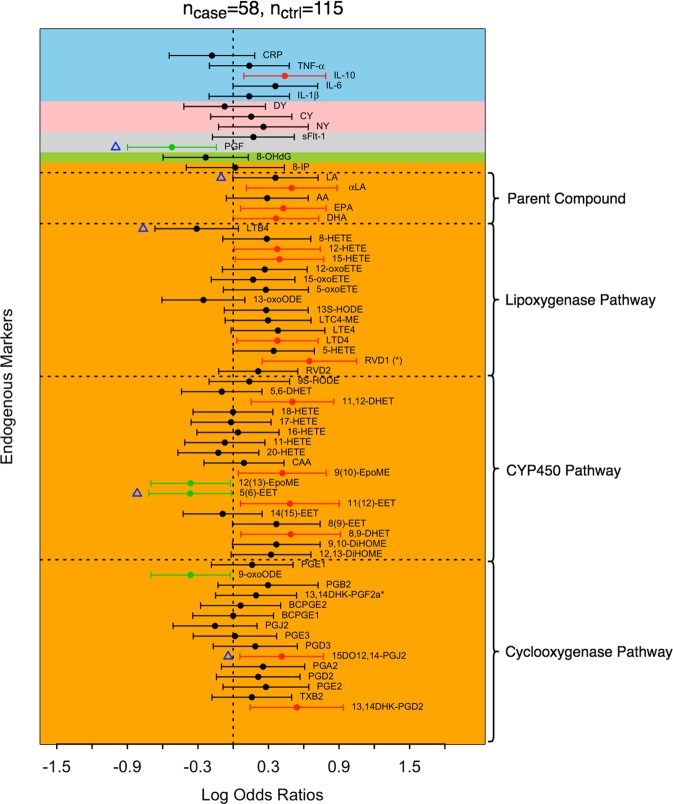
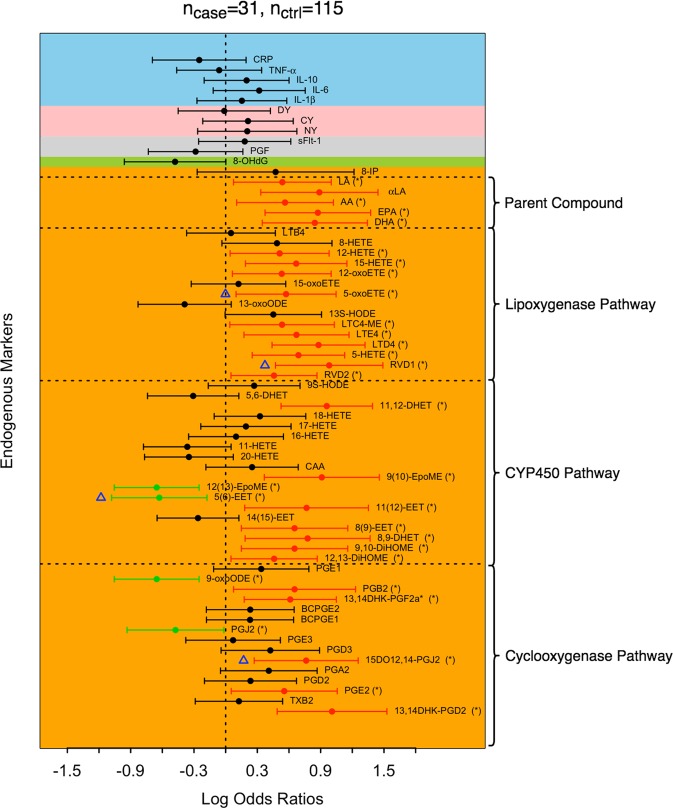
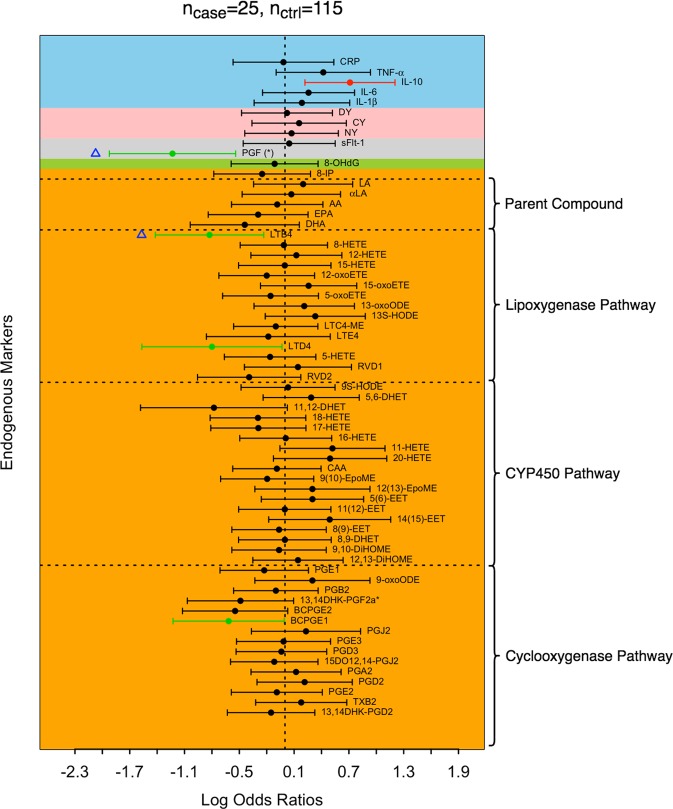
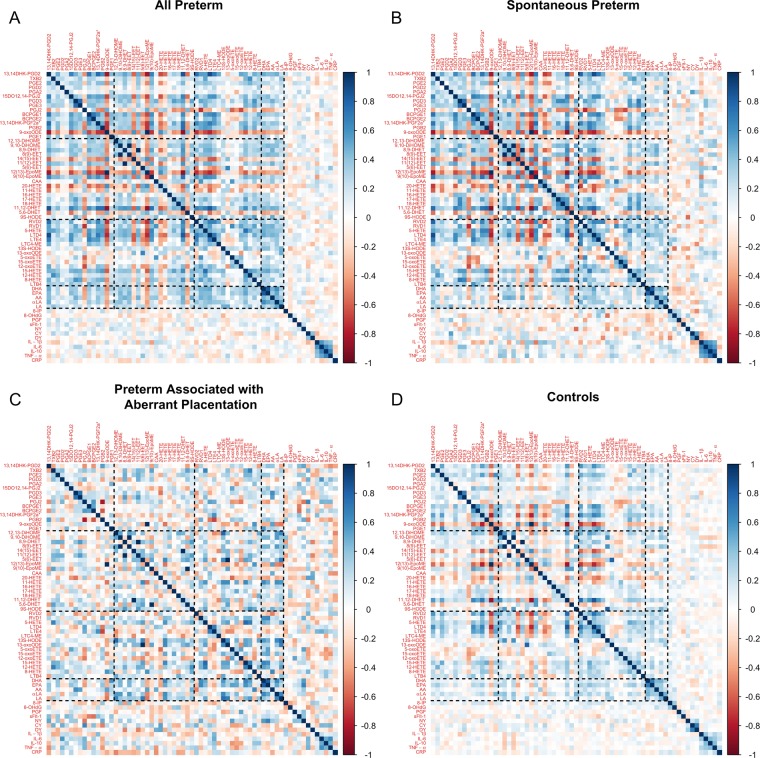
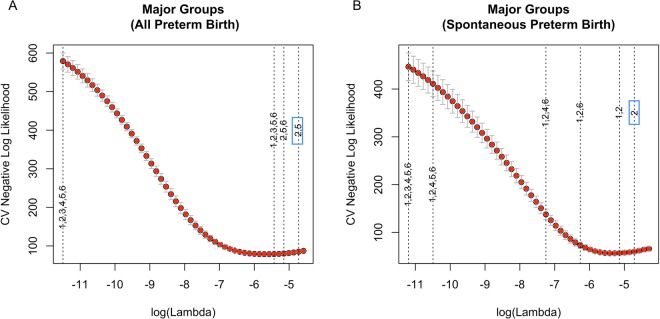
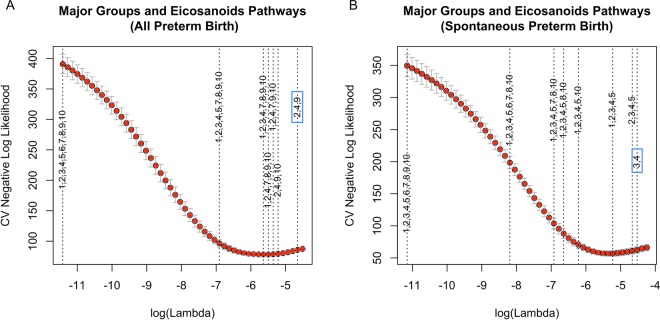
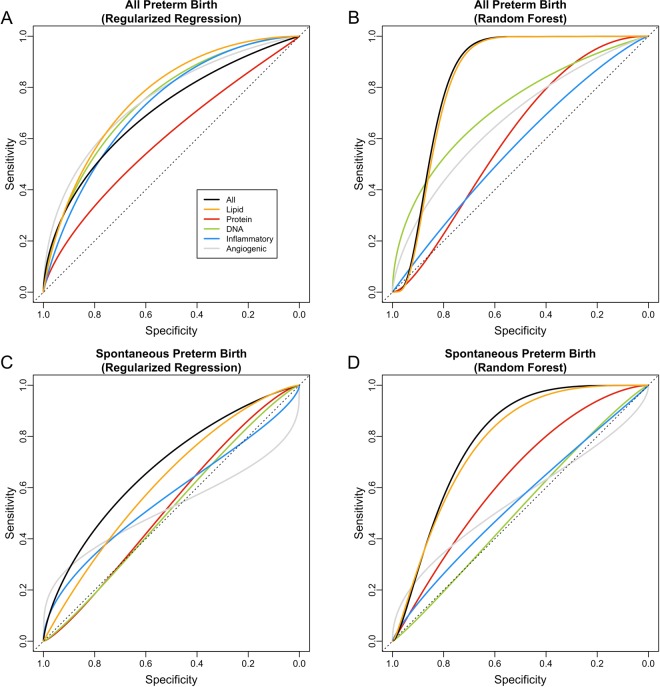
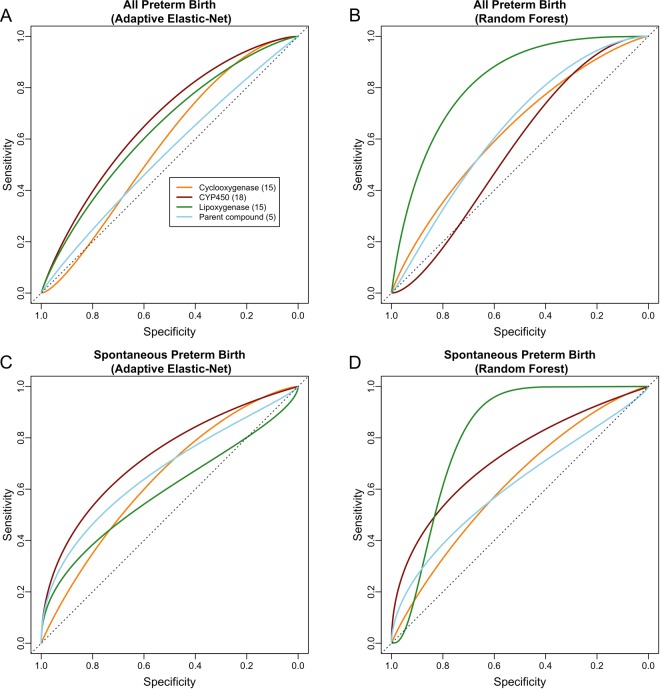
Endogenous signaling molecules derived from lipids, peptides, and DNA, are important regulators of physiological processes during pregnancy. The effect of their collective impact on preterm birth (delivery < 37 weeks gestation) is understudied. We aimed to characterize the associations and predictive capacity of an extensive panel of eicosanoids, immune biomarkers, oxidative stress markers, and growth factors towards preterm birth and its subtypes. We conducted a cross-sectional study of pregnant women (recruited < 15 weeks gestation) in the LIFECODES birth cohort, which included 58 cases of preterm birth and 115 controls that delivered term. Among the cases there were 31 cases who had a spontaneous preterm birth (cases who had spontaneous preterm labor and/or preterm premature rupture of membranes) and 25 that had preterm birth associated with aberrant placentation (cases who had preeclampsia and/or intrauterine growth restriction) and 2 cases that could not be sufficiently categorized as either. We analyzed single biomarker associations with each preterm birth outcome using multiple logistic regression. Adaptive elastic-net was implemented to perform a penalized multiple logistic regression on all biomarkers simultaneously to identify the most predictive biomarkers. We then organized biomarkers into biological groups and by enzymatic pathways and applied adaptive elastic-net and random forest to evaluate the accuracy of each group for predicting preterm birth cases. The majority of associations we observed were for spontaneous preterm birth, and adaptive elastic-net identified 5-oxoeicosatetraenoic acid, resolvin D1, 5,6-epoxy-eicsatrienoic acid, and 15-deoxy-12,14-prostaglandin J2 as most predictive. Overall, lipid biomarkers performed the best at separating cases from controls compared to other biomarker categories (adaptive elastic-net AUC = 0.78 [0.62, 0.94], random forest AUC = 0.84 [0.72, 0.96]). Among the enzymatic pathways that differentiate eicosanoid metabolites, we observed the highest prediction of overall preterm birth by lipoxygenase metabolites using random forest (AUC = 0.83 [0.69, 0.96]), followed by cytochrome p450 metabolites using adaptive elastic-net (AUC = 0.74 [0.52, 0.96]). In this study we translate biological hypothesis into the language of modern machine learning. Many lipid biomarkers were highly associated with overall and spontaneous preterm birth. Among eicosanoids, lipoxygenase and cytochrome p450 products performed best in identifying overall and spontaneous preterm birth. The combination of lipid biomarkers may have good utility in clinical settings to predict preterm birth.


Conflict of interest statement

The authors declare they have no competing financial or non-financial interests as defined by Nature Research, or other interests that might be perceived to influence the results and/or discussion reported in this paper.

Figures

Figure 1
Figure 1
Log odds ratios of all preterm birth. Positive and negative log odds ratios with p < 0.05 are represented by red and green dots, respectively. Biomarkers that remain significant after controlling the false discovery rate at 0.1 are labeled by (*) in their names. Biomarkers selected by adaptive elastic-net applied to all biomarkers are labeled by blue triangles. The blocks are shaded according to their corresponding major groups: lipid damage markers (orange), DNA damage marker (green), angiogenic factors (grey), protein damage marker (pink), and inflammatory markers (blue).
Figure 2
Figure 2
Log odds ratios of spontaneous preterm birth. Positive and negative log odds ratios with p < 0.05 are represented by red and green dots, respectively. Biomarkers that remain significant after controlling the false discovery rate at 0.1 are labeled by (*) in their names. Biomarkers selected by adaptive elastic-net applied to all biomarkers are labeled by blue triangles. The blocks are shaded according to their corresponding major groups: lipid damage markers (orange), DNA damage marker (green), angiogenic factors (grey), protein damage marker (pink), and inflammatory markers (blue).
Figure 3
Figure 3
Log odds ratios of preterm birth associated with aberrant placentation. Positive and negative log odds ratios with p < 0.05 are represented by red and green dots, respectively. Biomarkers that remain significant after controlling the false discovery rate at 0.1 are labeled by (*) in their names. Biomarkers selected by adaptive elastic-net applied to all biomarkers are labeled by blue triangles. The blocks are shaded according to their corresponding major groups: lipid damage markers (orange), DNA damage marker (green), angiogenic factors (grey), protein damage marker (pink), and inflammatory markers (blue).
Figure 4
Figure 4
Correlations among biomarkers in cases and controls. Correlations were calculated among all preterm birth (A), spontaneous preterm birth (B), placental preterm birth (C), and controls (D). Eicosanoids were grouped by biological pathways (dashed lines).
Figure 5
Figure 5
Sparse-group lasso on the five major groups for (A) all preterm birth and (B) spontaneous preterm birth. The dashed lines indicate the value of log(λ) corresponding to the first time the whole group of variables are excluded from the model as log(λ) increases. The numbers 1 to 6 on the dashed lines indicate covariates (1), lipid damage markers (2), DNA damage marker (3), angiogenic factors (4), protein damage markers (5), and inflammatory markers (6), respectively.
Figure 6
Figure 6
Sparse-group lasso on the combination of major groups and eicosanoids pathways for (A) all preterm birth and (B) spontaneous preterm birth. The dashed lines indicate the value of log(λ) corresponding to the first time the whole group of variables are excluded from the model as log(λ) increases. The numbers 1 to 10 on the dashed lines indicate covariates (1), cyclooxygenase pathway (2), CYP450 pathway (3), lipoxygenase pathway (4), parent compound (5), 8-isoprostane (6), DNA damage marker (7), angiogenic factors (8), protein damage markers (9), and inflammatory markers (10), respectively.
Figure 7
Figure 7
The Receiver Operating Characteristic (ROC) curve for the selected model for major groups. The area under the ROC curve for each group is: (A) logistic regression or adaptive elastic-net for all preterm: all (0.72 [0.53, 0.91]), lipid (0.78 [0.62, 0.94]), angiogenic factors (0.76 [0.60, 0.93]), protein (0.60 [0.41, 0.79]), DNA (0.76 [0.61, 0.90]), inflammatory (0.73 [0.58, 0.89]); (B) random forest for all preterm: all (0.85 [0.74, 0.97]), lipid (0.84 [0.72, 0.96]), angiogenic factors (0.68 [0.50, 0.87]), protein (0.60 [0.44, 0.77]), DNA (0.74 [0.56, 0.92]), inflammatory (0.57 [0.40, 0.74]); (C) logistic regression or adaptive elastic-net for spontaneous preterm: all (0.69 [0.46, 0.91]), lipid (0.63 [0.42, 0.84]), angiogenic factors (0.51 [0.32, 0.71]), protein (0.53 [0.29, 0.78]), DNA (0.51 [0.26, 0.76]), inflammatory (0.57 [0.31, 0.83]); (D) random forest for spontaneous preterm: all (0.79 [0.61, 0.98]), lipid (0.79 [0.62, 0.96]), angiogenic factors (0.54 [0.25, 0.83]), protein (0.64 [0.44, 0.84]), DNA (0.52 [0.29, 0.75]), inflammatory (0.55 [0.31, 0.79]).
Figure 8
Figure 8
The Receiver Operating Characteristic (ROC) curve for the selected model for biological pathways of eicosanoids. The area under the ROC curve for each group is: (A) adaptive elastic-net for all preterm: cyclooxygenase (0.58 [0.41, 0.75]), CYP450 (0.68 [0.51, 0.85]), lipoxygenase (0.65 [0.45, 0.84]), parent compound (0.56 [0.37, 0.76]); (B) random forest for all preterm: cyclooxygenase (0.65 [0.47, 0.83]), CYP450 (0.56 [0.39, 0.73]), lipoxygenase (0.83 [0.69, 0.96]), parent compound (0.65 [0.48, 0.81]); (C) adaptive elastic-net for spontaneous preterm: cyclooxygenase (0.67 [0.44, 0.90]), CYP450 (0.74 [0.52, 0.96]), lipoxygenase (0.60 [0.35, 0.85]), parent compound (0.67 [0.43, 0.91]); (D) random forest for spontaneous preterm: cyclooxygenase (0.63 [0.40, 0.87]), CYP450 (0.73 [0.51, 0.95]), lipoxygenase (0.82 [0.68, 0.96]), parent compound (0.63 [0.39, 0.86]).

References

    1. Callaghan WM, MacDorman MF, Rasmussen SA, Qin C, Lackritz EM. The contribution of preterm birth to infant mortality rates in the United States. Pediatrics. 2006;118:1566–1573. doi: 10.1542/peds.2006-0860. - DOI - PubMed
    1. Klebanoff MA, Keim SA. Epidemiology: the changing face of preterm birth. Clin Perinatol. 2011;38:339–350. doi: 10.1016/j.clp.2011.06.006. - DOI - PubMed
    1. Institute of Medicine. Preterm Birth: Causes, Consequences, and Prevention, 10.17226/11622 (2007).
    1. Moster D, Lie RT, Markestad T. Long-term medical and social consequences of preterm birth. N Engl J Med. 2008;359:262–273. doi: 10.1056/NEJMoa0706475. - DOI - PubMed
    1. McElrath TF, et al. Pregnancy Disorders That Lead to Delivery Before the 28th Week of Gestation: An Epidemiologic Approach to Classification. American Journal of Epidemiology. 2008;168:980–989. doi: 10.1093/aje/kwn202. - DOI - PMC - PubMed

Publication types