. 2020 Jan;45(1):10-22.
doi: 10.3892/ijmm.2019.4408. Epub 2019 Nov 19.

Apoptotic SKOV3 cells stimulate M0 macrophages to differentiate into M2 macrophages and promote the proliferation and migration of ovarian cancer cells by activating the ERK signaling pathway

Affiliations

Apoptotic SKOV3 cells stimulate M0 macrophages to differentiate into M2 macrophages and promote the proliferation and migration of ovarian cancer cells by activating the ERK signaling pathway

Qun Zhang et al. Int J Mol Med. 2020 Jan.

Abstract

Ovarian cancer has a high rate of recurrence, with M2 macrophages having been found to be involved in its progression and metastasis. To examine the relationship between macrophages and ovarian cancer in the present study, M0 macrophages were stimulated with apoptotic SKOV3 cells and it was found that these macrophages promoted tumor proliferation and migration. Subsequently, the mRNAs and proteins expressed at high levels in these M2 macrophages were examined by RNA‑Seq and quantitative proteomics, respectively, which revealed that M0 macrophages stimulated by apoptotic SKOV3 cells also expressed M2 markers, including CD206, interleukin‑10, C‑C motif chemokine ligand 22, aminopeptidase‑N, disabled homolog 2, matrix metalloproteinase 1 and 5'‑nucleotidase. The abundance of phosphorylated Erk1/2 in these macrophages was increased. The results indicate that apoptotic SKOV3 cells stimulate M0 macrophages to differentiate into M2 macrophages by activating the ERK pathway. These results suggest possible treatments for patients with ovarian cancer who undergo chemotherapy; inhibiting M2 macrophage differentiation during chemotherapy may reduce the rate of tumor recurrence.

Keywords: apoptotic SKOV3; M2 macrophage; quantitative proteomics; RNA-Seq; ERK pathway.


Figures

Figure 1
Figure 1
Proliferation and migration of SKOV3 cells. (A) Proliferative ability, measured using a CCK-8 assay, of SKOV3 cells cultured in CM from SKOV3 cells (SKOV3 CM) or the co-culture of apoptotic SKOV3 cells and macrophages (M0-DS CM) for different periods of time (4-24 h). (B) Proliferative ability, measured using a CCK-8 assay, of SKOV3 cells cultured in CM from SKOV3 cells, M0 macrophages, M2 macrophages, macrophages co-cultured with apoptotic or non-apoptotic SKOV3 cells, or apoptotic SKOV3 cells only. (C) Transwell assay examining the migration ability of the SKOV3 cells in the six CM groups. Scale bar, 500 µm. Results are typical of three independent experiments. Data are presented as the mean ± SD (n=3). Intergroup differences were analyzed using one-way ANOVA. Tukey's post hoc test was used for the multiple comparisons among the various groups. *P<0.05, **P<0.01 and ***P<0.001 vs. SKOV3 CM group; #P<0.05, ##P<0.01 and ###P<0.001 vs. SKOV3 CM group. CCK-8, Cell counting kit-8; CM, conditioned media; DS, apoptotic SKOV3 cells.
Figure 2
Figure 2
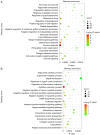
Differentially expressed genes and proteins. Bubble charts show enrichment of the differentially expressed genes/proteins in GO biological processes. (A) RNA-Seq result; (B) proteomic result (top 20 pathways). The abscissa represents the statistically significant level of enrichment analysis; the ordinate represents the description of the GO function. The count represents all differential genes/proteins associated with this term. Differentially expressed genes and proteins. Bubble charts show enrichment of the differentially expressed genes/proteins in GO biological processes. (C) Protein interaction network analysis of the 43 upregulated proteins in Table II using the STRING website. GO, Gene Ontology.
Figure 2
Figure 2
Differentially expressed genes and proteins. Bubble charts show enrichment of the differentially expressed genes/proteins in GO biological processes. (A) RNA-Seq result; (B) proteomic result (top 20 pathways). The abscissa represents the statistically significant level of enrichment analysis; the ordinate represents the description of the GO function. The count represents all differential genes/proteins associated with this term. Differentially expressed genes and proteins. Bubble charts show enrichment of the differentially expressed genes/proteins in GO biological processes. (C) Protein interaction network analysis of the 43 upregulated proteins in Table II using the STRING website. GO, Gene Ontology.
Figure 3
Figure 3
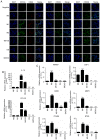
Differentiation of M0 macrophages into M2 macrophages. (A) Immunofluorescence of macrophage makers CD163, CD68, CD204 and CD206 in M0, M1 and M2 macrophages, apoptotic SKOV3-stimulated M0 macrophages, apoptotic SKOV3 cells and SKOV3 cells. M0, M1, M2, M0-DS group Scale bar, 100 µm; SKOV3, DS group Scale bar, 50 µm. (B) Relative mRNA expression levels of CCL22 and IL-10 in M0, M1 and M2 macrophages, apoptotic SKOV3-stimulated M0 macrophages, apoptotic SKOV3 cells and SKOV3 cells determined by RT-qPCR analysis. GAPDH was used as an internal standard. (C) Relative mRNA expression levels of ANPEP, CSF1, DAB2, MMP1, ITGAM and NT5E in M0 and M2 macrophages, apoptotic SKOV3-stimulated M0 macrophages, apoptotic SKOV3 cells, and SKOV3 cells determined by RT-qPCR analysis. GAPDH was used as an internal standard. Results are typical of three independent experiments. Data are presented as the mean ± SD (n=3). Intergroup differences were analyzed using one-way ANOVA. Tukey's post hoc test was used for the multiple comparisons among the various groups. **P<0.01 and ***P<0.001 vs. M0 macrophages; ##P<0.01 and ###P<0.001 vs. M0 macrophages RT-qPCR, reverse transcription-quantitative PCR; DS, apoptotic SKOV3 cells; CCL22, IL, interleukin; ANPEP, aminopeptidase-N; CSF1, colony stimulating factor 1; DAB2, disabled homolog 2; ITGAM, integrin α-M; MMP1, matrix metalloproteinase 1; NT5E, 5′-nucleotidase.
Figure 4
Figure 4
Role of ERK in M0 to M2 macrophage differentiation. (A) Gene Set Enrichment Analysis of the proteomic results from M0 and M2 macrophages. (B) Analysis of the phosphorylation of Erk1/2 in M0, M0-DS, apoptotic SKOV3, SKOV3, M0-PD and M0-PD-DS groups. ***P<0.001; ###P<0.001. (C) Cell counting kit-8 assay examining the proliferative ability of SKOV3 cells cultured with M0 CM, M0-PD CM, M0-PD-DS CM. *P<0.05 vs. M0-PD CM; ***P<0.001 vs. M0-PD CM group; ##P<0.01 vs. M0 CM group; ###P<0.001 vs. M0 CM group (D) Transwell assay examining the migration ability of SKOV3 cells cultured with M0 CM, M0-PD CM and M0-PD-DS CM. *P<0.05 and ###P<0.001. Results are typical of three independent experiments. Data are presented as the mean ± SD (n=3). Intergroup differences were analyzed using one-way ANOVA. Tukey's post hoc test was used for the multiple comparisons among the various groups. CM, conditioned media; PD, PD98059; DS, apoptotic SKOV3 cells; p, phosphorylated.
Figure 5
Figure 5
Schematic of cell interactions and differentiation. Apoptosis was induced in SKOV3 cells using DDP. Following stimulation by apoptotic SKOV3 cells, M0 macrophages (M0-DS macrophages) express M2 macrophage markers, and promote the proliferation and migration of SKOV3 cells by activating the ERK pathway. DPP, cisplatin; IL, interleukin.

References

    1. Siegel RL, Miller KD, Jemal A. Cancer statistics, 2017. CA Cancer J Clin. 2017;67:7–30. doi: 10.3322/caac.21387. - DOI - PubMed
    1. Kujawa KA, Lisowska KM. Ovarian cancer-from biology to clinic. Postepy Hig Med Dosw (Online) 2015;69:1275–1290. doi: 10.5604/17322693.1184451. In Polish. - DOI - PubMed
    1. Ju X, Yu H, Liang D, Jiang T, Liu Y, Chen L, Dong Q, Liu X. LDR reverses DDP resistance in ovarian cancer cells by affecting ERCC-1, Bcl-2, Survivin and Caspase-3 expressions. Biomed Pharmacother. 2018;102:549–554. doi: 10.1016/j.biopha.2018.03.092. - DOI - PubMed
    1. Liu J, Matulonis UA. New strategies in ovarian cancer: Translating the molecular complexity of ovarian cancer into treatment advances. Clin Cancer Res. 2014;20:5150–5156. doi: 10.1158/1078-0432.CCR-14-1312. - DOI - PubMed
    1. Hirata E, Sahai E. Tumor microenvironment and differential responses to therapy. Cold Spring Harb Perspect Med. 2017;7:a026781. doi: 10.1101/cshperspect.a026781. - DOI - PMC - PubMed

MeSH terms