. 2020 Jan;43(1):133-146.
doi: 10.3892/or.2019.7400. Epub 2019 Nov 6.

Identification of potential hub genes related to the progression and prognosis of hepatocellular carcinoma through integrated bioinformatics analysis

Affiliations

Identification of potential hub genes related to the progression and prognosis of hepatocellular carcinoma through integrated bioinformatics analysis

Xiudao Song et al. Oncol Rep. 2020 Jan.

Abstract

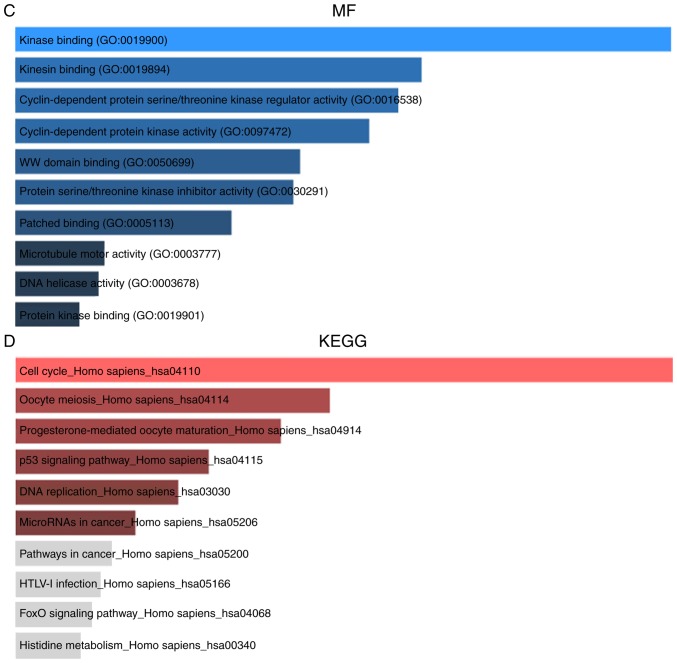
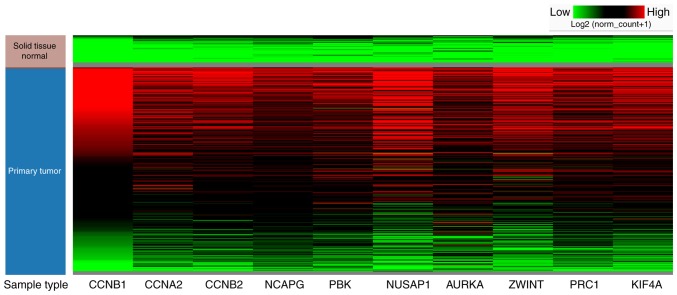
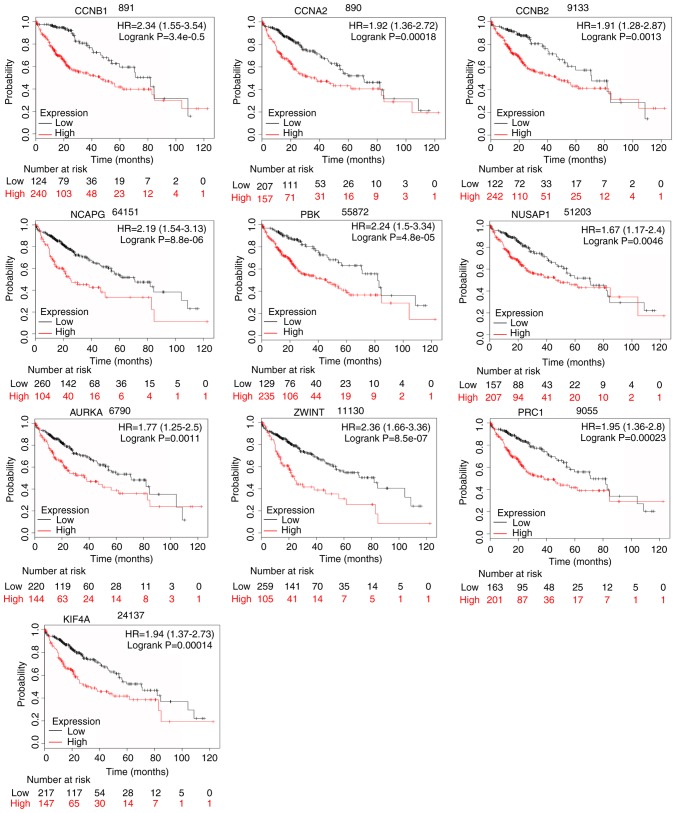
Hepatocellular carcinoma (HCC) is the fourth leading cause of cancer‑related deaths among cancer patients. Genes correlated with the progression and prognosis of HCC are critically needed to be identified. In the present study, 3 Gene Expression Omnibus (GEO) datasets (GSE46408, GSE65372 and GSE84402) were used to analyze the differentially expressed genes (DEGs) between HCC and non‑tumor liver tissues. Gene Ontology (GO) and Kyoto Encyclopedia of Genes and Genomes (KEGG) enrichment analyses were conducted to clarify the functional roles of DEGs. A protein‑protein interaction network was established to screen the hub genes associated with HCC. The prognostic values of hub genes in HCC patients were analyzed using The Cancer Genome Atlas (TCGA) database. The expression levels of hub genes were validated based on ONCOMINE, TCGA and Human Protein Atlas (HPA) databases. Notably, 56 upregulated and 33 downregulated DEGs were markedly enriched under various GO terms and four KEGG terms. Among these DEGs, 10 hub genes with high connectivity degree were identified, including cyclin B1, cyclin A2, cyclin B2, condensin complex subunit 3, PDZ binding kinase, nucleolar and spindle‑associated protein 1, aurora kinase A, ZW10 interacting kinetochore protein, protein regulator of cytokinesis 1 and kinesin family member 4A. The upregulated expression levels of these hub genes in HCC tissues were further confirmed by ONCOMINE, TCGA, and HPA databases. Additionally, the increased mRNA expression of each hub gene was related to the unfavorable disease‑free survival and overall survival of HCC patients. The present study identified ten genes associated with HCC, which may help to provide candidate targets for the diagnosis and treatment of HCC.

Keywords: hepatocellular carcinoma; differently expressed genes; bioinformatics analysis; hub gene; prognosis.


Figures

Figure 1.
Figure 1.
Identification of common DEGs from GSE46408, GSE65372 and GSE84402 datasets. Venn diagram of (A) downregulated and (B) upregulated DEGs based on the three GEO datasets. (C) Volcano plot of the 89 DEGs. Red, upregulation; green, downregulation. The intersecting areas represent the commonly altered DEGs. The t-test was used to analyze DEGs, with the cut-off criteria of |logFC|>1.0 and adj. P<0.05. GSE46408 (6 HCC patients vs. 6 controls), GSE65372 (17 HCC patients vs. 15 controls), GSE84402 (14 HCC patients vs. 14 controls); DEG, differentially expressed gene; GEO, Gene Expression Omnibus; logFC, log-fold change; HCC, hepatocellular carcinoma.
Figure 2.
Figure 2.
GO annotation and KEGG pathway enrichment analysis of DEGs. The top 10 enriched GO (A) BP, (B) CC and (C) MF terms as well (D) KEGG pathways. GO, gene ontology; KEGG, Kyoto encyclopedia of genes and genomes; DEG, differentially expressed gene; BP, biological process; CC, cellular component; MF, molecular function.
Figure 2.
Figure 2.
GO annotation and KEGG pathway enrichment analysis of DEGs. The top 10 enriched GO (A) BP, (B) CC and (C) MF terms as well (D) KEGG pathways. GO, gene ontology; KEGG, Kyoto encyclopedia of genes and genomes; DEG, differentially expressed gene; BP, biological process; CC, cellular component; MF, molecular function.
Figure 3.
Figure 3.
PPIN and hub gene identification. (A) PPIN was constructed by all the 89 DEGs using STRING database. (B) The top 10 hub genes in the PPIN were screened by Cytoscape (v3.6.1) plugin cytoHubba based on their connectivity degree. The 10 identified hub genes such as CCNB1, CCNA2, CCNB2, NCAPG, PBK, NUSAP1, AURKA, ZWINT, PRC1 and KIF4A are displayed from red (high degree value) to yellow (low degree value). (C) KEGG pathway enrichment analysis of the 10 hub genes. PPIN, protein-protein interaction network; DEG, differentially expressed gene; STRING, search tool for the retrieval of interacting genes; KEGG, Kyoto encyclopedia of genes and genomes.
Figure 4.
Figure 4.
Meta-analysis on the mRNA expression levels of (A) CCNB1, (B) CCNA2, (C) CCNB2, (D) NCAPG, (E) PBK, (F) NUSAP1, (G) AURKA, (H) ZWINT, (I) PRC1 and (J) KIF4A in HCC tissues vs. non-cancerous liver tissues using the five ONCOMINE datasets. The colored squares represent the median rank of these genes (vs. normal tissue) across the five datasets. The significance level for the median rank analysis was set at P<0.05. HCC, hepatocellular carcinoma.
Figure 5.
Figure 5.
Hierarchical clustering analysis of the hub genes in HCC (n=371) and normal liver tissue (n=50) was conducted using the UCSC Xena browser. HCC, hepatocellular carcinoma.
Figure 6.
Figure 6.
Validation of the mRNA expression levels of (A) CCNB1, (B) CCNA2, (C) CCNB2, (D) NCAPG, (E) PBK, (F) NUSAP1, (G) AURKA, (H) ZWINT, (I) PRC1, and (J) KIF4A in LIHC tissues and normal liver tissues using GEPIA. These ten box plots are based on 360 HCC samples (marked in red) and 160 normal samples (marked in gray). *P<0.01 was considered statistically significant. LIHC, liver hepatocellular carcinoma; HCC, hepatocellular carcinoma.
Figure 7.
Figure 7.
Representative immunohistochemistry images of (A) CCNB1, (B) CCNA2, (C) CCNB2, (D) NCAPG, (E) PBK, (F) NUSAP1, (G) AURKA, (H) ZWINT, (I) PRC1, and (J) KIF4A in HCC and non-cancerous liver tissues derived from the HPA database. HCC, hepatocellular carcinoma; HPA, Human Protein Atlas.
Figure 7.
Figure 7.
Representative immunohistochemistry images of (A) CCNB1, (B) CCNA2, (C) CCNB2, (D) NCAPG, (E) PBK, (F) NUSAP1, (G) AURKA, (H) ZWINT, (I) PRC1, and (J) KIF4A in HCC and non-cancerous liver tissues derived from the HPA database. HCC, hepatocellular carcinoma; HPA, Human Protein Atlas.
Figure 8.
Figure 8.
Alteration frequency and prognosis of the 10 hub genes. (A) The summary of the cancer types in the cBioPortal was used to calculate the percentages of LIHC cases with the 10 altered hub genes. (B) mRNA expression alterations (RNA Seq V2 RSEM) of the 10 hub genes in LIHC patients. (C) OS and (D) DFS/PFS of LIHC patients with altered (red) and unaltered (blue) mRNA expression of the 10 hub genes. LIHC, liver hepatocellular carcinoma; OS, overall survival; DFS/PFS, disease-free survival/progression-free survival.
Figure 9.
Figure 9.
OS of the 10 hub genes overexpressed in patients with liver cancer was analyzed by Kaplan-Meier plotter. Data are presented as the hazard ratio with a 95% confidence interval. CCNB1, log-rank P=3.4e-05; CCNA2, log-rank P=0.00018; CCNB2, log-rank P=0.0013; NCAPG, log-rank P=8.8e-06; PBK, log-rank P=4.8e-05; NUSAP1, log-rank P=0.0046; AURKA, log-rank P=0.0011; ZWINT, log-rank P=8.5e-07; PRC1, log-rank P=0.00023; and KIF4A, log-rank P=0.00014. Log-rank P<0.01 was regarded as statistically significant. OS, overall survival.
Figure 10.
Figure 10.
DFS of the 10 hub genes overexpressed in LIHC patients. Data are presented as the hazard ratio with a 95% confidence interval. CCNB1, log-rank P=2.8e-06; CCNA2, log-rank P=0.0037; CCNB2, log-rank P=0.0064; NCAPG, log-rank P=0.00246; PBK, log-rank P=0.006; NUSAP1, log-rank P=7e-04; AURKA, log-rank P=0.0012; ZWINT, log-rank P=7.8e-05; PRC1, log-rank P=0.00045; and KIF4A, log-rank P=0.0011. Log-rank P<0.01 was considered statistically significant. DFS, disease-free survival; LIHC, liver hepatocellular carcinoma.

References

    1. Bray F, Ferlay J, Soerjomataram I, Siegel RL, Torre LA, Jemal A. Global cancer statistics 2018: GLOBOCAN estimates of incidence and mortality worldwide for 36 cancers in 185 countries. CA Cancer J Clin. 2018;68:394–424. doi: 10.3322/caac.21492. - DOI - PubMed
    1. Chen W, Zheng R, Baade PD, Zhang S, Zeng H, Bray F, Jemal A, Yu XQ, He J. Cancer statistics in China, 2015. CA Cancer J Clin. 2016;66:115–132. doi: 10.3322/caac.21338. - DOI - PubMed
    1. Liu S, Yao X, Zhang D, Sheng J, Wen X, Wang Q, Chen G, Li Z, Du Z, Zhang X. Analysis of transcription factor-related regulatory networks based on bioinformatics analysis and validation in hepatocellular carcinoma. Biomed Res Int. 2018;2018:1431396. doi: 10.1155/2018/1431396. - DOI - PMC - PubMed
    1. Gao X, Wang X, Zhang S. Bioinformatics identification of crucial genes and pathways associated with hepatocellular carcinoma. Biosci Rep. 2018;38 doi: 10.1042/BSR20181441. - DOI - PMC - PubMed
    1. Zhuang L, Yang Z, Meng Z. Upregulation of BUB1B, CCNB1, CDC7, CDC20, and MCM3 in tumor tissues predicted worse overall survival and disease-free survival in hepatocellular carcinoma patients. Biomed Res Int. 2018;2018:7897346. doi: 10.1155/2018/7897346. - DOI - PMC - PubMed