. 2020 Jan;56(1):85-100.
doi: 10.3892/ijo.2019.4910. Epub 2019 Nov 13.

LncRNA SPRY4‑IT1 promotes progression of osteosarcoma by regulating ZEB1 and ZEB2 expression through sponging of miR‑101 activity

Affiliations

LncRNA SPRY4‑IT1 promotes progression of osteosarcoma by regulating ZEB1 and ZEB2 expression through sponging of miR‑101 activity

Hui Yao et al. Int J Oncol. 2020 Jan.

Abstract

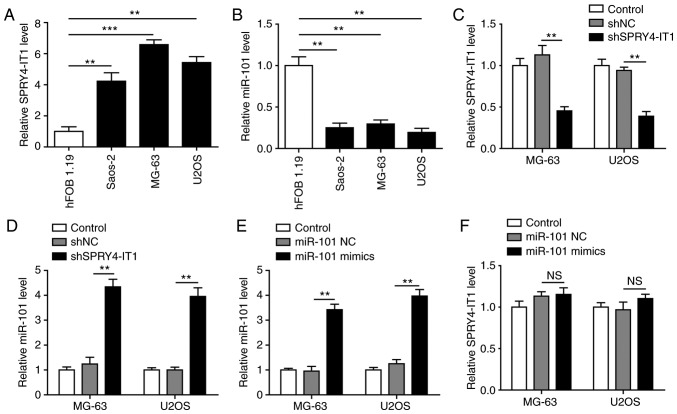
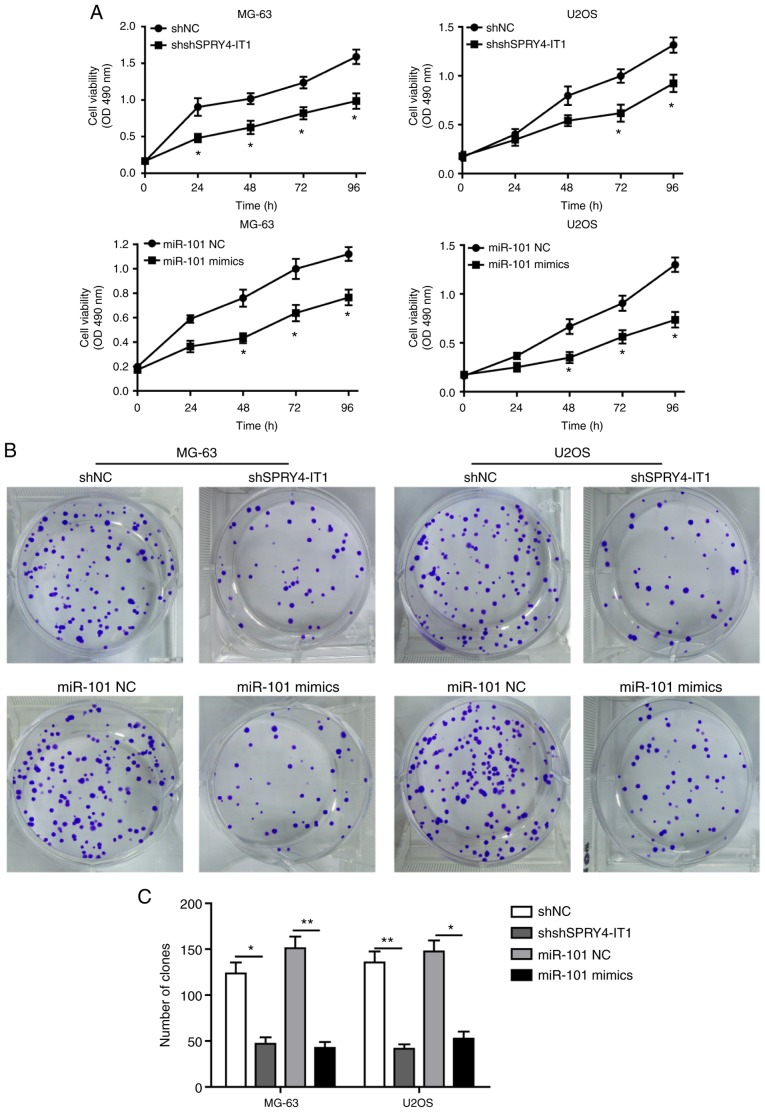
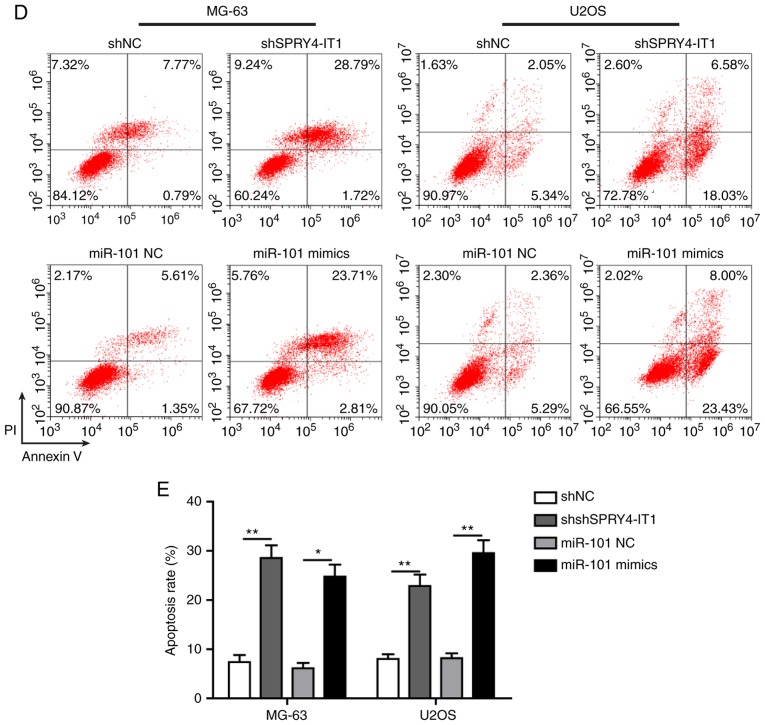
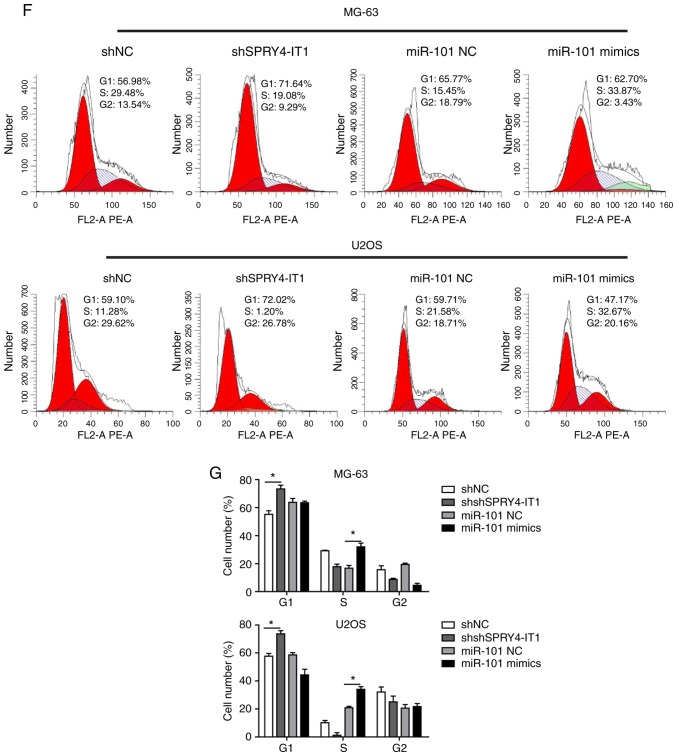
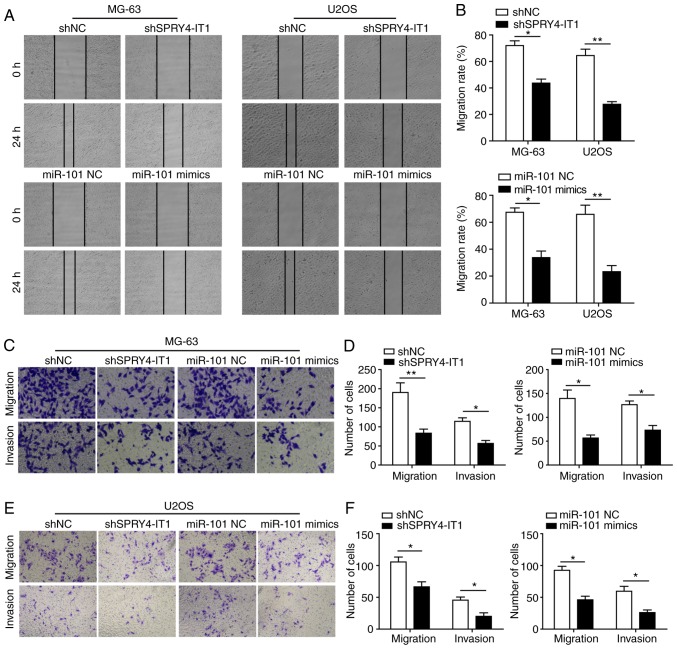
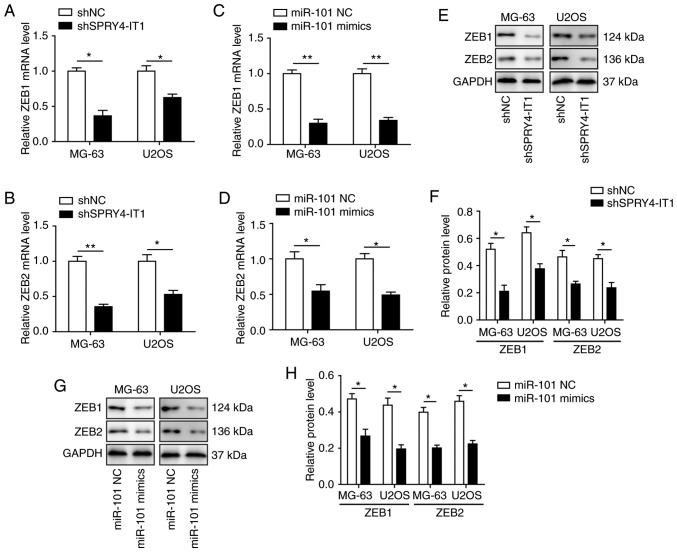
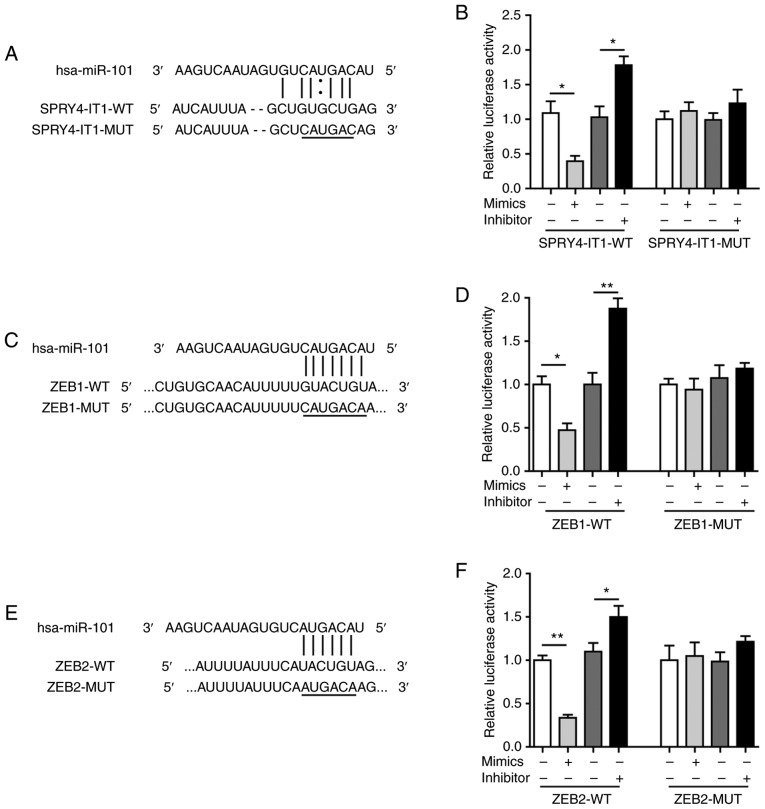
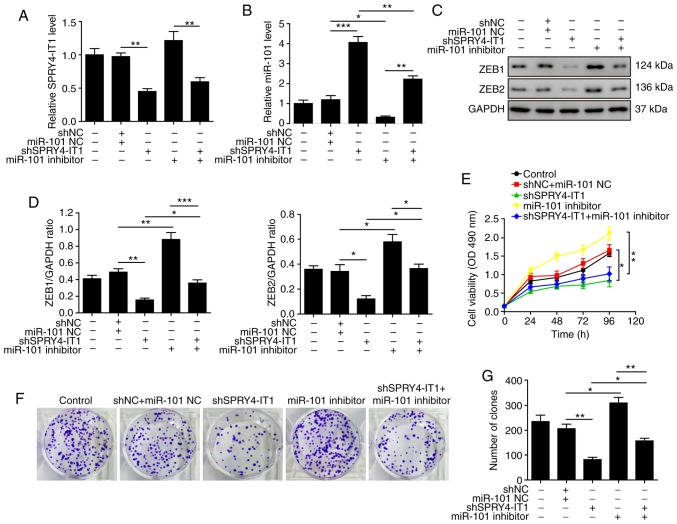
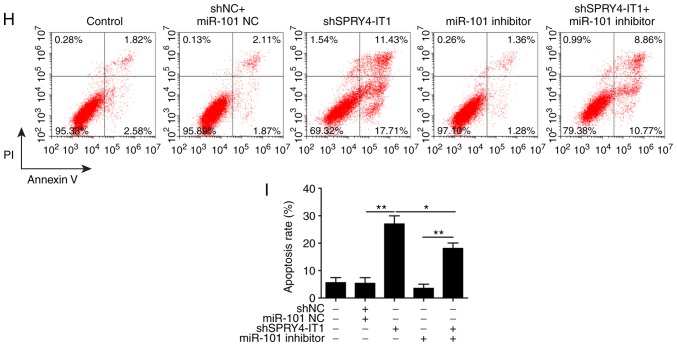
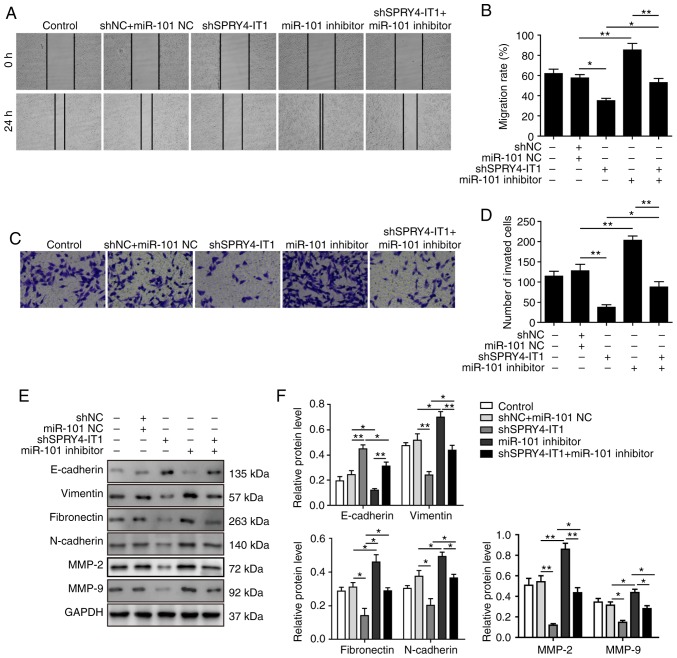
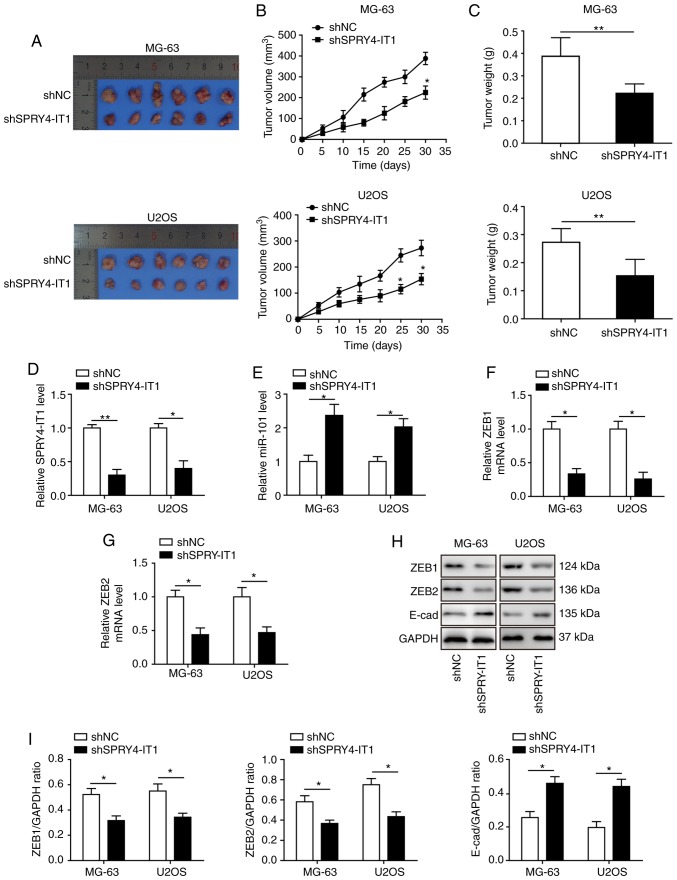
Long non‑coding (lnc)RNA sprouty receptor tyrosine kinase signalling antagonist 4‑intronic transcript 1 (SPRY4‑IT1) has been demonstrated to serve a critical role in the tumorigenesis of osteosarcoma (OS); however, the specific underlying mechanism remains unclear. The aim of the present study was to examine the interactions between SPRY4‑IT1 and its downstream effectors, to determine if any of the interactions contributed to SPRY4‑IT1‑mediated proliferation, migration and invasion in cancer cells. A signalling cascade which involved SPRY4‑IT1, miR‑101 and zinc finger E‑box‑binding homeoboxes (ZEBs) was examined in the present study. Intracellular SPRY4‑IT1 and miR‑101 expression levels were altered through transfection to assess their effect on proliferation, cell cycle progression, survival, migration and invasion. A dual‑luciferase assay was utilized to determine the association between SPRY4‑IT1/miR‑101 and ZEBs/miR‑101 and nude mouse xenograft experiments were performed to determine the effect of SPRY4‑IT1 in vivo. The results indicated that the SPRY4‑IT1 levels were negatively associated with miR‑101 expression levels in OS cells, an association which was not observed in the normal osteoblast cells. SPRY4‑IT1 knockdown or miR‑101 overexpression reduced proliferation, cell cycle progression, survival, migration and invasion of MG‑63 and U2OS cells. SPRY4‑IT1 knockdown was accompanied by increased expression of miR‑101 and E‑cadherin levels, as well as decreased expression levels of ZEB1/2 and other epithelial‑mesenchymal transition‑associated proteins. Simultaneous knockdown of SPRY4‑IT1 and inhibition of miR‑101 partially reversed the anti‑tumour effects of SPRY4‑IT1 inhibition in vitro. Consistent with these findings, short hairpin RNA targeting SPRY4‑IT1 also hindered xenograft tumour growth and altered the levels of miR‑101, ZEB1/2 and E‑cadherin in vivo. Dual‑luciferase reporter assays demonstrated that SPRY4‑IT1 may have regulated the expression of ZEB1 and ZEB2 by sponging miR‑101. In conclusion, SPRY4‑IT1 inhibition increased miR‑101 levels, resulting in downregulation of ZEB1/2 expression and thus exerting anti‑tumour effects in OS.


Figures

Figure 1
Figure 1
Increased SPRY4-IT1 expression results in reduced miR-101 expression in OS cells. (A) Expression of SPRY4-IT1 was significantly upregulated in OS cells compared with the normal osteoblast cells. (B) Expression of miR-101 was significantly downregulated in OS cells compared with normal osteoblast cells. (C) Transfection of shSPRY4-IT1 significantly reduced SPRY4-IT1 levels in MG-63 and U2OS cells. (D) SPRY4-IT1 knockdown resulted in upregulation of miR-101 expression levels in OS cells. (E) Transfection with miR-101 mimics significantly increased miR-101 expression levels. (F) Transfection of miR-101 mimics did not affect SPRY4-IT1 expression. Data are presented as the mean ± standard deviation of three independent experiments. **P<0.01, ***P<0.001. n.s. not significant; SPRY4-IT1, sprouty receptor tyrosine kinase signalling antagonist 4-intronic transcript 1; miR, microRNA; OS, osteosarcoma; sh, short hairpin; NC, negative control.
Figure 2
Figure 2
SPRY4-IT1 silencing or miR-101 overexpression reduces OS cell growth. (A) SPRY4-IT1 knockdown or miR-101 overexpression significantly decreased proliferation of MG-63 and U2OS cells as shown using an MTT assay. (B and C) SPRY4-IT1 knockdown or miR-101 overexpression significantly reduced colony formation in MG-63 and U2OS cells. Data are presented as the mean ± standard deviation of three independent experiments. *P<0.05, **P<0.01. SPRY4-IT1 silencing or miR-101 overexpression reduces OS cell growth. (D and E) SPRY4-IT1 knockdown or miR-101 overexpression significantly increased apoptosis in both OS cell lines. Data are presented as the mean ± standard deviation of three independent experiments. *P<0.05, **P<0.01. SPRY4-IT1 silencing or miR-101 overexpression reduces OS cell growth. (F and G) SPRY4-IT1 knockdown or miR-101 overexpression resulted in significant arrest of the cell cycle in MG-63 and U2OS cells. Data are presented as the mean ± standard deviation of three independent experiments. *P<0.05, **P<0.01. SPRY4-IT1, sprouty receptor tyrosine kinase signalling antagonist 4-intronic transcript 1; miR, microRNA; OS, osteosarcoma; sh, short hairpin; NC, negative control; OD, optical density; PI, propidium iodide.
Figure 2
Figure 2
SPRY4-IT1 silencing or miR-101 overexpression reduces OS cell growth. (A) SPRY4-IT1 knockdown or miR-101 overexpression significantly decreased proliferation of MG-63 and U2OS cells as shown using an MTT assay. (B and C) SPRY4-IT1 knockdown or miR-101 overexpression significantly reduced colony formation in MG-63 and U2OS cells. Data are presented as the mean ± standard deviation of three independent experiments. *P<0.05, **P<0.01. SPRY4-IT1 silencing or miR-101 overexpression reduces OS cell growth. (D and E) SPRY4-IT1 knockdown or miR-101 overexpression significantly increased apoptosis in both OS cell lines. Data are presented as the mean ± standard deviation of three independent experiments. *P<0.05, **P<0.01. SPRY4-IT1 silencing or miR-101 overexpression reduces OS cell growth. (F and G) SPRY4-IT1 knockdown or miR-101 overexpression resulted in significant arrest of the cell cycle in MG-63 and U2OS cells. Data are presented as the mean ± standard deviation of three independent experiments. *P<0.05, **P<0.01. SPRY4-IT1, sprouty receptor tyrosine kinase signalling antagonist 4-intronic transcript 1; miR, microRNA; OS, osteosarcoma; sh, short hairpin; NC, negative control; OD, optical density; PI, propidium iodide.
Figure 3
Figure 3
SPRY4-IT1 knockdown or miR-101 overexpression reduces the migratory and invasive capacity of OS cells. (A and B) SPRY4-IT1 knockdown or miR-101 overexpression significantly reduced the migratory rate of MG-63 and U2OS cells in the wound healing assay. SPRY4-IT1 knockdown or miR-101 overexpression reduced Transwell migration and invasion of (C and D) MG-63 and (E and F) U2OS cells. Data are presented as the mean ± standard deviation of three independent experiments. *P<0.05, **P<0.01. SPRY4-IT1, sprouty receptor tyrosine kinase signalling antagonist 4-intronic transcript 1; miR, microRNA; OS, osteosarcoma; sh, short hairpin; NC, negative control.
Figure 4
Figure 4
SPRY4-IT1 and miR-101 modulate the expression of ZEB1 and ZEB2 in OS cells. shSPRY4-IT1 significantly decreased the mRNA expression levels of (A) ZEB1 and (B) ZEB2 in MG-63 and U2OS cells. miR-101 overexpression significantly decreased the mRNA expression levels of (C) ZEB1 and (D) ZEB2 in MG-63 and U2OS cells. (E and F) Western blotting demonstrated that SPRY4-IT1 knockdown decreased ZEB1 and ZEB2 protein expression levels in MG-63 and U2OS cells. (G and H) Western blotting demonstrated that miR-101 overexpression decreased ZEB1 and ZEB2 protein expression levels in MG-63 and U2OS cells. Data are presented as the mean ± standard deviation of three independent experiments. *P<0.05, **P<0.01. SPRY4-IT1, sprouty receptor tyrosine kinase signalling antagonist 4-intronic transcript 1; miR, microRNA; OS, osteosarcoma; sh, short hairpin; NC, negative control; ZEB, zinc finger E-box-binding homeoboxes.
Figure 5
Figure 5
SPRY4-IT1 sponges miR-101 to regulate the expression of ZEB1 and ZEB2. (A) Predicted binding site between SPRY4-IT1 and miR-101. (B) miR-101 mimics reduced, whereas miR-101 inhibitor increased, luciferase activity in the SPRY4-IT1-WT group. Luciferase activity was not altered by miR-101 mimics or inhibitors in the SPRY4-IT1-MUT group. (C) Predicted binding site between miR-101 and ZEB1. (D) miR-101 mimics reduced, whereas miR-101 inhibitor increased, luciferase activity in the ZEB1-WT group. Luciferase activity was not altered by miR-101 mimics or inhibitors in the ZEB1-MUT group. (E) Predicted binding site between miR-101 and ZEB2. (F) miR-101 mimics reduced, whereas miR-101 inhibitor increased, luciferase activity in the ZEB2-WT group. Luciferase activity was not altered by miR-101 mimics or inhibitors in the ZEB2-MUT group. Data are presented as the mean ± standard deviation of three independent experiments. *P<0.05, **P<0.01. SPRY4-IT1, sprouty receptor tyrosine kinase signalling antagonist 4-intronic transcript 1; miR, microRNA; ZEB, zinc finger E-box-binding homeoboxes.
Figure 6
Figure 6
SPRY4-IT1 knockdown reduces cell growth through upregulation of miR-101 in MG-63 cells. (A) Transfection of shSPRY4-IT1 significantly decreased SPRY4-IT1 mRNA expression levels, whereas transfection of miR-101 inhibitor did not affect SPRY4-IT1 mRNA expression levels. (B) SPRY4-IT1 knockdown significantly increased, whereas miR-101 inhibitor significantly reduced, miR-101 levels. The increase in miR-101 induced by shSPRY4-IT1 was significantly reversed by simultaneous transfection of miR-101 inhibitors. (C and D) SPRY4-IT1 knockdown significantly decreased, whereas miR-101 inhibitor increased ZEB1 and ZEB2 protein expression levels. The reduction in ZEB1 and ZEB2 by shSPRY4-IT1 was partially abolished by transfection of miR-101 inhibitor. (E) SPRY4-IT1 knockdown decreased OS cell growth in the MTT assay, and simultaneous transfection with miR-101 inhibitor reversed the effects of shSPRY4-IT1 on cell growth. (F and G) SPRY4-IT1 knockdown significantly decreased, whereas miR-101 inhibitor increased colony formation. Reduced colony formation in cells transfected with shSPRY4-IT1 was partially abolished by simultaneous transfection with miR-101 inhibitor. (H and I) SPRY4-IT1 knockdown significantly increased, whereas miR-101 inhibitor decreased apoptosis. shSPRY4-IT1-induced apoptosis was partially reversed by simultaneous transfection with miR-101 inhibitor. Data are presented as the mean ± standard deviation of three independent experiments. *P<0.05, **P<0.01. SPRY4-IT1, sprouty receptor tyrosine kinase signalling antagonist 4-intronic transcript 1; miR, microRNA; OS, osteosarcoma; sh, short hairpin; NC, negative control; OD, optical density; PI, propidium iodide; ZEB, zinc finger E-box-binding homeoboxes.
Figure 6
Figure 6
SPRY4-IT1 knockdown reduces cell growth through upregulation of miR-101 in MG-63 cells. (A) Transfection of shSPRY4-IT1 significantly decreased SPRY4-IT1 mRNA expression levels, whereas transfection of miR-101 inhibitor did not affect SPRY4-IT1 mRNA expression levels. (B) SPRY4-IT1 knockdown significantly increased, whereas miR-101 inhibitor significantly reduced, miR-101 levels. The increase in miR-101 induced by shSPRY4-IT1 was significantly reversed by simultaneous transfection of miR-101 inhibitors. (C and D) SPRY4-IT1 knockdown significantly decreased, whereas miR-101 inhibitor increased ZEB1 and ZEB2 protein expression levels. The reduction in ZEB1 and ZEB2 by shSPRY4-IT1 was partially abolished by transfection of miR-101 inhibitor. (E) SPRY4-IT1 knockdown decreased OS cell growth in the MTT assay, and simultaneous transfection with miR-101 inhibitor reversed the effects of shSPRY4-IT1 on cell growth. (F and G) SPRY4-IT1 knockdown significantly decreased, whereas miR-101 inhibitor increased colony formation. Reduced colony formation in cells transfected with shSPRY4-IT1 was partially abolished by simultaneous transfection with miR-101 inhibitor. (H and I) SPRY4-IT1 knockdown significantly increased, whereas miR-101 inhibitor decreased apoptosis. shSPRY4-IT1-induced apoptosis was partially reversed by simultaneous transfection with miR-101 inhibitor. Data are presented as the mean ± standard deviation of three independent experiments. *P<0.05, **P<0.01. SPRY4-IT1, sprouty receptor tyrosine kinase signalling antagonist 4-intronic transcript 1; miR, microRNA; OS, osteosarcoma; sh, short hairpin; NC, negative control; OD, optical density; PI, propidium iodide; ZEB, zinc finger E-box-binding homeoboxes.
Figure 7
Figure 7
miR-101 inhibitor reverses the shSPRY4-IT1-mediated suppression of cell migration and invasion in MG-63 cells. (A and B) SPRY4-IT1 knockdown significantly delayed wound closure, whereas miR-101 inhibitor increased wound closure. The shSPRY4-IT1-induced decrease in migratory rate was partially reversed by miR-101 inhibitor. (C and D) SPRY4-IT1 knockdown significantly reduced cell invasion, whereas miR-101 inhibitor increased cell invasion. miR-101 expression in SPRY4-IT1 knockdown cells reversed the effects of SPRY4-IT1 knockdown on cell invasion. (E and F) shSPRY4-IT1 increased E-cadherin protein expression levels, whereas vimentin, fibronectin, N-cadherin, MMP-2 and MMP-9 levels were decreased by SPRY4-IT1 knockdown, whereas cells transfected with miR-101 inhibitors exhibited the opposite changes in protein expression levels of epithelial-mesenchymal transition-associated proteins. Transfection of miR-101 inhibitor reversed the effects of shSPRY4-IT1 transfection. Data are presented as the mean ± standard deviation of three independent experiments. *P<0.05, **P<0.01. SPRY4-IT1, sprouty receptor tyrosine kinase signalling antagonist 4-intronic transcript 1; miR, microRNA; sh, short hairpin; NC, negative control; MMP, matrix metalloproteinase.
Figure 8
Figure 8
SPRY4-IT1 knockdown exhibits anti-tumour effects in a xenograft mouse model of OS. (A) Xenograft tumours of OS cell lines stably expressing shNC or shSPRY4-IT1. (B) SPRY4-IT1 knockdown significantly reduced tumour volume after 30 days. (C) SPRY4-IT1 knockdown significantly reduced tumour weight in vivo. (D) SPRY4-IT1 levels were significantly lower in the shSPRY4-IT1 xenograft tumour tissues compared with the scrambled control xenograft tumours. (E) miR-101 levels were significantly increased in shSPRY4-IT1 xenograft tumour tissues compared with the scrambled control tumours. (F) ZEB1 mRNA expression levels were significantly lower in the shSPRY4-IT1 xenograft tumour tissues containing shSPRY4-IT1 compared with the scrambled control tumours. (G) ZEB2 mRNA expression levels were significantly lower in shSPRY4-IT1 xenograft tumour tissues compared with the scrambled control tumours. (H and I) ZEB1 and ZEB2 protein expression levels were significantly lower, whereas E-cadherin protein levels were significantly higher, in the shSPRY4-IT1 xenograft tumour tissues compared with the scrambled control tumours. Data are presented as the mean ± standard deviation of three independent experiments. *P<0.05, **P<0.01. SPRY4-IT1, sprouty receptor tyrosine kinase signalling antagonist 4-intronic transcript 1; miR, microRNA; OS, osteosarcoma; sh, short hairpin; NC, negative control; ZEB, zinc finger E-box-binding homeoboxes.

Similar articles

Cited by

References

    1. Anninga JK, Gelderblom H, Fiocco M, Kroep JR, Taminiau AHM, Hogendoorn PC, Egeler RM. Chemotherapeutic adjuvant treatment for osteosarcoma: Where do we stand? Eur J Cancer. 2011;47:2431–2445. doi: 10.1016/j.ejca.2011.05.030. - DOI - PubMed
    1. Zhang Y, He Z, Duan Y, Wang C, Kamar S, Shi X, Yang J, Yang J, Zhao N, Han L, et al. Does intensified chemotherapy increase survival outcomes of osteosarcoma patients? A meta-analysis. J bone Oncol. 2018;12:54–60. doi: 10.1016/j.jbo.2018.04.001. - DOI - PMC - PubMed
    1. Yang G, Yuan J, Li K. EMT transcription factors: Implication in osteosarcoma. Med Oncol. 2013;30:697. doi: 10.1007/s12032-013-0697-2. - DOI - PubMed
    1. Ye X, Weinberg RA. Epithelial-mesenchymal plasticity: A central regulator of cancer progression. Trends Cell Biol. 2015;25:675–686. doi: 10.1016/j.tcb.2015.07.012. - DOI - PMC - PubMed
    1. Zhang X, Lei X. Expression of Zeb1 and Zeb2 indicates metastasis and unfavorable prognosis in osteosarcoma. Int J Clin Exp Pathol. 2017;10:611–617.

MeSH terms